Displaying Tables With reactable
1 Objectives
This section is an introduction displaying data in tables with reactable in your R Markdown reports.
2 Resources
Be sure to check out the previous section on flow control statements.
Slides: this is an extra lesson, so there aren’t currently slides available (yet!)
RStudio.Cloud: this is an extra lesson, so there isn’t an RStudio.Cloud project (yet!)
3 Packages
We’ll be covering the reactable package for displaying tables in R Markdown.
library(tidyverse)
library(gt)
library(reactable)
library(DT)
4 Yahoo finance data
We’re going to be returning to stock data for this section. Stock (or quant) data is typically presented on the web or in a dashboard, so it’s great for demonstrating the capabilities of R table packages.
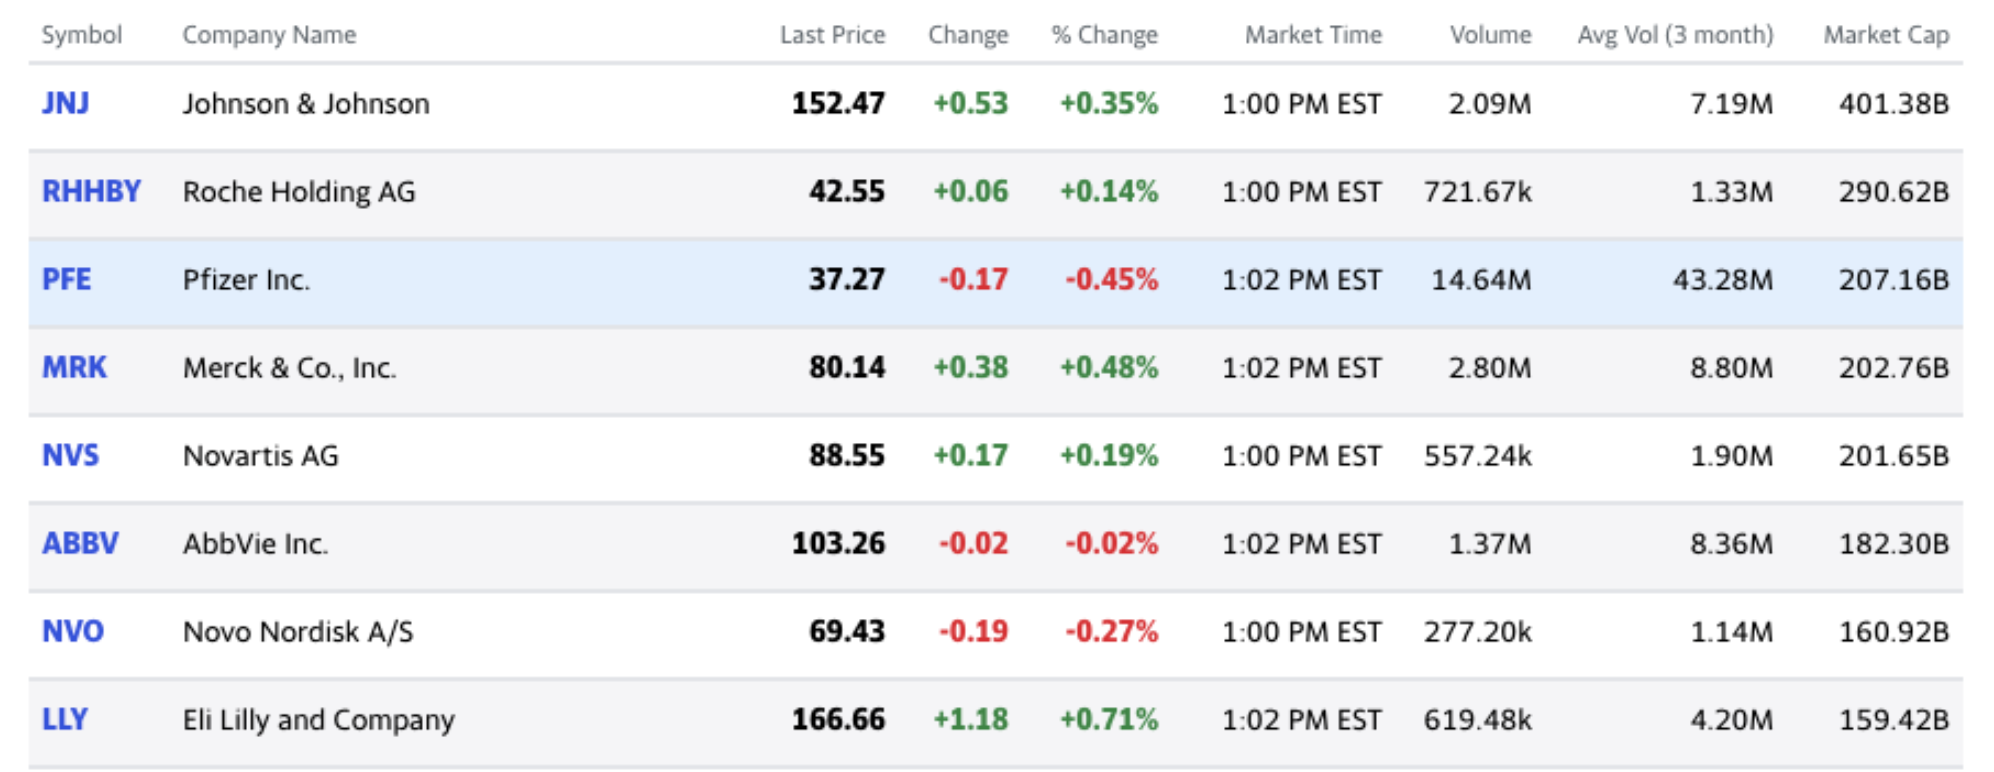
Here is the source for the dataset above: https://finance.yahoo.com/u/yahoo-finance/watchlists/biotech-and-drug-stocks
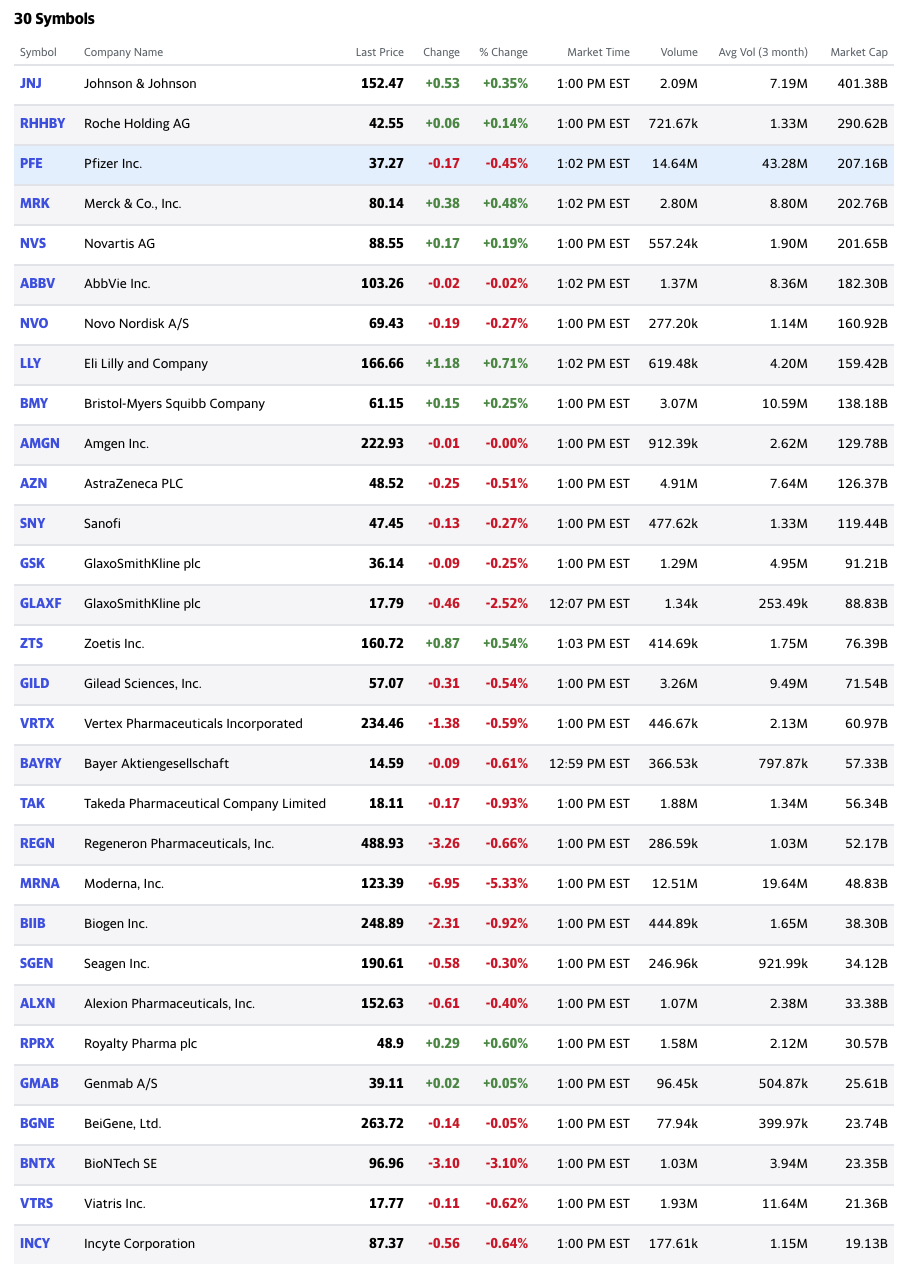
I imported these data using the datapasta package on 2020-12-24.
tibble::tribble(
     ~Symbol,                           ~Company.Name, ~Last.Price, ~Change, ~`%.Change`,   ~Market.Time,   ~Volume, ~`Avg.Vol.(3.month)`, ~Market.Cap,
       "JNJ",                     "Johnson & Johnson",      152.47,    0.53,    "+0.35%",  "1:00 PM EST",   "2.09M",              "7.19M",   "401.38B",
     "RHHBY",                      "Roche Holding AG",       42.55,    0.06,    "+0.14%",  "1:00 PM EST", "721.67k",              "1.33M",   "290.62B",
       "PFE",                           "Pfizer Inc.",       37.27,   -0.17,    "-0.45%",  "1:02 PM EST",  "14.64M",             "43.28M",   "207.16B",
       "MRK",                     "Merck & Co., Inc.",       80.14,    0.38,    "+0.48%",  "1:02 PM EST",   "2.80M",              "8.80M",   "202.76B",
       "NVS",                           "Novartis AG",       88.55,    0.17,    "+0.19%",  "1:00 PM EST", "557.24k",              "1.90M",   "201.65B",
      "ABBV",                           "AbbVie Inc.",      103.26,   -0.02,    "-0.02%",  "1:02 PM EST",   "1.37M",              "8.36M",   "182.30B",
       "NVO",                      "Novo Nordisk A/S",       69.43,   -0.19,    "-0.27%",  "1:00 PM EST", "277.20k",              "1.14M",   "160.92B",
       "LLY",                 "Eli Lilly and Company",      166.66,    1.18,    "+0.71%",  "1:02 PM EST", "619.48k",              "4.20M",   "159.42B",
       "BMY",          "Bristol-Myers Squibb Company",       61.15,    0.15,    "+0.25%",  "1:00 PM EST",   "3.07M",             "10.59M",   "138.18B",
      "AMGN",                            "Amgen Inc.",      222.93,   -0.01,    "-0.00%",  "1:00 PM EST", "912.39k",              "2.62M",   "129.78B",
       "AZN",                       "AstraZeneca PLC",       48.52,   -0.25,    "-0.51%",  "1:00 PM EST",   "4.91M",              "7.64M",   "126.37B",
       "SNY",                                "Sanofi",       47.45,   -0.13,    "-0.27%",  "1:00 PM EST", "477.62k",              "1.33M",   "119.44B",
       "GSK",                   "GlaxoSmithKline plc",       36.14,   -0.09,    "-0.25%",  "1:00 PM EST",   "1.29M",              "4.95M",    "91.21B",
     "GLAXF",                   "GlaxoSmithKline plc",       17.79,   -0.46,    "-2.52%", "12:07 PM EST",   "1.34k",            "253.49k",    "88.83B",
       "ZTS",                           "Zoetis Inc.",      160.72,    0.87,    "+0.54%",  "1:03 PM EST", "414.69k",              "1.75M",    "76.39B",
      "GILD",                 "Gilead Sciences, Inc.",       57.07,   -0.31,    "-0.54%",  "1:00 PM EST",   "3.26M",              "9.49M",    "71.54B",
      "VRTX",   "Vertex Pharmaceuticals Incorporated",      234.46,   -1.38,    "-0.59%",  "1:00 PM EST", "446.67k",              "2.13M",    "60.97B",
     "BAYRY",              "Bayer Aktiengesellschaft",       14.59,   -0.09,    "-0.61%", "12:59 PM EST", "366.53k",            "797.87k",    "57.33B",
       "TAK", "Takeda Pharmaceutical Company Limited",       18.11,   -0.17,    "-0.93%",  "1:00 PM EST",   "1.88M",              "1.34M",    "56.34B",
      "REGN",       "Regeneron Pharmaceuticals, Inc.",      488.93,   -3.26,    "-0.66%",  "1:00 PM EST", "286.59k",              "1.03M",    "52.17B",
      "MRNA",                         "Moderna, Inc.",      123.39,   -6.95,    "-5.33%",  "1:00 PM EST",  "12.51M",             "19.64M",    "48.83B",
      "BIIB",                           "Biogen Inc.",      248.89,   -2.31,    "-0.92%",  "1:00 PM EST", "444.89k",              "1.65M",    "38.30B",
      "SGEN",                           "Seagen Inc.",      190.61,   -0.58,    "-0.30%",  "1:00 PM EST", "246.96k",            "921.99k",    "34.12B",
      "ALXN",         "Alexion Pharmaceuticals, Inc.",      152.63,   -0.61,    "-0.40%",  "1:00 PM EST",   "1.07M",              "2.38M",    "33.38B",
      "RPRX",                    "Royalty Pharma plc",        48.9,    0.29,    "+0.60%",  "1:00 PM EST",   "1.58M",              "2.12M",    "30.57B",
      "GMAB",                            "Genmab A/S",       39.11,    0.02,    "+0.05%",  "1:00 PM EST",  "96.45k",            "504.87k",    "25.61B",
      "BGNE",                         "BeiGene, Ltd.",      263.72,   -0.14,    "-0.05%",  "1:00 PM EST",  "77.94k",            "399.97k",    "23.74B",
      "BNTX",                           "BioNTech SE",       96.96,    -3.1,    "-3.10%",  "1:00 PM EST",   "1.03M",              "3.94M",    "23.35B",
      "VTRS",                          "Viatris Inc.",       17.77,   -0.11,    "-0.62%",  "1:00 PM EST",   "1.93M",             "11.64M",    "21.36B",
      "INCY",                    "Incyte Corporation",       87.37,   -0.56,    "-0.64%",  "1:00 PM EST", "177.61k",              "1.15M",    "19.13B") -> BioTechStocksPaste
# clean names and export
BioTechStocksPaste %>%
  janitor::clean_names() %>%
  readr::write_csv(x = ., file = "data/2020-12-24-BioTechStocks.csv")
4.1 Example summary table
These data have already been formatted in a way that is great for displaying in a table, but would pose problems if we tried to visualize them in R. For example, the percent_change-market_cap columns have symbols that cause them to be read into R as characters. We would need to wrangle these data quite a bit to get them into a format we could use.
BioTechStocksRaw <- read_csv("data/2020-12-24-BioTechStocks.csv")
BioTechStocksRaw
4.1.1 str_remove_all()
The first step to get these data into a format we can use is to remove the + symbol from the change variable, then convert it to a numerical value (this will result in some missing values).
BioTechStocksRaw %>%
  mutate(
    # change numeric
    change = str_remove_all(string = change, pattern = "^\\+"),
    change = as.numeric(change, na.rm = TRUE)
  )
Next we want to remove the + and % from the percent_change column, and convert this to a numerical value.
BioTechStocksRaw %>%
  mutate(
    # change numeric
    change = str_remove_all(string = change, pattern = "^\\+"),
    change = as.numeric(change, na.rm = TRUE),
    # percent change
    percent_change = str_remove_all(string = percent_change, pattern = "^\\+"),
    percent_change = str_remove_all(string = percent_change, pattern = "\\%"),
    percent_change = as.numeric(percent_change, na.rm = TRUE)
  )
The volume and avg_vol_3_month columns have two different characters k and M that will take some more advanced steps, so we’ll remove the B from market_cap first.
BioTechStocksRaw %>%
  mutate(
    # change numeric
    change = str_remove_all(string = change, pattern = "^\\+"),
    change = as.numeric(change, na.rm = TRUE),
    # percent change
    percent_change = str_remove_all(string = percent_change, pattern = "^\\+"),
    percent_change = str_remove_all(string = percent_change, pattern = "\\%"),
    percent_change = as.numeric(percent_change, na.rm = TRUE),
    # market cap
    market_cap = str_remove_all(string = market_cap, pattern = "B"),
    market_cap = as.numeric(market_cap, na.rm = TRUE)
  )
4.1.2 case_when()
Now, to get the correct value in the volume and avg_vol_3_month columns, we’ll need to create a key variable for k and M, then we can use the keys to conditionally transform the values.
BioTechStocksRaw %>%
  mutate(
    # change numeric
    change = str_remove_all(string = change, pattern = "^\\+"),
    change = as.numeric(change, na.rm = TRUE),
    # percent change
    percent_change = str_remove_all(string = percent_change, pattern = "^\\+"),
    percent_change = str_remove_all(string = percent_change, pattern = "\\%"),
    percent_change = as.numeric(percent_change, na.rm = TRUE),
    # market cap
    market_cap = str_remove_all(string = market_cap, pattern = "B"),
    market_cap = as.numeric(market_cap, na.rm = TRUE),
    # volume key
    volume_key =
      case_when(
        str_detect(string = volume, pattern = "k") ~ "volume ($K)",
        str_detect(string = volume, pattern = "M") ~ "volume ($M)"
      ),
    # identify k vs M in avg_vol_3_month
    avg_vol_3mo_key =
      case_when(
        str_detect(string = avg_vol_3_month, pattern = "k") ~ "volume ($K)",
        str_detect(string = avg_vol_3_month, pattern = "M") ~ "volume ($M)"
      )
  )
Now we want to remove both the M and the k from volume and avg_vol_3_month.
BioTechStocksRaw %>%
  mutate(
    # change numeric
    change = str_remove_all(string = change, pattern = "^\\+"),
    change = as.numeric(change, na.rm = TRUE),
    # percent change
    percent_change = str_remove_all(string = percent_change, pattern = "^\\+"),
    percent_change = str_remove_all(string = percent_change, pattern = "\\%"),
    percent_change = as.numeric(percent_change, na.rm = TRUE),
    # market cap
    market_cap = str_remove_all(string = market_cap, pattern = "B"),
    market_cap = as.numeric(market_cap, na.rm = TRUE),
    # volume key
    volume_key =
      case_when(
        str_detect(string = volume, pattern = "k") ~ "volume ($K)",
        str_detect(string = volume, pattern = "M") ~ "volume ($M)"
      ),
    # identify k vs M in avg_vol_3_month
    avg_vol_3mo_key =
      case_when(
        str_detect(string = avg_vol_3_month, pattern = "k") ~ "volume ($K)",
        str_detect(string = avg_vol_3_month, pattern = "M") ~ "volume ($M)"
      ),
    # remove string from volume
    volume = str_remove_all(string = volume, pattern = "M|k"),
    # volume as numeric
    volume = as.numeric(volume, na.rm = TRUE),
    # remove string from avg_vol_3_month
    avg_vol_3_month = str_remove_all(string = avg_vol_3_month, pattern = "M|k"),
    # average vol 3-month as numeric
    avg_vol_3_month = as.numeric(avg_vol_3_month, na.rm = TRUE)
  )
And now we can use the key variables to transform the values so they are all in millions.
BioTechStocksRaw %>%
  mutate(
    # change numeric
    change = str_remove_all(string = change, pattern = "^\\+"),
    change = as.numeric(change, na.rm = TRUE),
    # percent change
    percent_change = str_remove_all(string = percent_change, pattern = "^\\+"),
    percent_change = str_remove_all(string = percent_change, pattern = "\\%"),
    percent_change = as.numeric(percent_change, na.rm = TRUE),
    # market cap
    market_cap = str_remove_all(string = market_cap, pattern = "B"),
    market_cap = as.numeric(market_cap, na.rm = TRUE),
    # volume key
    volume_key =
      case_when(
        str_detect(string = volume, pattern = "k") ~ "volume ($K)",
        str_detect(string = volume, pattern = "M") ~ "volume ($M)"
      ),
    # identify k vs M in avg_vol_3_month
    avg_vol_3mo_key =
      case_when(
        str_detect(string = avg_vol_3_month, pattern = "k") ~ "volume ($K)",
        str_detect(string = avg_vol_3_month, pattern = "M") ~ "volume ($M)"
      ),
    # remove string from volume
    volume = str_remove_all(string = volume, pattern = "M|k"),
    # volume as numeric
    volume = as.numeric(volume, na.rm = TRUE),
    # remove string from avg_vol_3_month
    avg_vol_3_month = str_remove_all(string = avg_vol_3_month, pattern = "M|k"),
    # average vol 3-month as numeric
    avg_vol_3_month = as.numeric(avg_vol_3_month, na.rm = TRUE),
    # format volume
    volume = case_when(
      # convert k to mil
      volume_key == "volume ($K)" ~ round(volume * 0.001, digits = 2),
      # round mil
      volume_key == "volume ($M)" ~ round(volume, digits = 2)
    ),
    # convert k to mil
    avg_vol_3_month = case_when(
      avg_vol_3mo_key == "volume ($K)" ~ round(avg_vol_3_month * 0.001, digits = 2),
      # round mil
      avg_vol_3mo_key == "volume ($M)" ~ round(avg_vol_3_month, digits = 2)
    )
  )
4.1.3 BioTechStocksClean
Now we’ll remove the key columns for volume and average 3-month volume and store the clean variables in BioTechStocksClean.
BioTechStocksRaw %>%
  mutate(
    # change numeric
    change = str_remove_all(string = change, pattern = "^\\+"),
    change = as.numeric(change, na.rm = TRUE),
    # percent change
    percent_change = str_remove_all(string = percent_change, pattern = "^\\+"),
    percent_change = str_remove_all(string = percent_change, pattern = "\\%"),
    percent_change = as.numeric(percent_change, na.rm = TRUE),
    # market cap
    market_cap = str_remove_all(string = market_cap, pattern = "B"),
    market_cap = as.numeric(market_cap, na.rm = TRUE),
    # volume key
    volume_key =
      case_when(
        str_detect(string = volume, pattern = "k") ~ "volume ($K)",
        str_detect(string = volume, pattern = "M") ~ "volume ($M)"
      ),
    # identify k vs M in avg_vol_3_month
    avg_vol_3mo_key =
      case_when(
        str_detect(string = avg_vol_3_month, pattern = "k") ~ "volume ($K)",
        str_detect(string = avg_vol_3_month, pattern = "M") ~ "volume ($M)"
      ),
    # remove string from volume
    volume = str_remove_all(string = volume, pattern = "M|k"),
    # volume as numeric
    volume = as.numeric(volume, na.rm = TRUE),
    # remove string from avg_vol_3_month
    avg_vol_3_month = str_remove_all(string = avg_vol_3_month, pattern = "M|k"),
    # average vol 3-month as numeric
    avg_vol_3_month = as.numeric(avg_vol_3_month, na.rm = TRUE),
    # format volume
    volume = case_when(
      # convert k to mil
      volume_key == "volume ($K)" ~ round(volume * 0.001, digits = 2),
      # round mil
      volume_key == "volume ($M)" ~ round(volume, digits = 2)
    ),
    # convert k to mil
    avg_vol_3_month = case_when(
      avg_vol_3mo_key == "volume ($K)" ~ round(avg_vol_3_month * 0.001, digits = 2),
      # round mil
      avg_vol_3mo_key == "volume ($M)" ~ round(avg_vol_3_month, digits = 2)
    )
  ) %>%
  # reduce dataset to original columns
  dplyr::select(
    symbol,
    company_name,
    last_price,
    change,
    percent_change,
    market_time,
    volume,
    avg_vol_3_month,
    market_cap
  ) -> BioTechStocksClean
BioTechStocksClean
If we compare this to BioTechStocksRaw we can see we’ve kept all the numerical information, but removed the character symbols. See the examples we’ve filtered for below:
BioTechStocksRaw %>%
  dplyr::filter(symbol %in% c("SGEN", "BAYRY", "GLAXF", "BGNE"))
BioTechStocksClean %>%
dplyr::filter(symbol %in% c("SGEN", "BAYRY", "GLAXF", "BGNE"))5 reactable package
The reactable package provides a comprehensive library of data display features.
We’re going to work through a few examples of how to use this package for displaying a subset of the BioTechStocksClean data (created below):
BioTechStocksClean %>%
  dplyr::filter(percent_change < -0.90 | percent_change > 0.30) %>%
  dplyr::arrange(desc(percent_change)) %>%
  dplyr::select(symbol:percent_change) -> TopBottomBioTechChange
TopBottomBioTechChange
5.1 The basics
The simplest use of reactive is by passing a tibble or data.frame directly to it.
reactable(TopBottomBioTechChange)5.1.1 Listing columns
The columns argument in reactable addresses any formatting we want to make the columns in our table. It takes the colDef() function, which has many options for customizing and styling the table columns.
For example, we can pass a list() of columns with colDef() to change the names of the columns.
reactable(
  data = TopBottomBioTechChange,
  columns = list(
    symbol = colDef(name = "Symbol"),
    company_name = colDef(name = "Company Name"),
    last_price = colDef(name = "Last Price"),
    change = colDef(name = "Change"),
    percent_change = colDef(name = "Percent Change")
  )
)
5.1.2 The defaultColDef
There is also a defaultColDef argument we can use to set all the columns in the tibble or data.frame.
We use defaultColDef to write some custom functions for how we want the columns to be formatted. Take the header argument example below:
colDef(header = )
# Custom header renderer. An R function that takes the header value and column
# name as arguments, or a JS() function that takes a column info object as an
# argument.
5.2 Custom functions
The function we define takes a value, removes the underscores and converts the column name to title case.
5.2.1 Test functions
These should be able to stand alone as functions.
header <- function(value) {
  hdr <- str_replace_all(value, "_", " ")
  str_to_title(hdr)
}
header(value = names(TopBottomBioTechChange))
## [1] "Symbol" "Company Name" "Last Price" "Change"
## [5] "Percent Change"5.2.2 colDef() + header
But when we pass to colDef(), they get applied to the tibble or data.frame.
reactable(
  data = TopBottomBioTechChange,
  defaultColDef = colDef(
    header = function(value) {
      hdr <- str_replace_all(value, "_", " ")
      str_to_title(hdr)
    }
  )
)
5.3 Argument values as list()s
We can also pass a list of values to colDef() arguments.
5.3.1 headerStyle
See the headerStyle example below:
reactable(
  data = TopBottomBioTechChange,
  defaultColDef = colDef(
    # header formatting
    header = function(value) {
      hdr <- str_replace_all(value, "_", " ")
      str_to_title(hdr)
    },
    # headerStyle
    headerStyle = list(
      fontWeight = 500,
      fontSize = "13px",
      letterSpacing = "1px"
    ),
    format = colFormat(digits = 2)
  )
)
5.3.2 Override defaultColDef
We can also override the default column settings in defaultColDef by supplying an additional colDef() function.
reactable(
  data = TopBottomBioTechChange,
  defaultColDef = colDef(
    header = function(value) {
      hdr <- str_replace_all(value, "_", " ")
      str_to_title(hdr)
    },
    headerStyle = list(
      fontWeight = 500,
      fontSize = "13px",
      letterSpacing = "1px"
    ),
    format = colFormat(digits = 2)
  ),
  columns = list(
    company_name = colDef(minWidth = 240)
  )
)
5.4 Add symbols
Let’s add the symbols to change and percent_change we removed from the previous table (+ and -).
5.4.1 Custom cell function
To do this, we’ll write a custom function for adding the cell formatting.
cell <- function(value) {
  # here we use paste0() to combine the value with +
  # for all values greater than 0
  if (value > 0.00) paste0("+", value) else value
}
cell(TopBottomBioTechChange$percent_change[1])
## [1] "+0.71"cell(TopBottomBioTechChange$change[6])## [1] -2.315.4.2 colDef() + cell
This is working, so we’ll add this to the colDef() function for change and percent_change.
reactable(
  data = TopBottomBioTechChange,
  defaultColDef = colDef(
    header = function(value) {
      hdr <- str_replace_all(value, "_", " ")
      str_to_title(hdr)
    },
    headerStyle = list(
      fontWeight = 500,
      fontSize = "13px",
      letterSpacing = "1px"
    ),
    format = colFormat(digits = 2)
  ),
  columns = list(
    company_name = colDef(minWidth = 240),
    change = colDef(
      cell = function(value) {
        if (value >= 0) {
          paste0("+", value)
        } else {
          value
        }
      },
    ),
    percent_change = colDef(
      cell = function(value) {
        if (value >= 0) {
          paste0("+", value)
        } else {
          value
        }
      }
    )
  )
)
5.5 Add color with style
Our table is starting to look like the original.
We want to make the positive change and percent_change values green, and the negative values red.
5.5.1 Custom style function
First we define a function with the color values.
style <- function(value) {
  color <- if (value > 0) {
    # green if above
    "#008B00"
    # red if below
  } else if (value < 0) {
    "#FF3030"
  } # adjust the font weight and color
  list(fontWeight = 600, color = color)
}
style(TopBottomBioTechChange$change[1])
## $fontWeight
## [1] 600
##
## $color
## [1] "#008B00"style(TopBottomBioTechChange$percent_change[6])## $fontWeight
## [1] 600
##
## $color
## [1] "#FF3030"5.5.2 colDef() + style
This is returning the two values we want to supply (fontWeight and color), so we can add it inside the colDef() function for each column.
reactable(
  data = TopBottomBioTechChange,
  defaultColDef = colDef(
    header = function(value) {
      hdr <- str_replace_all(value, "_", " ")
      str_to_title(hdr)
    },
    headerStyle = list(
      fontWeight = 500,
      fontSize = "13px",
      letterSpacing = "1px"
    ),
    format = colFormat(digits = 2)
  ),
  columns = list(
    company_name = colDef(minWidth = 240),
    change = colDef(
      cell = function(value) {
        if (value >= 0) {
          paste0("+", value)
        } else {
          value
        }
      },
      style = function(value) {
        color <- if (value > 0) {
          "#008B00"
        } else if (value < 0) {
          "#FF3030"
        }
        list(fontWeight = 600, color = color)
      }
    ),
    percent_change = colDef(
      cell = function(value) {
        if (value >= 0) {
          paste0("+", value)
        } else {
          value
        }
      },
      style = function(value) {
        color <- if (value > 0) {
          "#008B00"
        } else if (value < 0) {
          "#FF3030"
        }
        list(fontWeight = 600, color = color)
      }
    )
  )
)
5.5.3 style fonts and color
We need to change the color and weight of the stock symbols and last price, and we can set the font weight and color inside colDef() with the style argument.
reactable(
  data = TopBottomBioTechChange,
  defaultColDef = colDef(
    header = function(value) {
      hdr <- str_replace_all(value, "_", " ")
      str_to_title(hdr)
    },
    headerStyle = list(
      fontWeight = 500,
      fontSize = "13px",
      letterSpacing = "1px"
    ),
    format = colFormat(digits = 2)
  ),
  columns = list(
    company_name = colDef(minWidth = 240),
    change = colDef(
      format = colFormat(digits = 2),
      cell = function(value) {
        if (value >= 0) {
          paste0("+", value)
        } else {
          value
        }
      },
      style = function(value) {
        color <- if (value > 0) {
          "#008B00"
        } else if (value < 0) {
          "#FF3030"
        }
        list(fontWeight = 600, color = color)
      }
    ),
    percent_change = colDef(
      format = colFormat(digits = 2),
      cell = function(value) {
        if (value >= 0) {
          paste0("+", value)
        } else {
          value
        }
      },
      style = function(value) {
        color <- if (value > 0) {
          "#008B00"
        } else if (value < 0) {
          "#FF3030"
        }
        list(fontWeight = 600, color = color)
      }
    ),
    symbol = colDef(
      style = list(color = "#8470FF", fontWeight = "bold")
    ),
    last_price = colDef(
      format = colFormat(digits = 2),
      style = list(color = "black", fontWeight = "bold")
    )
  )
)
Now that the table looks similar, we need to add some highlighting (and some other features that aren’t in the original table).
5.6 Add highlighting and formatting
The original table highlights each row when we roll over it with our cursor, and we can add this with the highlight = TRUE argument.
5.6.1 highlight
The highlight argument precedes the column definition functions.
reactable(
  data = TopBottomBioTechChange,
  highlight = TRUE,
  defaultColDef = colDef(
    header = function(value) {
      hdr <- str_replace_all(value, "_", " ")
      str_to_title(hdr)
    },
    headerStyle = list(
      fontWeight = 500,
      fontSize = "13px",
      letterSpacing = "1px"
    ),
    format = colFormat(digits = 2)
  ),
  columns = list(
    company_name = colDef(minWidth = 240),
    change = colDef(
      format = colFormat(digits = 2),
      cell = function(value) {
        if (value >= 0) {
          paste0("+", value)
        } else {
          value
        }
      },
      style = function(value) {
        color <- if (value > 0) {
          "#008B00"
        } else if (value < 0) {
          "#FF3030"
        }
        list(fontWeight = 600, color = color)
      }
    ),
    percent_change = colDef(
      format = colFormat(digits = 2),
      cell = function(value) {
        if (value >= 0) {
          paste0("+", value)
        } else {
          value
        }
      },
      style = function(value) {
        color <- if (value > 0) {
          "#008B00"
        } else if (value < 0) {
          "#FF3030"
        }
        list(fontWeight = 600, color = color)
      }
    ),
    symbol = colDef(
      style = list(color = "#8470FF", fontWeight = "bold")
    ),
    last_price = colDef(
      format = colFormat(digits = 2),
      style = list(color = "black", fontWeight = "bold")
    )
  )
)
5.6.2 striped
The original table also has striping (every other row is a different color), and we can add the striped argument just like the highlight argument.
reactable(
  data = TopBottomBioTechChange,
  highlight = TRUE,
  striped = TRUE,
  defaultColDef = colDef(
    header = function(value) {
      hdr <- str_replace_all(value, "_", " ")
      str_to_title(hdr)
    },
    headerStyle = list(
      fontWeight = 500,
      fontSize = "13px",
      letterSpacing = "1px"
    ),
    format = colFormat(digits = 2)
  ),
  columns = list(
    company_name = colDef(minWidth = 240),
    change = colDef(
      format = colFormat(digits = 2),
      cell = function(value) {
        if (value >= 0) {
          paste0("+", value)
        } else {
          value
        }
      },
      style = function(value) {
        color <- if (value > 0) {
          "#008B00"
        } else if (value < 0) {
          "#FF3030"
        }
        list(fontWeight = 600,
             color = color)
      }
    ),
    percent_change = colDef(
      format = colFormat(digits = 2),
      cell = function(value) {
        if (value >= 0) {
          paste0("+", value)
        } else {
          value
        }
      },
      style = function(value) {
        color <- if (value > 0) {
          "#008B00"
        } else if (value < 0) {
          "#FF3030"
        }
        list(fontWeight = 600, color = color)
      }
    ),
    symbol = colDef(
      style = list(color = "#8470FF", fontWeight = "bold")
    ),
    last_price = colDef(
      format = colFormat(digits = 2),
      style = list(color = "black", fontWeight = "bold")
    )
  )
)
Now we have a striped, highlighted table!
5.7 Add filtering
We also want to make navigating the table a little easier by adding filtering.
5.7.1 filtering
This is added with the filterable = TRUE argument.
reactable(
  data = TopBottomBioTechChange,
  highlight = TRUE,
  striped = TRUE,
  filterable = TRUE,
  defaultColDef = colDef(
    header = function(value) {
      hdr <- str_replace_all(value, "_", " ")
      str_to_title(hdr)
    },
    headerStyle = list(
      fontWeight = 500,
      fontSize = "13px",
      letterSpacing = "1px"
    ),
    format = colFormat(digits = 2)
  ),
  columns = list(
    company_name = colDef(minWidth = 240),
    change = colDef(
      cell = function(value) {
        if (value >= 0) {
          paste0("+", value)
        } else {
          value
        }
      },
      style = function(value) {
        color <- if (value > 0) {
          "#008B00"
        } else if (value < 0) {
          "#FF3030"
        }
        list(fontWeight = 600, color = color)
      }
    ),
    percent_change = colDef(
      cell = function(value) {
        if (value >= 0) {
          paste0("+", value)
        } else {
          value
        }
      },
      style = function(value) {
        color <- if (value > 0) {
          "#008B00"
        } else if (value < 0) {
          "#FF3030"
        }
        list(fontWeight = 600, color = color)
      }
    ),
    symbol = colDef(
      style = list(color = "#8470FF", fontWeight = "bold")
    ),
    last_price = colDef(
      style = list(color = "black", fontWeight = "bold")
    )
  )
)
5.7.2 selective filtering
We might not want all of the columns filterable, so we can define the feature by column in colDef() too.
reactable(
  data = TopBottomBioTechChange,
  highlight = TRUE,
  striped = TRUE,
  defaultColDef = colDef(
    header = function(value) {
      hdr <- str_replace_all(value, "_", " ")
      str_to_title(hdr)
    },
    headerStyle = list(
      fontWeight = 500,
      fontSize = "13px",
      letterSpacing = "1px"
    ),
    format = colFormat(digits = 2)
  ),
  columns = list(
    company_name = colDef(minWidth = 240,
                          filterable = TRUE),
    change = colDef(
      cell = function(value) {
        if (value >= 0) {
          paste0("+", value)
        } else {
          value
        }
      },
      style = function(value) {
        color <- if (value > 0) {
          "#008B00"
        } else if (value < 0) {
          "#FF3030"
        }
        list(fontWeight = 600, color = color)
      }
    ),
    percent_change = colDef(
      cell = function(value) {
        if (value >= 0) {
          paste0("+", value)
        } else {
          value
        }
      },
      style = function(value) {
        color <- if (value > 0) {
          "#008B00"
        } else if (value < 0) {
          "#FF3030"
        }
        list(fontWeight = 600, color = color)
      }
    ),
    symbol = colDef(
      style = list(color = "#8470FF", fontWeight = "bold"),
      filterable = TRUE
    ),
    last_price = colDef(
      style = list(color = "black", fontWeight = "bold")
    )
  )
)
Now this table is more interactive and easier to narrow down.
5.8 Add searching
The last feature we’ll add to this table is searching. This makes the entire table searchable.
5.8.1 searchable
We can make the entire table searchable by adding searchable = TRUE before the column definition functions.
reactable(
  data = TopBottomBioTechChange,
  highlight = TRUE,
  striped = TRUE,
  searchable = TRUE,
  defaultColDef = colDef(
    header = function(value) {
      hdr <- str_replace_all(value, "_", " ")
      str_to_title(hdr)
    },
    headerStyle = list(
      fontWeight = 500,
      fontSize = "13px",
      letterSpacing = "1px"
    ),
    format = colFormat(digits = 2)
  ),
  columns = list(
    company_name = colDef(minWidth = 240,
                          filterable = TRUE),
    change = colDef(
      cell = function(value) {
        if (value >= 0) {
          paste0("+", value)
        } else {
          value
        }
      },
      style = function(value) {
        color <- if (value > 0) {
          "#008B00"
        } else if (value < 0) {
          "#FF3030"
        }
        list(fontWeight = 600, color = color)
      }
    ),
    percent_change = colDef(
      cell = function(value) {
        if (value >= 0) {
          paste0("+", value)
        } else {
          value
        }
      },
      style = function(value) {
        color <- if (value > 0) {
          "#008B00"
        } else if (value < 0) {
          "#FF3030"
        }
        list(fontWeight = 600, color = color)
      }
    ),
    symbol = colDef(
      style = list(color = "#8470FF", fontWeight = "bold"),
      filterable = TRUE
    ),
    last_price = colDef(
      style = list(color = "black", fontWeight = "bold")
    )
  )
)
5.8.2 minRows
The searchable argument works well when combined with the minRows argument (especially for large tables).
reactable(
  data = TopBottomBioTechChange,
  highlight = TRUE,
  striped = TRUE,
  searchable = TRUE,
  minRows = 5,
  defaultColDef = colDef(
    header = function(value) {
      hdr <- str_replace_all(value, "_", " ")
      str_to_title(hdr)
    },
    headerStyle = list(
      fontWeight = 500,
      fontSize = "13px",
      letterSpacing = "1px"
    ),
    format = colFormat(digits = 2)
  ),
  columns = list(
    company_name = colDef(minWidth = 240,
                          filterable = TRUE),
    change = colDef(
      cell = function(value) {
        if (value >= 0) {
          paste0("+", value)
        } else {
          value
        }
      },
      style = function(value) {
        color <- if (value > 0) {
          "#008B00"
        } else if (value < 0) {
          "#FF3030"
        }
        list(fontWeight = 600, color = color)
      }
    ),
    percent_change = colDef(
      cell = function(value) {
        if (value >= 0) {
          paste0("+", value)
        } else {
          value
        }
      },
      style = function(value) {
        color <- if (value > 0) {
          "#008B00"
        } else if (value < 0) {
          "#FF3030"
        }
        list(fontWeight = 600, color = color)
      }
    ),
    symbol = colDef(
      style = list(color = "#8470FF", fontWeight = "bold"),
      filterable = TRUE
    ),
    last_price = colDef(
      style = list(color = "black", fontWeight = "bold")
    )
  )
)