install.packages('remotes')
remotes::install_github("mjfrigaard/ghreadme")GitHub README files allow users to introduce themselves, share interests, projects, status, etc.1 I love working in RMarkdown, so I wrote a small package that allows me to update my profile README with badges and ggplot2 graphs. I’ll walk through the workflow in this post.
Install the package from GitHub:
library(ghreadme)Create a new RMarkdown README.Rmd file with the use_profile_readme() function:
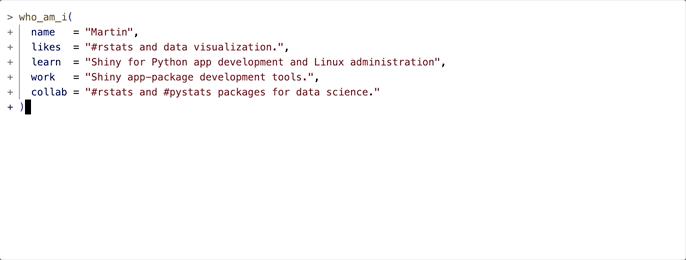
use_profile_readme(
  name     = "Martin",
  likes    = "#rstats and data visualization.",
  learn    = "Shiny app development, Python, and Linux",
  work     = "R package development tools.",
  collab   = "#rstats packages for data science.",
  username = "mjfrigaard"
)
Use overwrite = TRUE to replace the existing file.
✔ Wrote ./README.Rmd
ℹ Edit the placeholders, then knit to regenerate README.md.
Introduce yourself
The who_am_i() function can be used to create a .gif of your likes, what you’re currently learning/working on, and how you’d like to connect.
Collecting Git info
You can collect your Git info with the collect_git_commits() function. include can also provide commits, stars, issues, and PRs.
stats <- collect_git_commits(
  user    = "your-username",
  emails  = "you@example.com",
  include = c("commits", "stars", "issues", "prs")
)
A list with four tibbles is returned. Once you have your Git information, you can create graphs for your README.
names(stats)
## [1] "commits" "stars"   "issues"  "prs"
Commits
Probably the most interesting data is the commits dataset:
str(stats$commits)
## Classes 'tbl_df', 'tbl' and 'data.frame':    2528 obs. of  11 variables:
##  $ repo        : chr  "r-journalism-code-thru" "r-journalism-code-thru" "r-journalism-code-thru" "r-journalism-code-thru" ...
##  $ sha         : chr  "36babd1e3eac9b83e70112ae975a1e0ce68521d9" "33a7a08c3f39c620d79fa3d8eb455eaa5526e796" "aad50f0730ab5c2463c4bcc9eea7458691da4cce" "20964d120b88bb76e9e645f4857702183d3e7300" ...
##  $ timestamp   : POSIXct, format:  ...
##  $ author_name : chr  "Martin Frigaard" "Martin Frigaard" "Martin Frigaard" "Martin Frigaard" ...
##  $ author_email: chr  "mjfrigaard@gmail.com" "mjfrigaard@gmail.com" "mjfrigaard@gmail.com" "mjfrigaard@gmail.com" ...
##  $ message     : chr  "upload data and notebook" "New README .Rmd file" "New text on video" "Merge branch 'master' of https://github.com/mjfrigaard/r-journalism_code_thru" ...
##  $ local_ts    : POSIXct, format:  ...
##  $ date        : Date, format:  ...
##  $ hour        : int  0 8 10 10 10 10 16 16 14 14 ...
##  $ weekday     : Factor w/ 7 levels "Monday","Tuesday",..: 4 4 4 4 4 4 6 6 4 4 ...
##  $ year        : int  2018 2018 2018 2018 2018 2018 2018 2018 2018 2018 ...
I’ve included functions in ghreadme for quickly making graphs to visualize your commits.
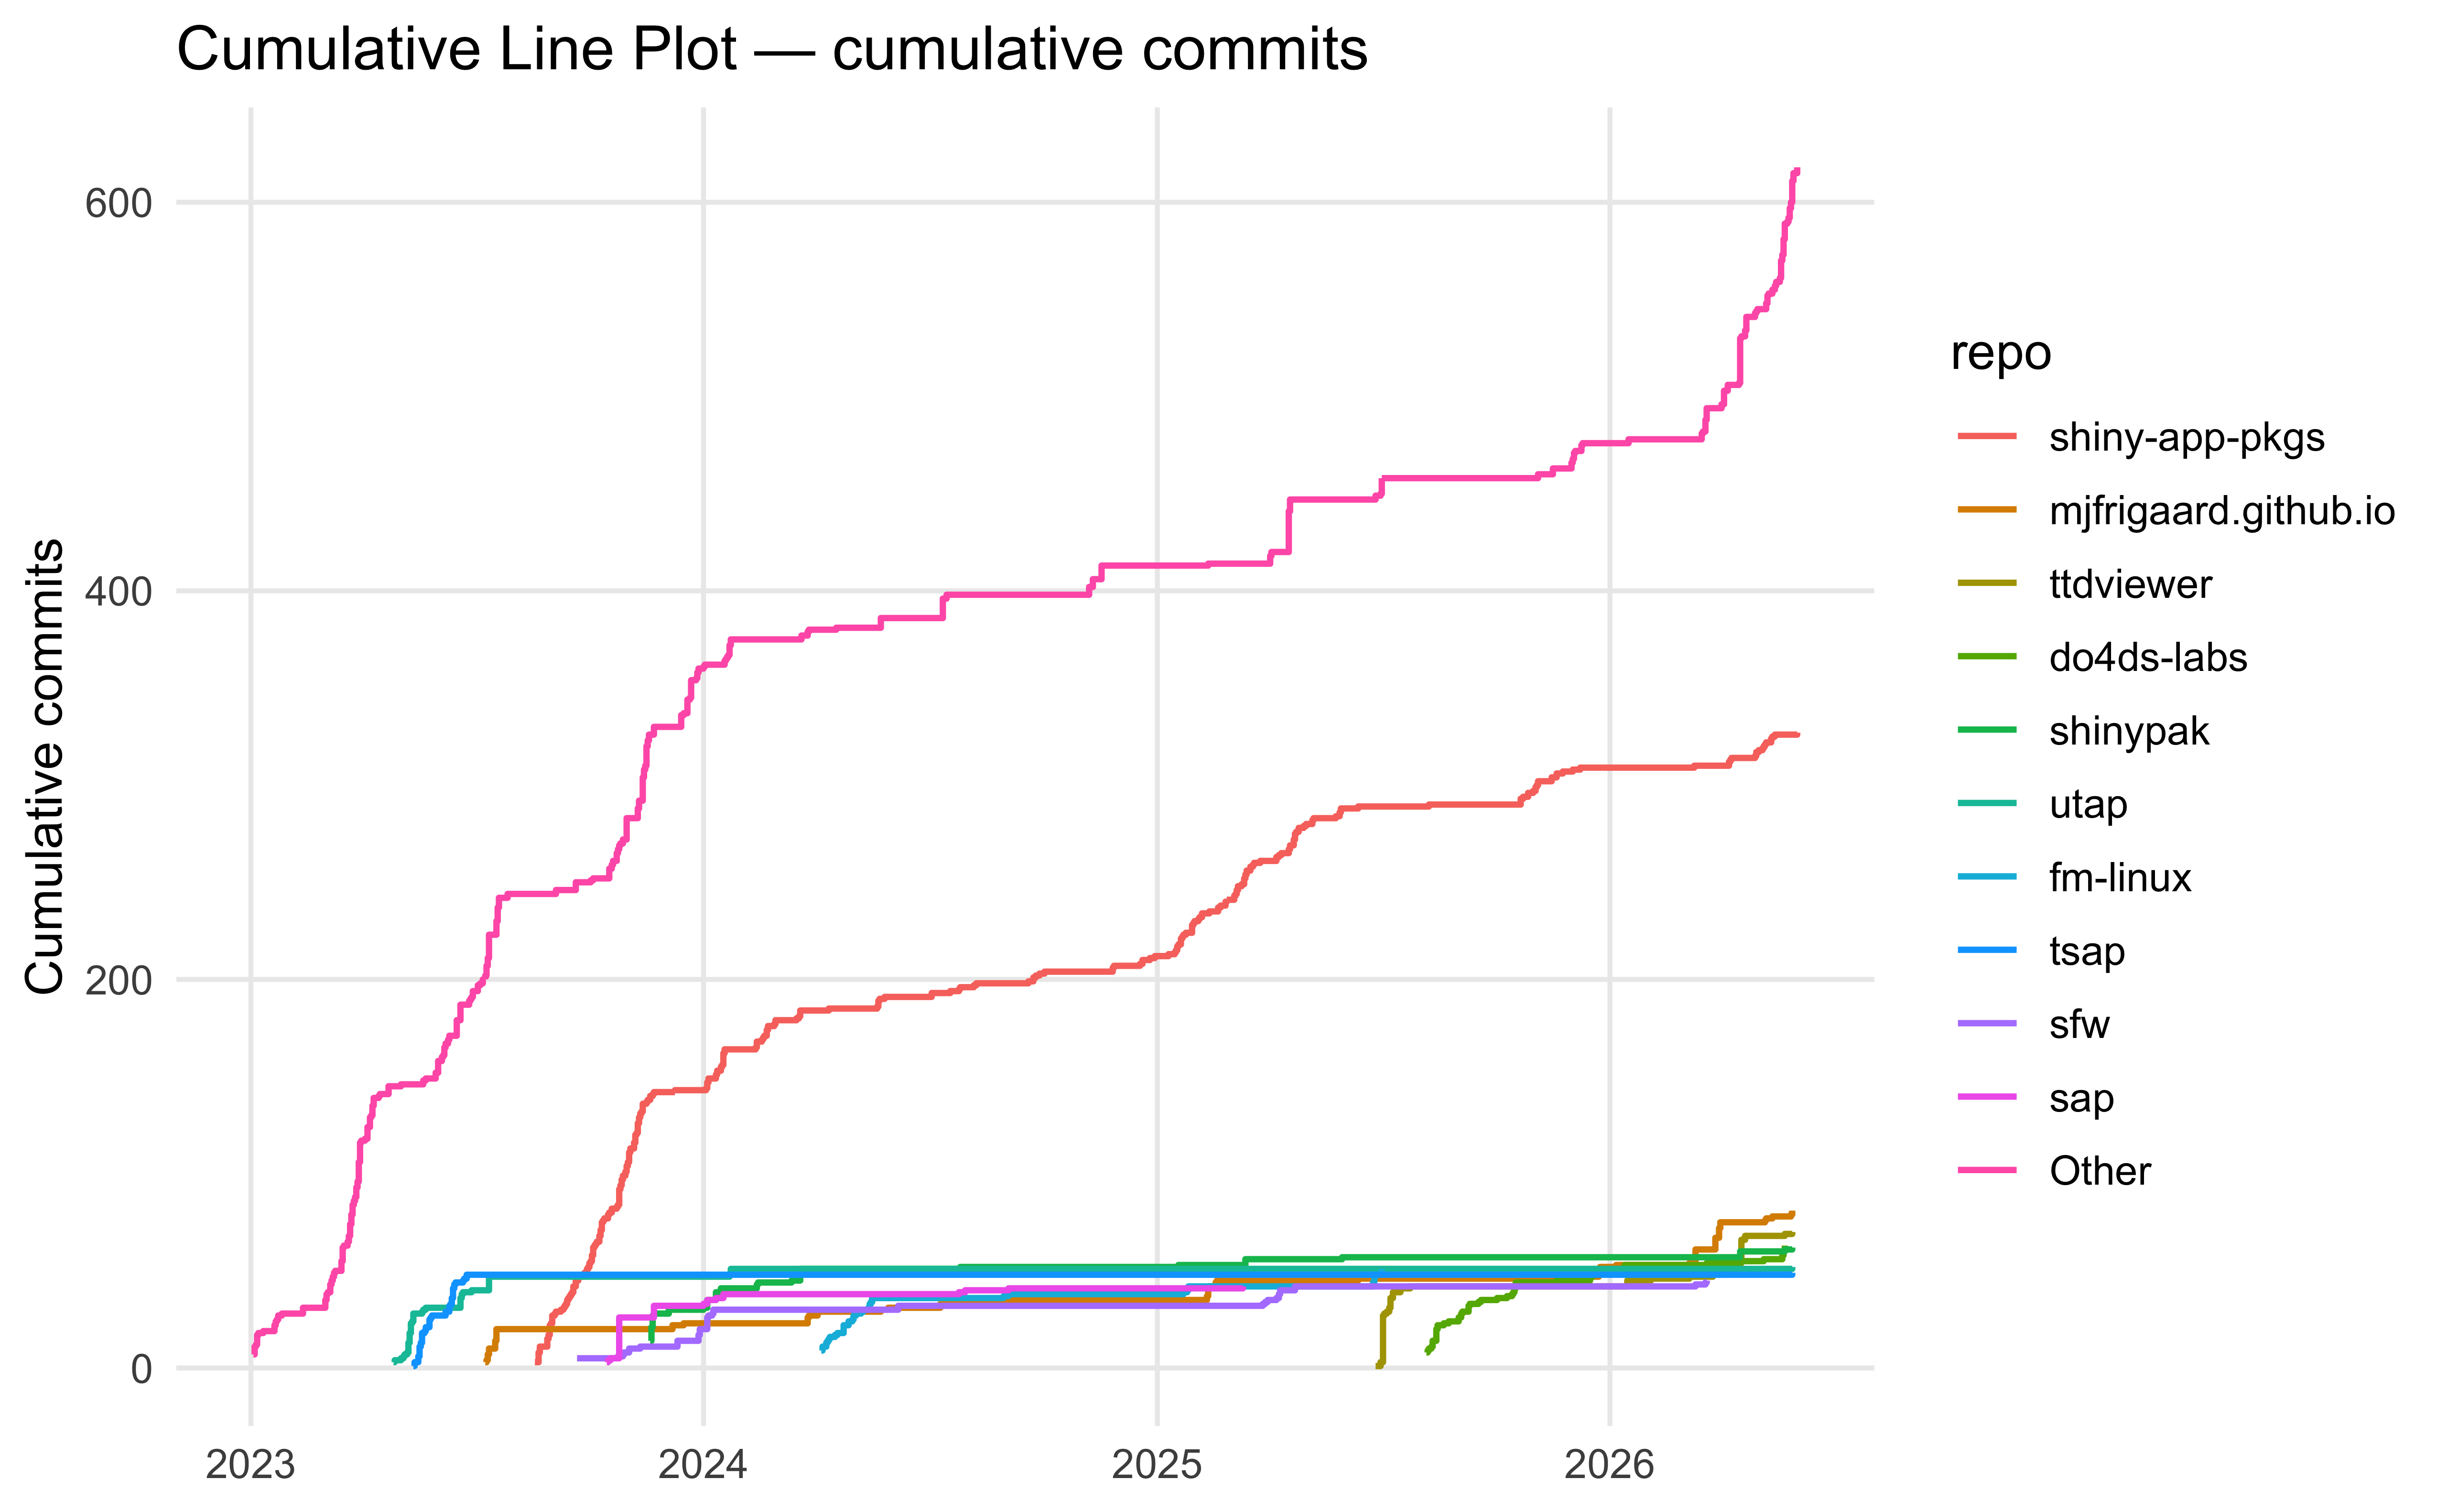
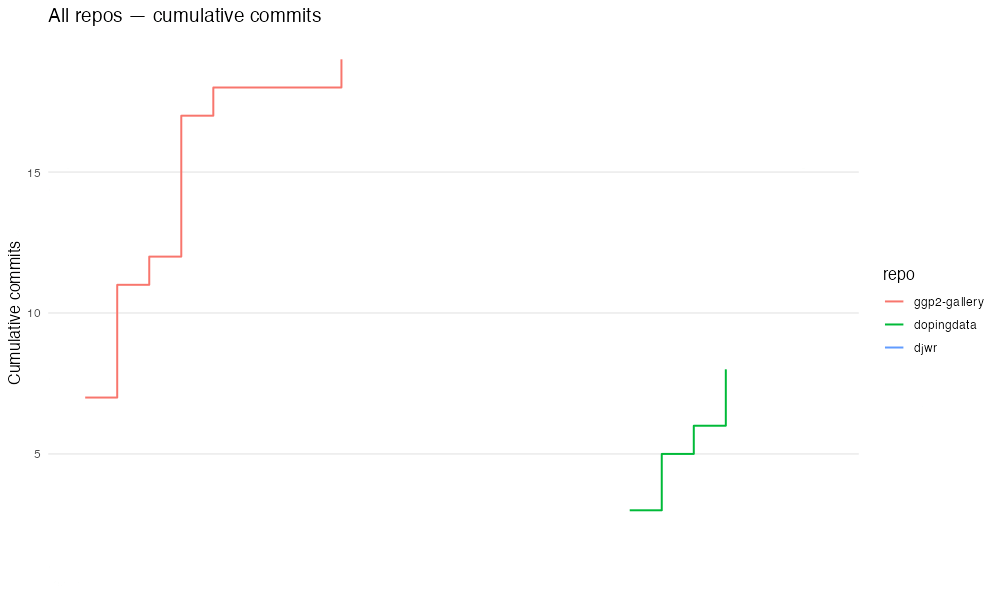
Cumulative Line Plot
cumulative_line_plot() creates a line graph of the cumulative commits over time per repo:
library(ggplot2)

cumulative_line_plot(
  stats$commits,
  repo = NULL,
  date_begin = "2023-01-01",
  date_end = "2026-06-01",
  top_n = 10,
  show_other = TRUE,
  title = "Cumulative Line Plot"
)
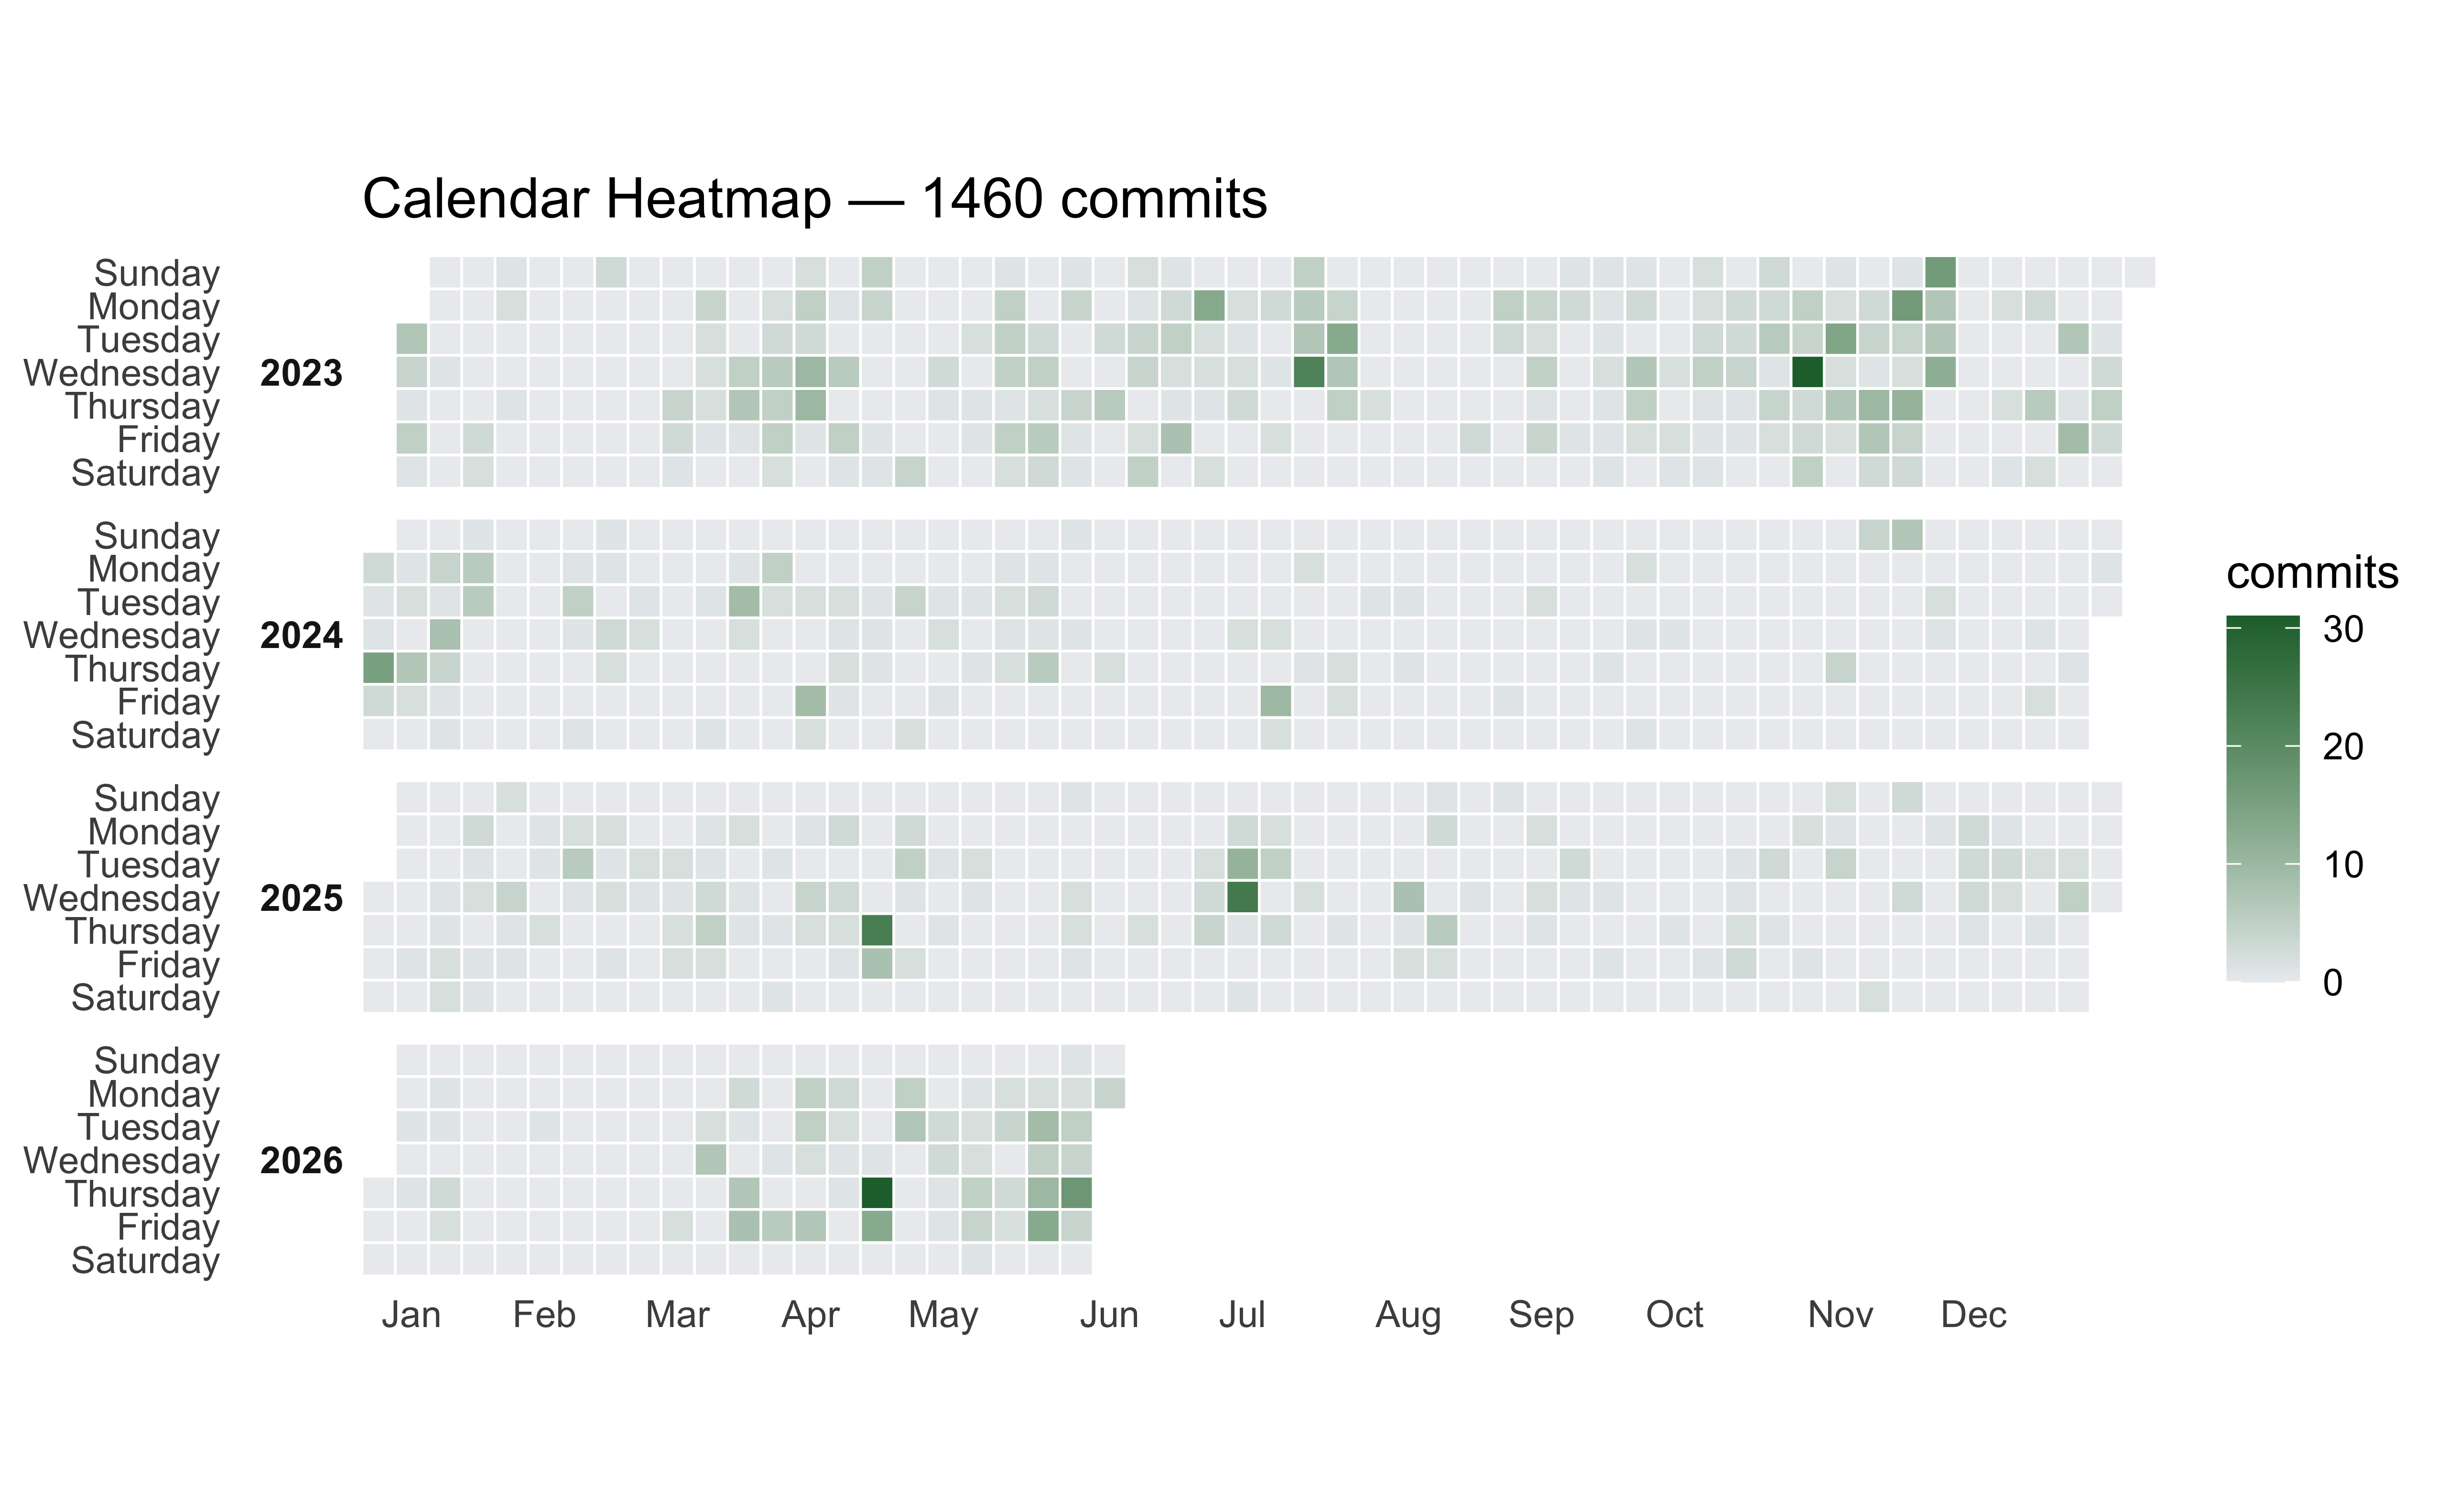
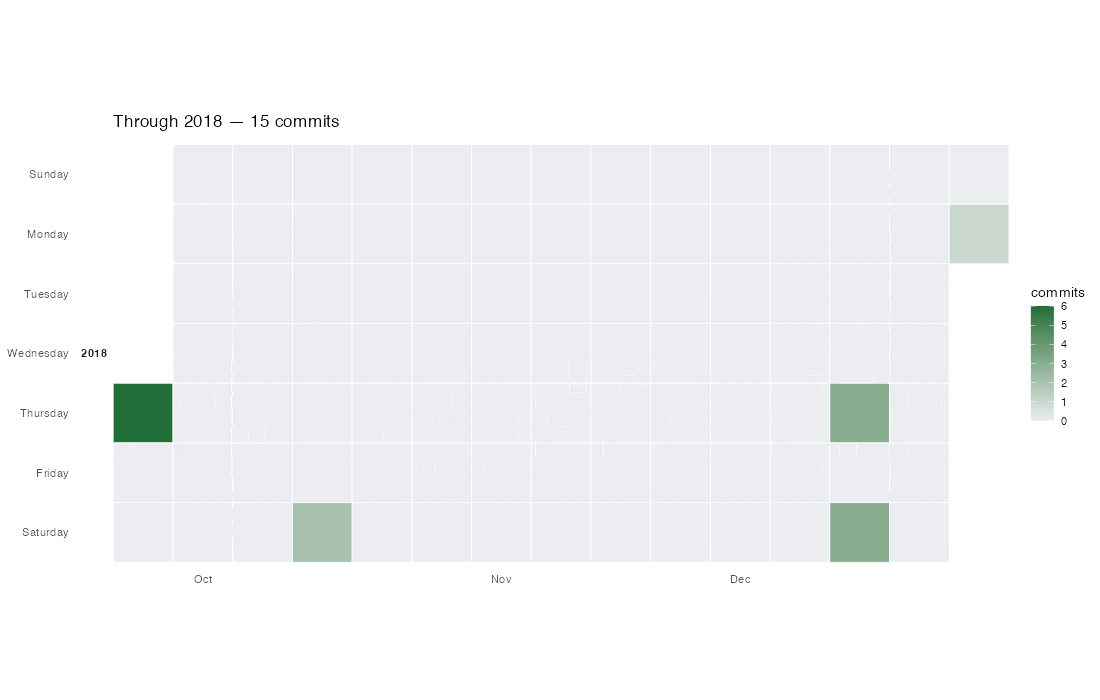
Calendar Heatmap Plot
calendar_heatmap_plot() creates a heatmap similar to the GitHub heatmap, and allows us to facet by year.
calendar_heatmap_plot(
  stats$commits,
  repo = NULL,
  date_begin = "2023-01-01",
  date_end = "2026-06-01",
  title = "Calendar Heatmap",
  week_start = c("Sunday", "Monday"),
  low = "#ebedf0",
  high = "#216e39"
)
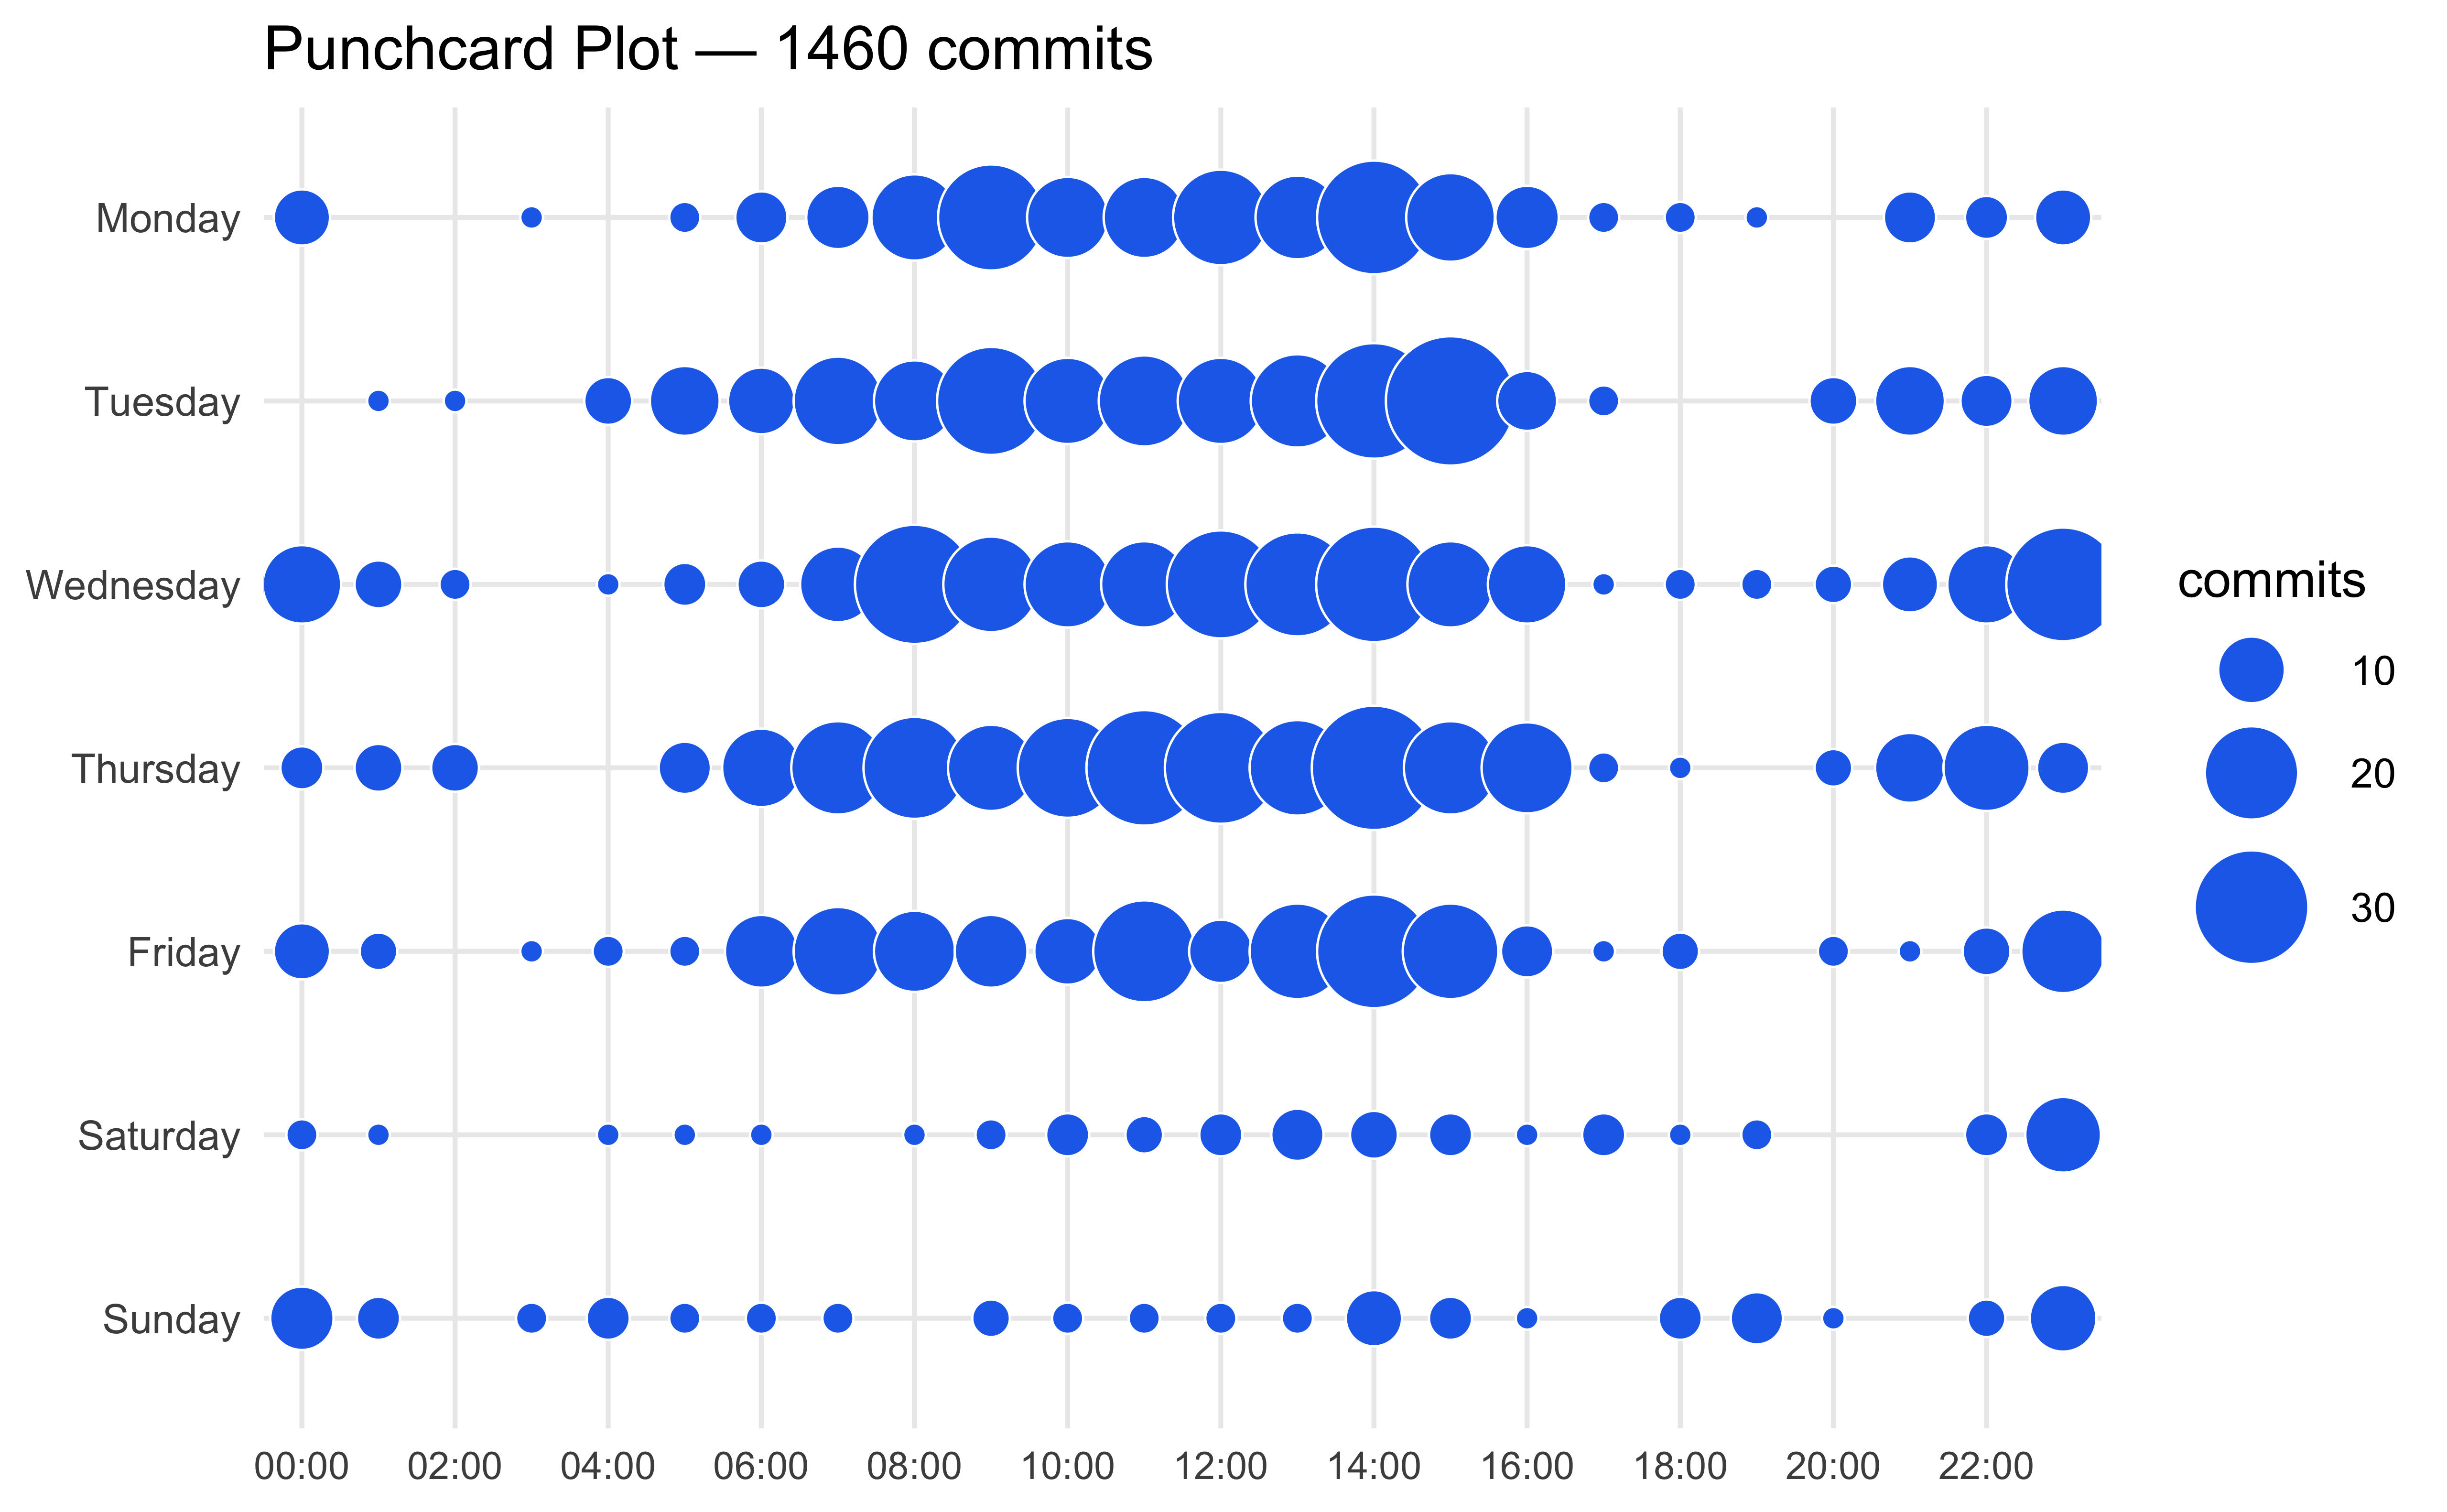
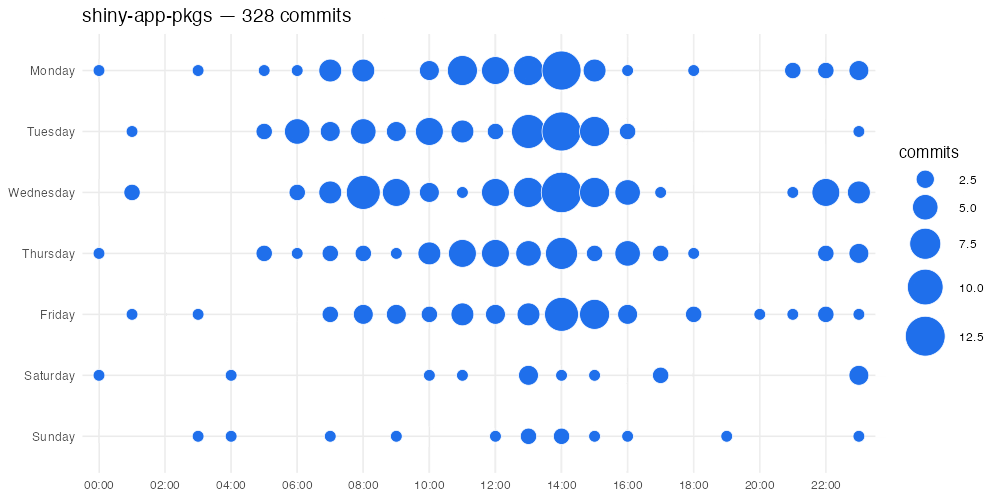
Punch Card Plot
punchcard_plot() lets you view the time of day your commits occur:
punchcard_plot(
  stats$commits,
  repo = NULL,
  date_begin = "2023-01-01",
  date_end = "2026-06-01",
  title = "Punchcard Plot",
  point_color = "#1f6feb"
)
Stars
The stars data has similar structure to the commits:
str(stats$stars)
## tibble [155 × 8] (S3: tbl_df/tbl/data.frame)
##  $ repo            : chr [1:155] "shiny-app-pkgs" "sap" "Rsixer" "shinypak" ...
##  $ stargazers_count: int [1:155] 20 6 3 3 2 2 2 2 2 2 ...
##  $ forks_count     : int [1:155] 0 0 0 0 0 0 0 0 0 0 ...
##  $ watchers_count  : int [1:155] 20 6 3 3 2 2 2 2 2 2 ...
##  $ language        : chr [1:155] "HTML" "R" "R" "R" ...
##  $ description     : chr [1:155] "Shiny app-packages (book)" "A collection of {S}hiny {A}pp-{P}ackages" "Shiny, R packages, R6" "R package (code examples for Shiny App-Packages book)" ...
##  $ created_at      : POSIXct[1:155], format:  ...
##  $ updated_at      : POSIXct[1:155], format:  ...
Top 10 repos by stars
Below is a “Top 10 repos by stars” bar graph using stargazers_count and repo:
stats$stars |>
  head(10) |>
  ggplot(aes(
    x = stargazers_count,
    y = reorder(repo, stargazers_count)
  )) +
  geom_col(fill = "#1E5F8C") +
  labs(
    x = "Stars",
    y = NULL,
    title = "Top 10 repos by stars"
  ) +
  theme_minimal()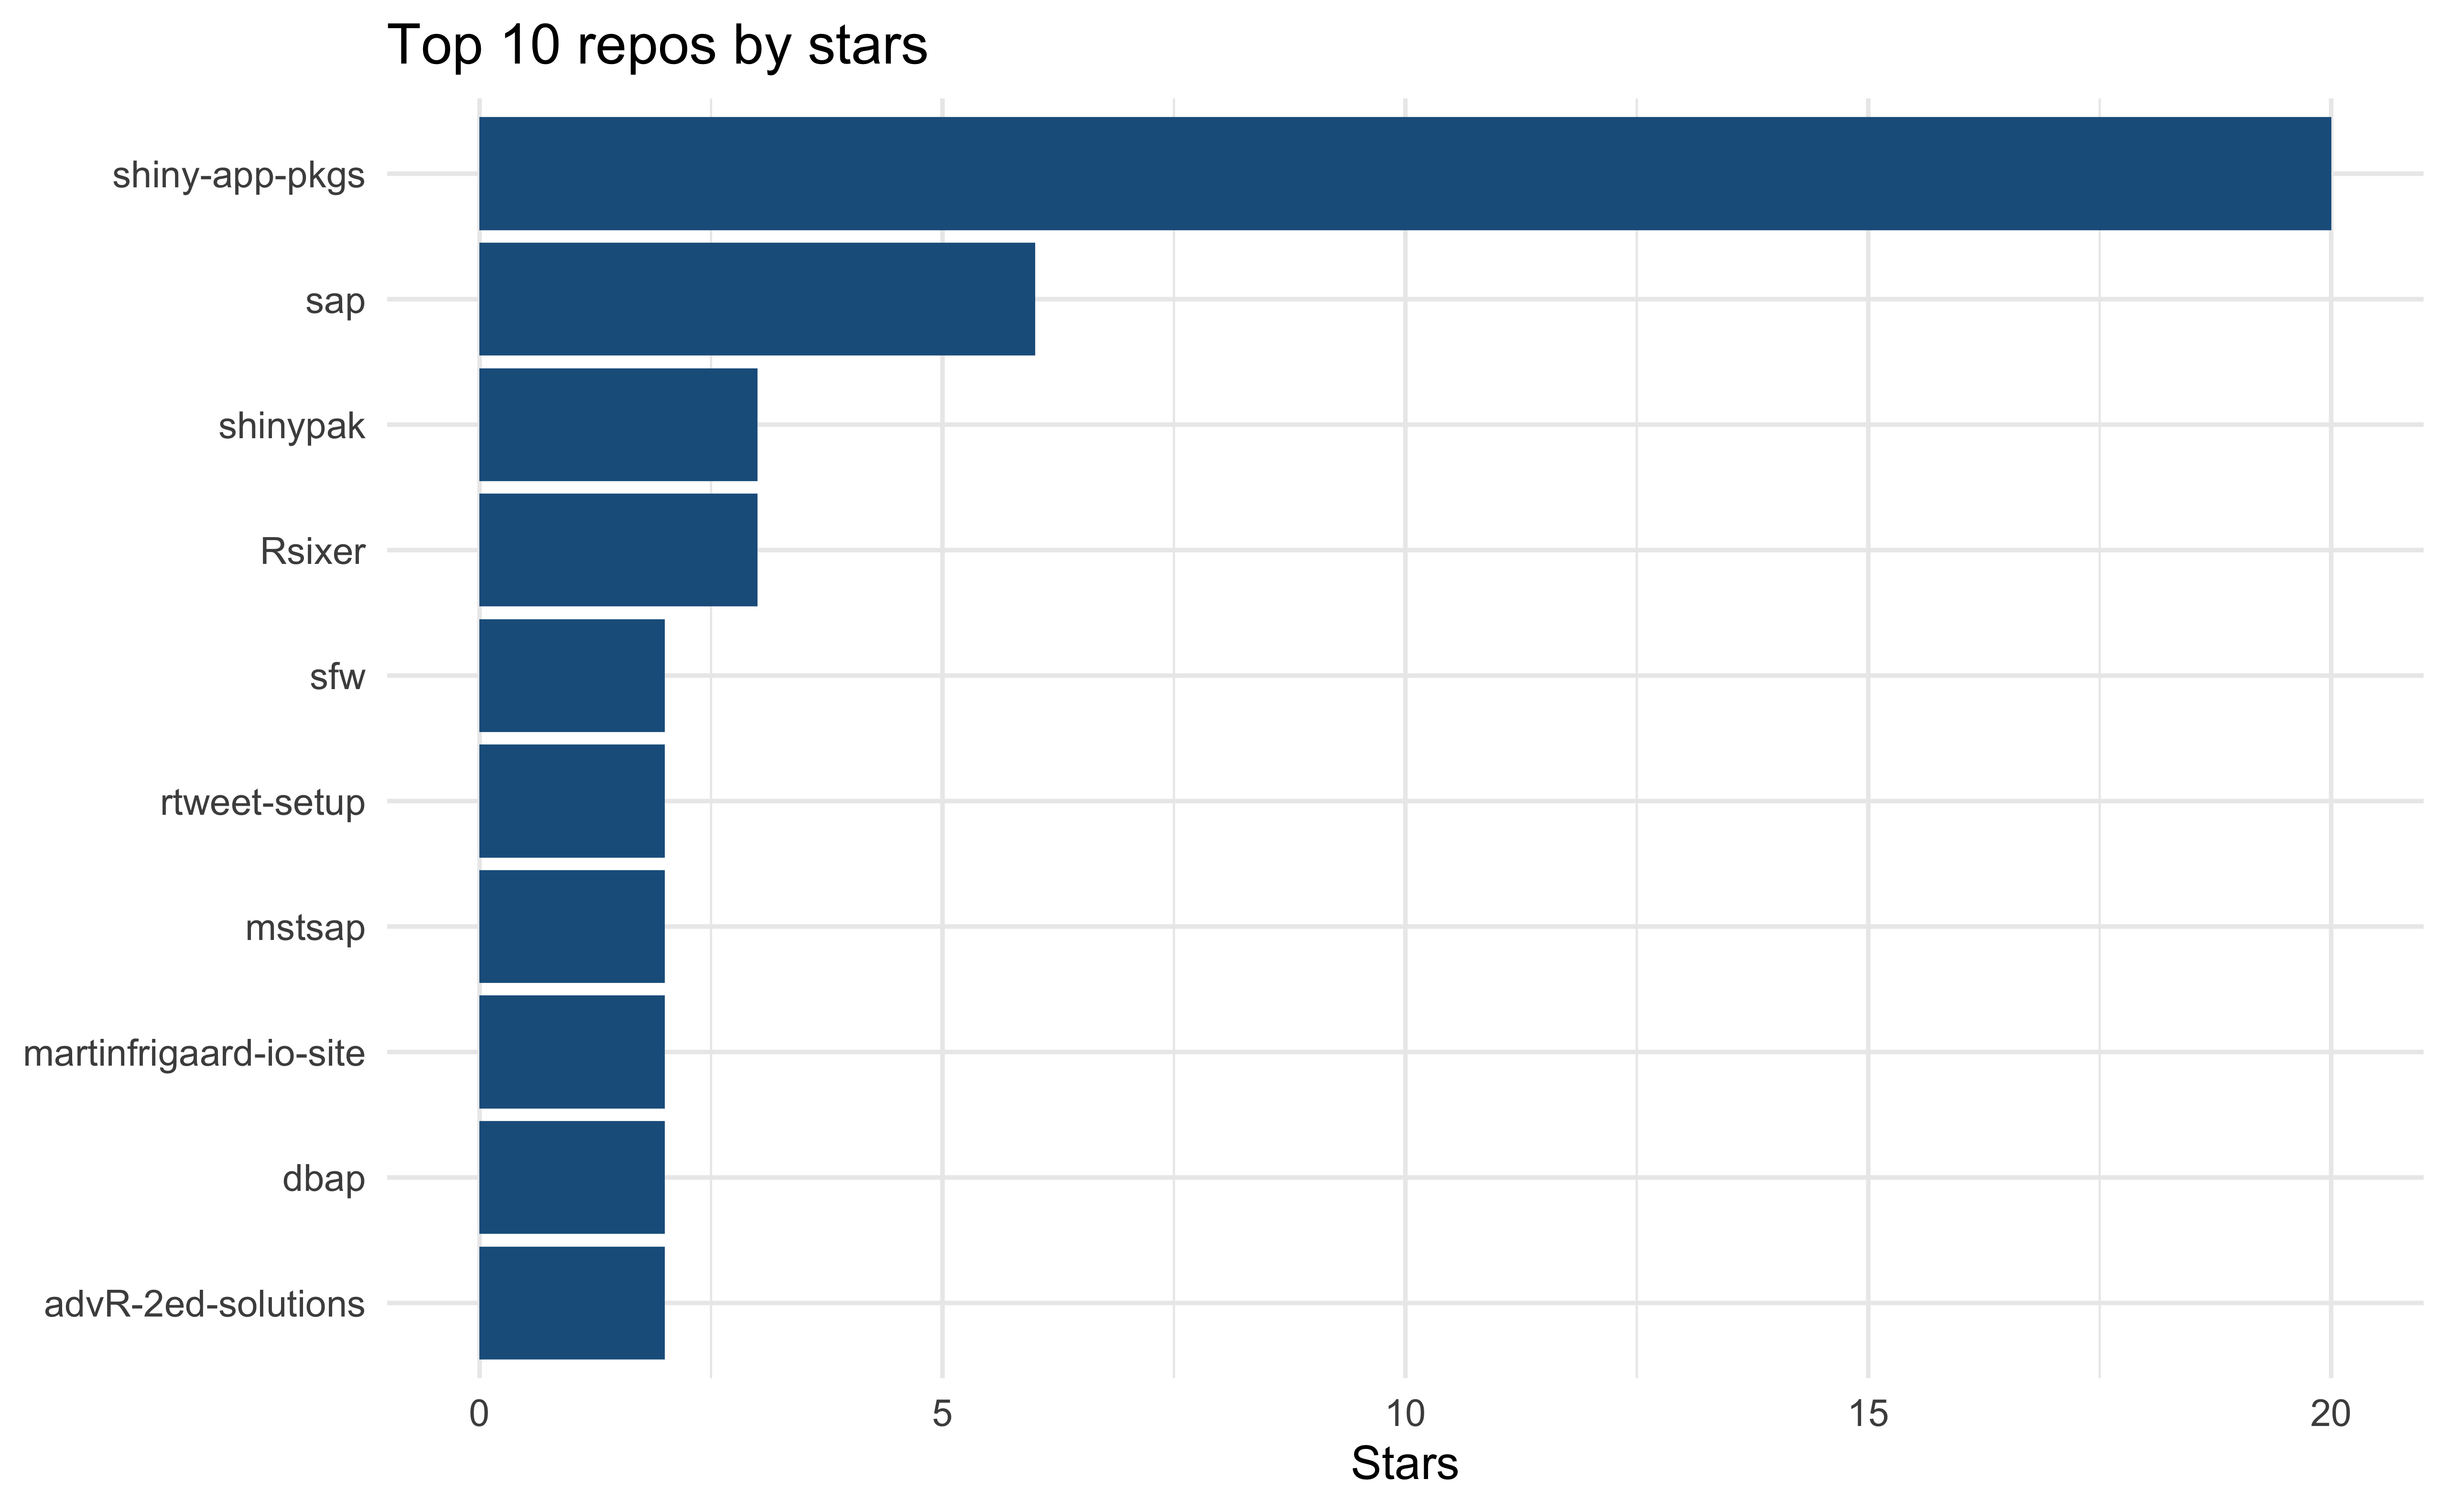
Issues
str(stats$issues)
## tibble [46 × 7] (S3: tbl_df/tbl/data.frame)
##  $ repo      : chr [1:46] "posit-dev/btw" "posit-dev/btw" "mjfrigaard/fm-linux" "mjfrigaard/fm-linux" ...
##  $ number    : int [1:46] 124 122 6 5 4 3 2 1 18 17 ...
##  $ title     : chr [1:46] "btw_app(): parse error: premature EOF" "btw_app(): Error in $: object of type 'closure' is not subsettable" "Basics: update to include users and groups and permissions" "Preface: update outline" ...
##  $ state     : chr [1:46] "closed" "closed" "open" "open" ...
##  $ created_at: POSIXct[1:46], format:  ...
##  $ closed_at : POSIXct[1:46], format:  ...
##  $ url       : chr [1:46] "https://github.com/posit-dev/btw/issues/124" "https://github.com/posit-dev/btw/issues/122" "https://github.com/mjfrigaard/fm-linux/issues/6" "https://github.com/mjfrigaard/fm-linux/issues/5" ...
Issues per year (by state)
Table outputs are also great for your README. Below is a “issues opened per year, by state” summary:
stats$issues |>
  dplyr::mutate(
    year = as.integer(format(created_at, "%Y"))
    ) |>
  dplyr::count(year, state) |>
  tidyr::pivot_wider(
    names_from = state,
    values_from = n,
    values_fill = 0) |>
  dplyr::arrange(dplyr::desc(year)) |>
  gt::gt() |>
  gt::tab_header(
    title = "Issues opened per year",
subtitle = "By state")| Issues opened per year | ||
| By state | ||
| year | closed | open |
|---|---|---|
| 2025 | 8 | 3 |
| 2024 | 5 | 1 |
| 2023 | 10 | 7 |
| 2021 | 3 | 0 |
| 2020 | 3 | 0 |
| 2019 | 0 | 3 |
| 2018 | 1 | 0 |
| 2017 | 0 | 1 |
| 2016 | 1 | 0 |
Creating .gifs
For changes over time, you can use the recipes in the visualization vignette to create animated .gifs. I’ve included examples below.
Check out the package documentation for more updates!
Footnotes
Read more about GitHub README prerequisites↩︎