%%{init: {'theme': 'neutral', 'look': 'neo', 'themeVariables': { 'fontFamily': 'monospace', "fontSize":"18px"}}}%%
graph TB
subgraph Storage["<strong>Model</strong>"]
subgraph Board["<strong>models</strong>"]
Model("<strong>penguin_model</strong>")
end
end
style Storage fill:#fff,stroke:#E65100,color:#FF9800,stroke-width:3px
style Board fill:#FF9800,color:#000,stroke:#FF9800,stroke-width:1px
style Model text-align:left,fill:#FF9800,color:#000,stroke:#FF9800,stroke-width:1px
subgraph API["<strong>Vetiver API</strong>"]
Vetiver("<strong><code>VetiverModel</code></strong>")
FastAPI("<strong><code>FastAPI</code> server</strong>")
Endpoints("<code>/predict</code><br/><code>/ping</code><br/><code>/metadata</code>")
end
style API fill:#fff,stroke:#2E7D32,color:#4CAF50
style Vetiver text-align:right,fill:#4CAF50,color:#000,stroke:#4CAF50,stroke-width:3px
style FastAPI text-align:right,fill:#4CAF50,color:#000,stroke:#4CAF50,stroke-width:3px
style Endpoints text-align:left,fill:#4CAF50,color:#000,stroke:#4CAF50,stroke-width:3px
subgraph App["<strong>Shiny App</strong>"]
UI("<strong>Shiny UI Inputs</strong>")
Server("<strong>App Server</strong>")
Logging("<strong>Logging<br>(file & console)</strong>")
end
style App fill:#fff,stroke:#1565C0,color:#2196F3
style UI fill:#2196F3,color:#000,stroke:#2196F3,stroke-width:3px
style Server fill:#2196F3,color:#000,stroke:#2196F3,stroke-width:3px
style Logging fill:#2196F3,color:#000,stroke:#2196F3,stroke-width:3px
subgraph User["<strong>End Users</strong>"]
Browser("<strong>Web Browser</strong>")
end
style User color:#000
style Browser fill:#fff,color:#000,stroke:#000,stroke-width:3px
Model -->|<code>pins</code> board with <code>sklearn</code> model| Vetiver
Vetiver -->|Model wrapper| FastAPI
FastAPI --> |Port 8080|Endpoints
Browser --> UI
UI --> Server
Server -->|HTTP POST| Endpoints
Endpoints -->|JSON Response| Server
Server --> Logging
Logging --> UI
This is the second post demonstrating how to use Shiny apps with a database and an API (see previous post here). Both of these solutions are inspired by the exercises in the Databases and APIs chapter of DevOps for Data Science.
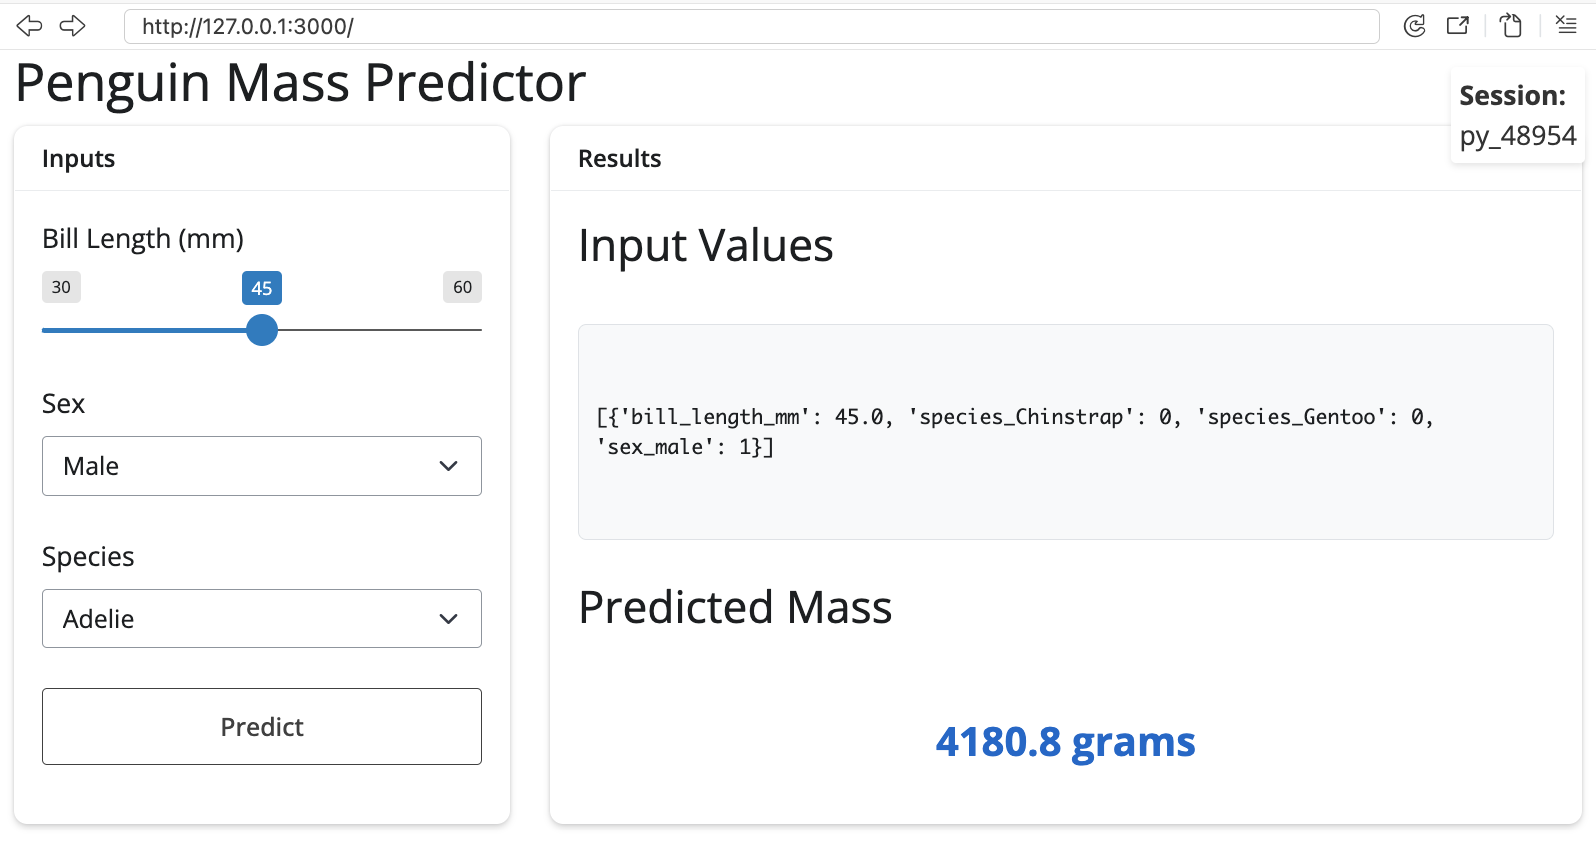
In this post, I’ll create a simple sklearn model as a RESTful API with VetiverModel and FastAPI, then use a Shiny for Python app for making requests. This production-ready architecture gives users an interactive interface to the model for making predictions.
I’ll touch on coding patterns, architecture decisions, and compare my Python solution to my previous implementation using R (with plumber, logger, and shiny).
Architecture
Model
The files in the API folder are below:
_labs/lab4/Python/api/
├── api.Rproj
├── mod-api.py
├── model.py
├── models/
│ └── penguin_model/
├── my-db.duckdb
├── README.md
└── requirements.txtWe’ll first cover creating the model in model.py, then the API in mod-api.py.1
Dependencies
I’ll start by importing the packages. In Python (and Positron), we want to manage our Python dependencies using venv.2 We can accomplish this by creating the .venv/ (virtual environment) and reading the requirements from requirements.txt.
# check Python version
which python3
python3 --version
/usr/bin/python3 -m venv .venv
source .venv/bin/activate
pip install -r requirements.txtAt the top of model.R, we will load the necessary packages:
from palmerpenguins import load_penguins
from pandas import get_dummies
import numpy as np
from sklearn.linear_model import LinearRegression
from sklearn import preprocessing
import duckdbPython dependencies tend to more explicit than R dependencies, specifically the “import only specific things” style (i.e., from pandas import get_dummies). I’m still figuring out how to use the aliases, but I’ve found that this level of precision helps me plan better (and not import something I won’t use).
Data
The data are imported from the Python palmerpenguins package and used to create an embedded database connection (con). We then create a table from the pandas DataFrame, query and clean the data (drop missing), view the top three rows, and close the connection.
penguins_data = load_penguins()
con = duckdb.connect('my-db.duckdb')
con.execute("CREATE OR REPLACE TABLE penguins AS SELECT * FROM penguins_data")
df = con.execute("SELECT * FROM penguins").fetchdf().dropna()
print(df.head(3))
con.close() species island bill_length_mm bill_depth_mm flipper_length_mm body_mass_g sex year
0 Adelie Torgersen 39.1 18.7 181.0 3750.0 male 2007
1 Adelie Torgersen 39.5 17.4 186.0 3800.0 female 2007
2 Adelie Torgersen 40.3 18.0 195.0 3250.0 female 2007Linear regression
The linear regression model uses one-hot encoding with get_dummies() by dropping the first category of each factor.
X = get_dummies(df[['bill_length_mm', 'species', 'sex']], drop_first = True)
y = df['body_mass_g']
model = LinearRegression().fit(X, y)What get_dummies() does is create a series of binary indicators for the categorical factors (dropped category becomes the reference level):
| Original Data | After get_dummies(drop_first=True) |
|---|---|
bill_length_mm: 39.1species: Adeliesex: male |
bill_length_mm: 39.1species_Chinstrap: 0species_Gentoo: 0sex_male: 1 |
bill_length_mm: 46.5species: Gentoosex: female |
bill_length_mm: 46.5species_Chinstrap: 0species_Gentoo: 1sex_male: 0 |
If species_Chinstrap=0 and species_Gentoo=0, the penguin is Adelie
For the LinearRegression model, the .fit() method trains the model in-place and returns self, enabling method chaining. We can print out the model attributes (R^2, intercept, coefficients, etc.) to confirm it’s working:
# model attributes
print(f"R^2 {model.score(X,y)}")
print(f"Intercept {model.intercept_}")
print(f"Coefficients {model.coef_}")- 1
-
The
.score()method computes R^2 (coefficient of determination) on the training data
- 2
-
The
modelintercept
- 3
-
The
modelcoefficients
R^2 0.8555368759537614
Intercept 2169.2697209393973
Coefficients [ 32.53688677 -298.76553447 1094.86739145 547.36692408]The prototype data shows the transformation from get_dummies():
print(f"prototype_data {X}")prototype_data bill_length_mm species_Chinstrap species_Gentoo sex_male
0 39.1 False False True
1 39.5 False False False
2 40.3 False False False
4 36.7 False False False
5 39.3 False False True
.. ... ... ... ...
339 55.8 True False True
340 43.5 True False False
341 49.6 True False True
342 50.8 True False True
343 50.2 True False False
[333 rows x 4 columns]The columns in X also let us know what kind of data this model will be expecting.
print(f"Columns {X.columns}")Columns Index(['bill_length_mm', 'species_Chinstrap', 'species_Gentoo', 'sex_male'], dtype='object')VetiverModel
Now we can wrap the trained sklearn.linear_model with metadata as a VetiverModel and store it as v:
from vetiver import VetiverModel
v = VetiverModel(model, model_name='penguin_model', prototype_data=X)The prototype_data is set to X (which we created above).
pins board
We’ll use pins to create a model/ board (i.e., the storage directory) and save our vetiver versioned model.
import os
from pins import board_folder
from vetiver import vetiver_pin_write
model_board = board_folder("./models", allow_pickle_read=True)
vetiver_pin_write(model_board, v)%%{init: {'theme': 'neutral', 'look': 'neo', 'themeVariables': { 'fontFamily': 'monospace', "fontSize":"18px"}}}%%
graph LR
subgraph Board["<strong>./models/</strong>"]
ModelDir["<strong>penguin_model/<strong>"]
Version["<strong>20251224T142035Z-c115b/</strong>"]
DataTxt["<code>data.txt</code>"]
ModelFile["<code>penguin_model.joblib</code>"]
end
ModelDir -->|<em>timestamp with hash</em>|Version
Version --> |<em>pin metadata</em>|DataTxt
Version --> |<em>serialized model</em>|ModelFile
style Board fill:#E8F5E9,stroke:#2E7D32
style Version fill:#BBDEFB,stroke:#1565C0
style ModelFile fill:#FF9800,stroke:#E65100,color:#fff
The models/ folder contains the following:
models/
└── penguin_model
└── 20251224T142035Z-c115b
├── data.txt
└── penguin_model.joblib
3 directories, 2 files- 1
-
Model name
- 2
-
Version timestamp + hash
- 3
-
Pin metadata (JSON format)
- 4
- Serialized sklearn model (joblib format)
API
Now that we have a Vetiver model, we can build an API. At the top of the mod-api.py file, warnings and os are imported because we’re going to ignore the OpenSSL warning and set the PINS_ALLOW_PICKLE_READ environment variable (because we know the files come from a trusted source lab):3
# pkgs
import warnings
warnings.filterwarnings("ignore", message=".*urllib3 v2 only supports OpenSSL.*")
import os
os.environ['PINS_ALLOW_PICKLE_READ'] = '1'After importing the libraries, we connect to the model board (that was created in model.py) and read the pinned model.
# dependencies
import vetiver
import pins
import uvicorn
import pandas as pd
model_board = pins.board_folder("models/")
sklearn_model = model_board.pin_read("penguin_model")To ensure the sklearn_model model has the correct input data, we validate the expected features by checking the feature_names_in_ attribute:
# features
if hasattr(sklearn_model, 'feature_names_in_'):
feature_names = sklearn_model.feature_names_in_
print(f"Model expects features: {list(feature_names)}")This attribute are the, “Names of features seen during fit. Defined only when X has feature names that are all strings.”
Prototype Data
The model prototype data–which is like a contract between the client and the API–defines the expected input schema. We define the prototype data using a get_prototype_value() function, which checks the column names and has some sensible validation rules (provided the model has the expected features (i.e., from feature_names_in_ and feature_names)):
def get_prototype_value(column_name):
"""Get appropriate default value for each column type"""
if 'bill_length' in column_name:
return 45.0
elif 'species_Gentoo' in column_name:
return 1
elif 'sex_male' in column_name:
return 1
else:
return 0
prototype_data = pd.DataFrame({
name: [get_prototype_value(name)] for name in feature_names
})- 1
-
Realistic penguin bill length
- 2
-
Default to Gentoo species
- 3
-
Default to male
- 4
-
Default for other dummy variables
- 5
- Create prototype data using the raw input column names the estimator saw at fit time
If the sklearn_model doesn’t contain or expose the feature_names_in_ attribute, we manually create prototype_data as a pandas.DataFrame with hard-coded columns:
else:
print("Model doesn't have feature_names_in_, using estimated prototype")
prototype_data = pd.DataFrame({
"bill_length_mm": [45.0],
"species_Chinstrap": [0],
"species_Gentoo": [1],
"sex_male": [1]
})This method prevents runtime errors when the model structure doesn’t match expectations.
Wrapping and Serving
After reading sklearn_model from the pins board, we still need to convert it to VetiverModel:
# model
v = vetiver.VetiverModel(
model=sklearn_model,
model_name="penguin_model",
prototype_data=prototype_data
)- 1
-
Wrap as
VetiverModeland specify ourprototype_data.
VetiverAPI uses the Vetiver model (v) to create the API (vetiver_api).
# API
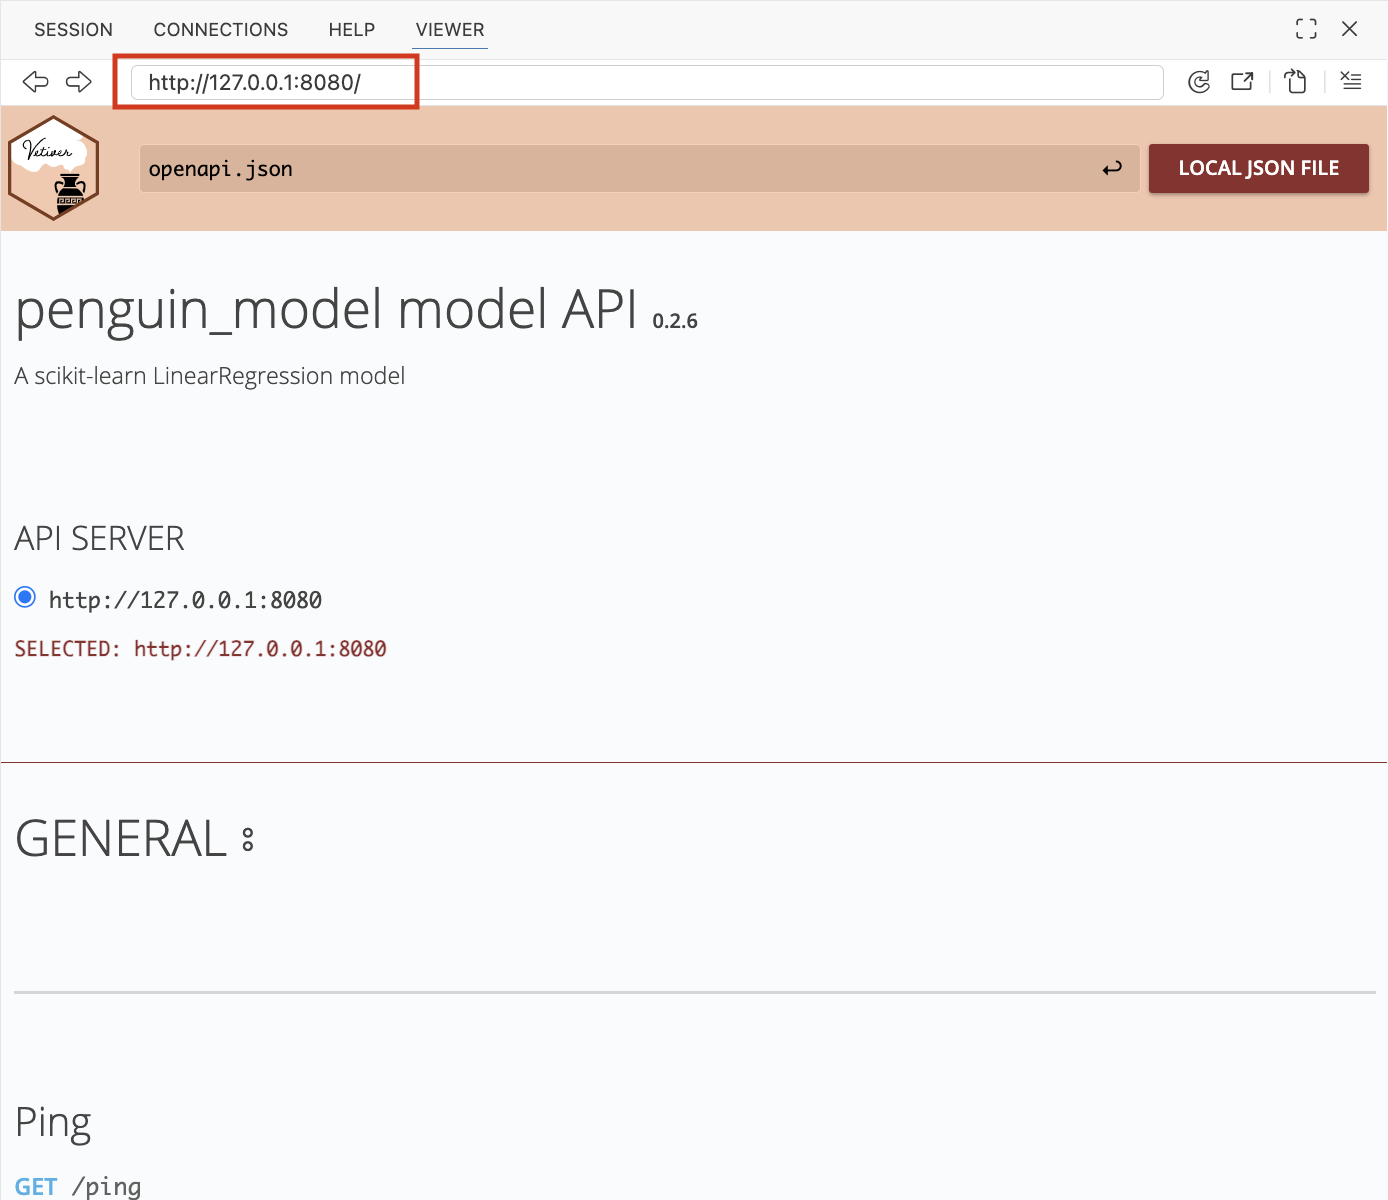
vetiver_api = vetiver.VetiverAPI(v, check_prototype=True) The check_prototype is set to True because this ensures the prototype will be enforced. To view the API, we can use vetiver_api.run() to open the VetiverAPI in the browser.
# View
vetiver_api.run(port = 8080) We can also extract app from vetiver_api, which is the actual app (i.e., <class 'fastapi.applications.FastAPI'>). To run app, we’ll use uvicorn.run() (and include some finishing checks):
# extract
app = vetiver_api.app
if __name__ == "__main__":
print(":-] Starting Penguin Model API...")
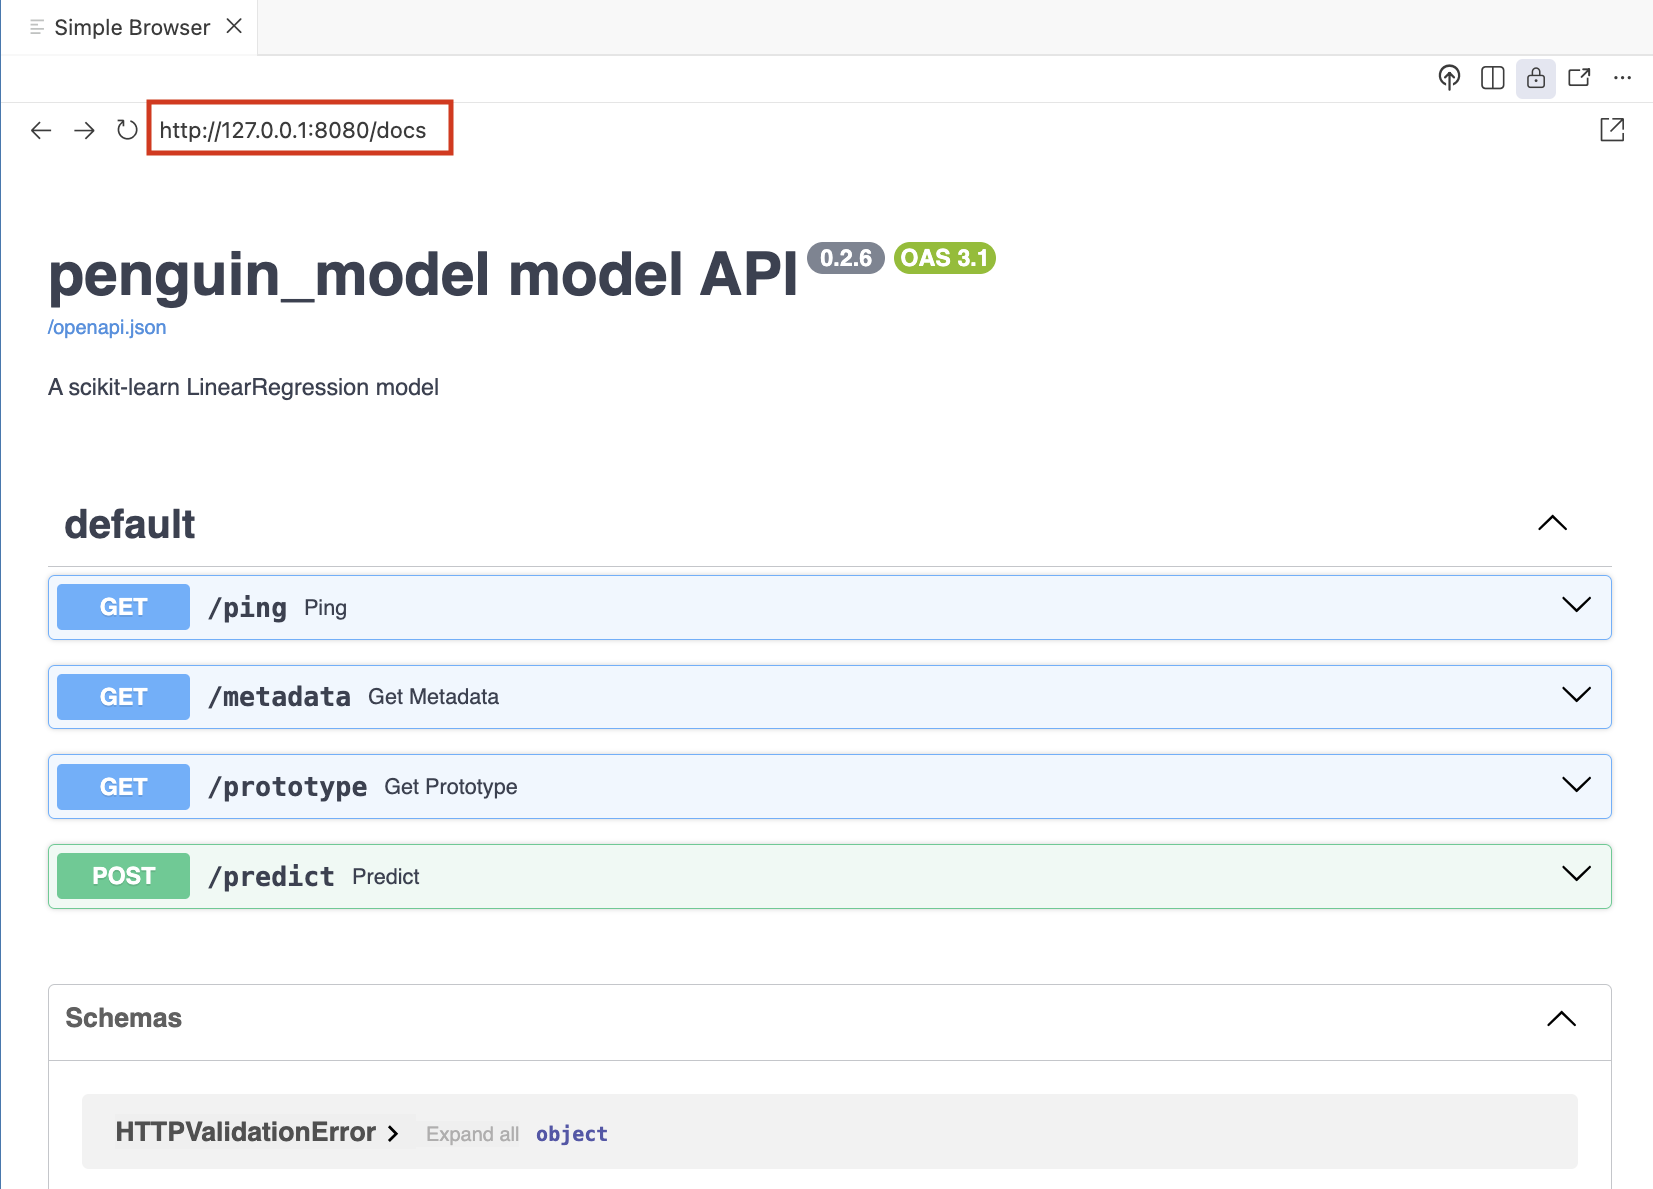
print(":-] API Documentation: http://127.0.0.1:8080/docs")
print(":-] Health Check: http://127.0.0.1:8080/ping")
print(":-] Model Info: http://127.0.0.1:8080/metadata")
uvicorn.run(app, host="127.0.0.1", port=8080)- 1
-
Extract
FastAPIAPI object - 2
-
This ensures that server-starting code only runs when the file is executed directly
- 3
-
Documentation and API URLs
- 4
- Run the API
When mod-api.py is run directly, Python automatically sets a special variable called __name__ (and it’s value is "__main__"). This ensures the api only starts when we explicitly run the script.
Console output
To run the API, we enter the following in the Terminal:
python3 mod-api.py:-] Starting Penguin Model API...
:-] API Documentation: http://127.0.0.1:8080/docs
:-] Health Check: http://127.0.0.1:8080/ping
:-] Model Info: http://127.0.0.1:8080/metadata
INFO: Started server process [8825]
INFO: Waiting for application startup.
INFO: VetiverAPI starting...
INFO: Application startup complete.
INFO: Uvicorn running on http://127.0.0.1:8080 (Press CTRL+C to quit)Clicking on http://127.0.0.1:8080 will open the Vetiver interface,
Going to http://127.0.0.1:8080/docs will open the FastAPI interface:
App
The Shiny for Python app I created is in a separate app/ folder:
_labs/lab4/Python/app/
├── app.py
├── app.Rproj
├── logs
│ └── shiny_app.log
├── README.md
└── requirements.txtDependencies
The requirements.txt is used to manage the pip dependencies (along with a virtual environment). The application modules are imported and loaded in the top of the app.py file:
from shiny import App, render, ui, reactive
import requests
import json
import logging
import time
import os
from datetime import datetime
from pathlib import PathLogging
Logging is done using the logging module:4
# config
def setup_logging():
"""Configure logging with file and console output"""
log_dir = Path("logs")
log_dir.mkdir(exist_ok=True)
log_file = log_dir / "shiny_app.log"
logging.basicConfig(
level=logging.INFO,
format='%(asctime)s - %(levelname)s - %(message)s',
handlers=[
logging.FileHandler(log_file, mode='a'),
logging.StreamHandler()
]
)
return str(log_file)
# init
log_file_path = setup_logging()- 1
-
Function definition for
setup_logging()
- 2
-
Docstring
- 3
-
Location of log files (
logs/)
- 4
-
Create the directory
- 5
-
Full path to the log file (
logs/shiny_app.log)
- 6
-
Configuration of the root logging system
- 7
-
The log
levelof the root logger
- 8
-
The
formatof the root logger
- 9
-
The
handlersare added to the root logger (should include aFileHandlerandStreamHandler)
- 10
-
Sends logging output to a file
- 11
-
Sends logging output to console
- 12
- Return log file
- 13
-
Run
setup_logging()function to createlog_file_path
The trickiest part of the logging configuration was making sure the logs were sent to the console and the log_file,5 but after reading through the tutorial (and doing some troubleshooting) I was able to get both handlers set up.6
The initial contents of the logs/shiny_app.log file are the first and last logs in the app:
2026-01-02 14:23:53,666 - INFO - Shiny for Python application initialized
2026-01-02 14:23:53,733 - INFO - Shiny for Python application created successfullylogging.info("Shiny for Python application initialized")- 1
- Generate first log
The second line in the log file is created at the bottom of the app.py file and lets us know the application launched.
logging.info("Shiny for Python application created successfully")URLS
The URLS for the API are defined as api_url (for making predictions) and ping_url (for health checks).
api_url = 'http://127.0.0.1:8080/predict'
ping_url = 'http://127.0.0.1:8080/ping'Sessions
The UI displays the session ID in a div():
ui.div(
ui.strong("Session: "),
ui.output_text(id="session_display"),
style="position: fixed; top: 10px; right: 10px; z-index: 1000; color: #333; background: #fff; padding: 5px; border-radius: 3px; box-shadow: 0 2px 4px rgba(0,0,0,0.1);"
)- 1
-
The
idin theui.output_text()linked to the@render.textin theserver
In the server, we generate a session ID and log the session start:
def server(input, output, session):
session_id = f"py_{int(time.time() * 1000) % 100000}"
logging.info(f"New session started - Session: {session_id}")- 1
-
The
session_idis a unique number based ontime.time()
- 2
- This new session is logged in the log file.
In the log file, we can see the INFO level log with the session_id:
2026-01-02 14:24:03,831 - INFO - New session started - Session: py_43831The output in the application is created using a the @render decorator and by defining a function (matching the id from the UI):
@render.text
def session_display():
return session_id[:8]- 1
-
Decorator for the text output
- 2
-
Function definition for output (matching
session_displayinputid)
- 3
-
Return first 8 numbers of
session_id
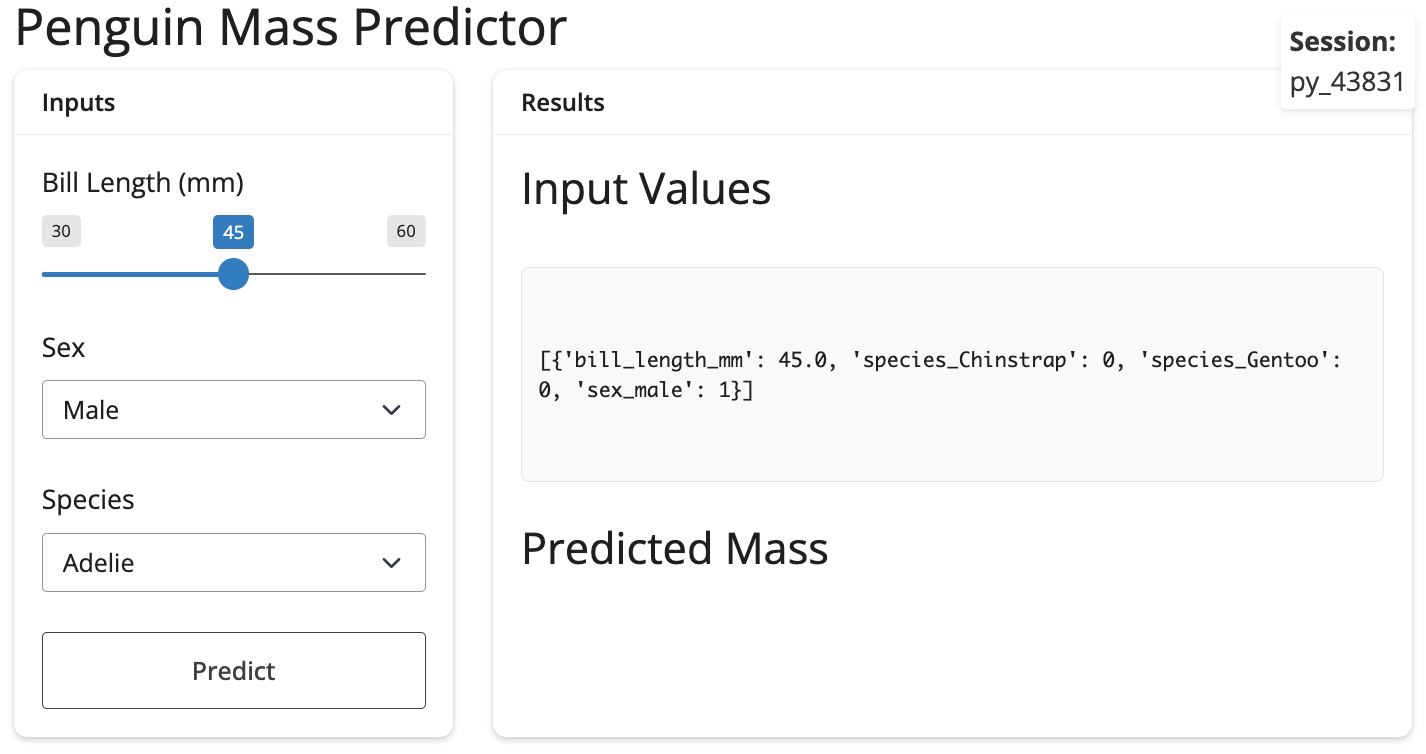
The result is a new session id in the upper right corner of the app:
Health check
The health check is performed using the same UI and server pattern as the session id, but it also includes the creation of a reactive (@reactive.calc).
First we place the output_ component in the UI:
ui.output_text(id="api_status")In the server, we use a @reactive.calc decorator and define the api_health_check() function and implement exception handling for the health check:
show/hide health check
@reactive.calc
def api_health_check():
"""Enhanced API health check with logging"""
try:
logging.debug(f"Checking API health - Session: {session_id}")
start_time = time.time()
r = requests.get(ping_url, timeout=5)
response_time = time.time() - start_time
if r.status_code == 200:
logging.info(f"API health check successful - Session: {session_id} - response_time: {response_time:.3f}s")
return f"✅ API is running (ping: {r.json()}) - {response_time:.2f}s"
else:
logging.warning(f"API ping failed - Session: {session_id} - status: {r.status_code}")
return f"⚠️ API ping failed: {r.status_code}"
except requests.exceptions.ConnectionError as e:
logging.error(f"API connection refused - Session: {session_id} - error: {str(e)}")
return "❌ Cannot connect to API - is it running on port 8080?"
except requests.exceptions.Timeout:
logging.warning(f"API health check timeout - Session: {session_id}")
return "⚠️ API health check timeout"
except Exception as e:
logging.error(f"API health check failed - Session: {session_id} - error: {str(e)}")
return f"❌ API health check failed: {str(e)}"- 1
-
Function definition for reactive value
- 2
- Docstring
- 3
-
The
try: ...andexcept ...structure provide the exception handling
- 4
-
Request using
ping_url
- 5
-
Calculated response time
- 6
-
Successful health check
- 7
-
Failed health check
- 8
-
Handles “cannot connect” (API down, wrong port/host, connection refused)
- 9
-
Handles request timeout specifically
- 10
- Catch-all for anything else (JSON parsing errors, unexpected runtime issues, etc.)
The diagram below illustrates how the @reactive.calc, logging, time and requests are used to send a ping to the API, get a response (r), calculate the response time (response_time), return the status code (r.status_code), and classify the response:
%%{init: {'theme': 'neutral', 'look': 'neo', 'themeVariables': { 'fontFamily': 'monospace', "fontSize":"18px"}}}%%
sequenceDiagram
participant Reactive as reactive.calc
participant Logger as logging
participant Timer as time
participant Client as requests
participant API as Vetiver API
Reactive->>Logger: debug("Checking API health (session_id)")
Reactive->>Timer: start_time = time.time()
Reactive->>Client: GET ping_url (timeout=5)
Client->>API: HTTP GET /ping
API-->>Client: HTTP response
Client-->>Reactive: response r
Reactive->>Timer: response_time = time.time() - start_time
alt status_code == 200
Reactive->>Logger: info("Health check successful + response_time")
Reactive-->>Reactive: return "✅ API is running"
else status_code != 200
Reactive->>Logger: warning("API ping failed (status_code)")
Reactive-->>Reactive: return "⚠️ API ping failed"
end
Exception handling is created with try and except: the request,get() in try runs normally, but if an error or exception occurs, the code will jump to the first matching except block:
%%{init: {'theme': 'neutral', 'look': 'neo', 'themeVariables': { 'fontFamily': 'monospace', "fontSize":"18px"}}}%%
sequenceDiagram
participant Reactive as reactive.calc
participant Logger as logging
participant Client as requests
participant API as Vetiver API
Reactive->>Logger: debug("Checking API health (session_id)")
Reactive->>Client: GET ping_url (timeout=5)
alt Normal execution
Client->>API: HTTP GET /ping
API-->>Client: HTTP response
Client-->>Reactive: response r
Reactive-->>Reactive: continue normal flow
else ConnectionError
Client--x Reactive: Connection refused
Reactive->>Logger: error("Connection refused")
Reactive-->>Reactive: return "❌ Cannot connect to API"
else Timeout
Client--x Reactive: Request timeout
Reactive->>Logger: warning("Health check timeout")
Reactive-->>Reactive: return "⚠️ API health check timeout"
else Unexpected exception
Reactive--x Reactive: Runtime exception
Reactive->>Logger: error("Unexpected error")
Reactive-->>Reactive: return "❌ API health check failed"
end
These exceptions are typed (e.g., equests.exceptions.ConnectionError, requests.exceptions.Timeout, etc.), which means we can match them precisely in separate except clauses.
Back in the API, we see the health check was sent from the Shiny app:
INFO: 127.0.0.1:63543 - "GET /ping HTTP/1.1" 200 OKThe output is rendered in the app with the @render.text decorator (after defining a function the matches in input id).
@render.text
def api_status():
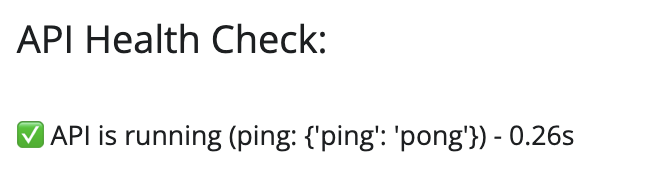
return api_health_check()In the System Status section, we see the results of the ping:
Predictions
In the UI, the predictions get their own div() with some CSS styling:
ui.div(
ui.output_text("pred_out"),
style="font-size: 24px; font-weight: bold; text-align: center; padding: 15px; color: #0066cc;"
)In the server, the @reactive.calc for the prediction is tied to the action button input with @reactive.event():
show/hide predictions
@reactive.calc
@reactive.event(input.predict)
def pred():
"""Prediction with logging"""
request_start = time.time()
data_to_send = vals()
logging.info(f"Starting prediction request - Session: {session_id} - request_data: {json.dumps(data_to_send)}")
try:
print(f"\n=== PREDICTION REQUEST ===")
print(f"Sending data to API: {data_to_send}")
r = requests.post(api_url, json=data_to_send, timeout=30)
response_time = time.time() - request_start
current_times = request_times()
current_times.append(response_time)
if len(current_times) > 10:
current_times = current_times[-10:]
request_times.set(current_times)
print(f"HTTP Status Code: {r.status_code}")
print(f"Raw response text: {r.text}")
if r.status_code == 200:
result = r.json()
print(f"✅ Success! Parsed response: {result}")
if '.pred' in result:
prediction = result['.pred'][0]
elif 'predict' in result:
prediction = result['predict'][0]
else:
logging.warning(f"Unexpected response format - Session: {session_id} - response: {result}")
return f"Unexpected response format: {result}"
logging.info(f"Prediction successful - Session: {session_id} - response_time: {response_time:.3f}s - prediction: {prediction}")
if response_time > 5:
logging.warning(f"Slow API response - Session: {session_id} - response_time: {response_time:.3f}s")
return prediction
else:
error_msg = f"API Error {r.status_code}: {r.text}"
logging.error(f"Prediction request failed - Session: {session_id} - status: {r.status_code} - response: {r.text[:200]}")
error_count.set(error_count() + 1)
return error_msg
except requests.exceptions.ConnectionError as e:
error_msg = f"Connection Error: {str(e)}"
logging.error(f"API connection refused during prediction - Session: {session_id} - error: {str(e)}")
connection_errors.set(connection_errors() + 1)
error_count.set(error_count() + 1)
print(f"❌ Connection Error: {e}")
return error_msg
except requests.exceptions.Timeout:
error_msg = "Request timed out - API may be overloaded"
logging.warning(f"API timeout during prediction - Session: {session_id}")
timeout_errors.set(timeout_errors() + 1)
error_count.set(error_count() + 1)
return error_msg
except Exception as e:
error_msg = f"Error: {str(e)}"
logging.error(f"Unknown prediction error - Session: {session_id} - error: {str(e)}")
error_count.set(error_count() + 1)
print(f"❌ Error: {e}")
return error_msg- 1
-
Post start time
- 2
-
Prediction data
- 3
-
Make a request
- 4
-
Response time
- 5
-
Update performance metrics
- 6
-
Successful request
- 7
-
Handle different possible response formats
- 8
-
Log successful request
- 9
-
Performance warning
- 10
-
Failed request
- 11
-
Connection error
- 12
-
Timeout during request
- 13
- Unknown error
The pred() function includes the same error handling pattern as the health check, but includes defensive HTTP handling for the POST request:
%%{init: {'theme': 'neutral', 'look': 'neo', 'themeVariables': { 'fontFamily': 'monospace', "fontSize":"18px"}}}%%
graph TD
Request["<strong>HTTP<br>Request</strong"]
Success{"Status<br>200?"}
Format{"Valid<br>Format?"}
Parse("<strong>Parse<br>Prediction</strong>")
ConnErr{"Connection<br>Error?"}
TimeErr{"Timeout<br>Error?"}
OtherErr["Other<br>Error"]
Request --> Success
Success -->|Yes| Format
Success -->|No| LogHTTPErr("<strong>Log HTTP<br>Error</strong><br>(return<br>message)")
Format -->|Yes| Parse
Format -->|No| LogFormatErr["Log<br>Format<br>Warning<br>(return<br>message)"]
Parse --> CheckPerf{Response > 5s?}
CheckPerf -->|Yes| LogSlow["Log<br>Performance<br>Warning"]
CheckPerf -->|No| Return["Return<br>Prediction"]
LogSlow --> Return
Success -->|Error| ConnErr
ConnErr -->|Yes| LogConn("<strong>Log<br>Connection<br>Error</strong><br>(increment<br>counter)")
ConnErr -->|No| TimeErr
TimeErr -->|Yes| LogTimeout("<strong>Log<br>Timeout</strong><br>(increment<br>counter)")
TimeErr -->|No| OtherErr
OtherErr --> LogOther["Log<br>Unknown<br>Error"]
style Request fill:#2986cc,stroke:#2E7D32,color:#fff
style Parse fill:#4CAF50,stroke:#2E7D32,color:#fff
style LogHTTPErr fill:#f44336,stroke:#c62828,color:#fff
style LogConn fill:#f44336,stroke:#c62828,color:#fff
style LogTimeout fill:#FF9800,stroke:#E65100,color:#fff
In the console running the app, we see the logs with the prediction request (including the data that matches the reactive values in the UI):
2026-01-05 14:01:01,661 - INFO - Starting prediction request - Session: py_48954
- request_data: [{"bill_length_mm": 45.0, "species_Chinstrap": 0,
"species_Gentoo": 0, "sex_male": 1}]
=== PREDICTION REQUEST ===
Sending data to API: [{'bill_length_mm': 45.0, 'species_Chinstrap': 0,
'species_Gentoo': 0, 'sex_male': 1}]The successful request and prediction value is returned:
HTTP Status Code: 200
Raw response text: {"predict":[4180.796549720755]}
✅ Success! Parsed response: {'predict': [4180.796549720755]}In the console running the API, we can see the POST request hit /predict endpoint:
INFO: 127.0.0.1:64436 - "POST /predict HTTP/1.1" 200 OKBack in the server, the output is rendered using @render.text and some checks to ensure the returned prediction is in the proper format:
@render.text
def pred_out():
result = pred()
if isinstance(result, (int, float)):
display_value = f"{round(result, 1)} grams"
logging.info(f"Displaying prediction to user - Session: {session_id} - display_value: {display_value}")
return display_value
else:
return str(result)In the console running the app, the successful prediction is returned and we get a preview of the predicted value to be displayed:
2026-01-05 14:01:02,049 - INFO - Prediction successful - Session: py_48954
- response_time: 0.388s - prediction: 4180.796549720755
2026-01-05 14:01:02,049 - INFO - Displaying prediction to user - Session: py_48954
- display_value: 4180.8 gramsWe see the predicted value in the UI in the Predicted Mass section:
All of the logs are captured in the logs/shiny_app.log file (and displayed in the app):
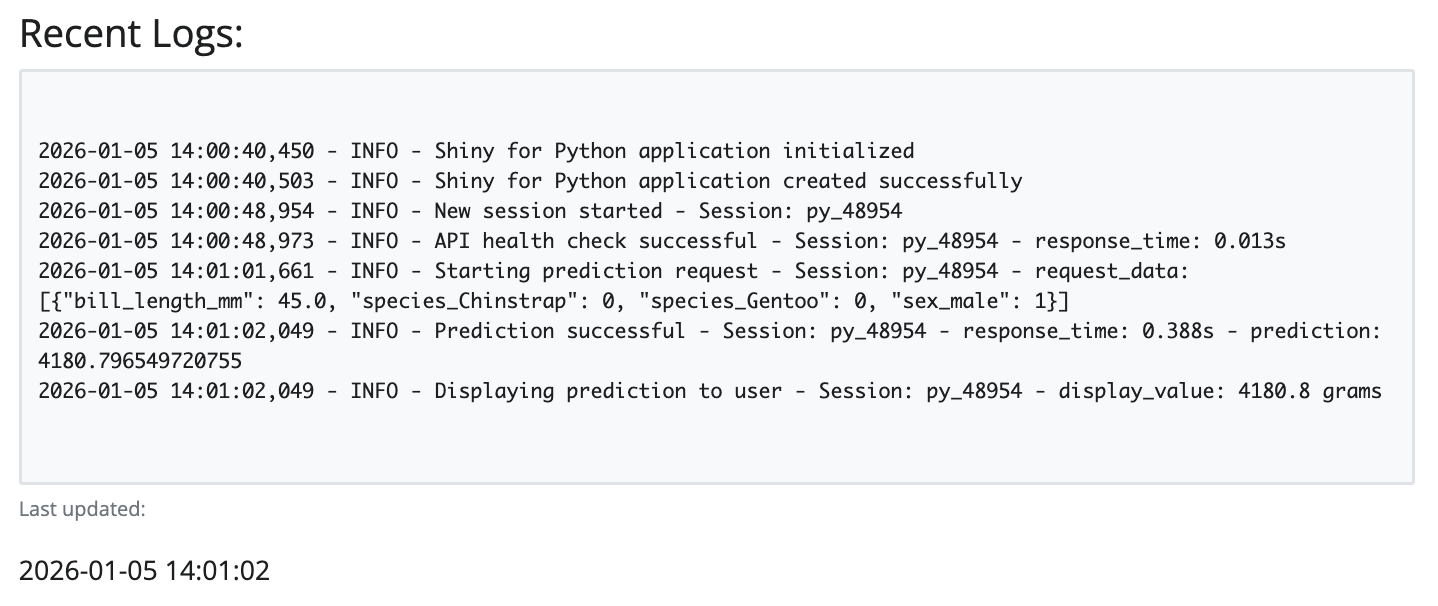
Recap
As we’ve seen with this post (and the previous post), Python and R offer equivalent capabilities, but with different syntactic approaches for modeling, logging, and Shiny app development:
We can convert a trained sklearn model to Vetiver, and wrap it in a REST API (with validated model inputs and prototype data). We can also add health checks and documentation endpoints for monitoring and features, and model APIs also immplement request timeouts to prevent hanging.
Python’s logging module makes it easy to configure structured logs with consistent formats and multiple destinations (file + console). Displaying the recent logs in the UI allow us to monitor logs in real-time. The Shiny for Python app is set up to log all user interactions (via session tracking), and it can handle all HTTP error cases (with user-friendly error messages). The UI also displays the API health and POST request data before being sent to the API.
The tables below compare Python and R methods for creating models, APIs, and shiny apps.
Model as Service
| Feature | Python (Vetiver + pins) | R (Vetiver + pins) |
|---|---|---|
| Import Packages | from vetiver import VetiverModel, from pins import board_folder |
library(vetiver), library(pins) |
| Create Board | board_folder("./models", allow_pickle_read=True) |
board_folder("./models") |
| Wrap Model | v = VetiverModel(model, model_name="name", prototype_data=X) |
v <- vetiver_model(model, model_name="name") |
| Prototype Data | Explicitly passed: prototype_data=X |
Auto-extracted from workflows/recipes |
| Write Model | vetiver_pin_write(board, v) |
vetiver_pin_write(board, v) |
| Read Model | v = board.pin_read("name") |
v <- vetiver_pin_read(board, "name") |
Logging
| Feature | Python (logging module) |
R (logger package) |
|---|---|---|
| Setup | logging.basicConfig() |
log_threshold() |
| File Output | logging.FileHandler('app.log') |
log_appender(appender_file('app.log')) |
| Console + File | handlers=[FileHandler(), StreamHandler()] |
log_appender(appender_tee('app.log')) |
| Log Levels | logging.DEBUG, logging.INFO, logging.WARNING, logging.ERROR |
TRACE, DEBUG, INFO, WARN, ERROR, FATAL |
| Basic Logging | logging.info("Message") |
log_info("Message") |
| String Interpolation | logging.info(f"Value: {x}") |
log_info("Value: {x}") (glue syntax) |
Shiny
| Feature | Python Shiny | R Shiny |
|---|---|---|
| Reactivity | @reactive.calc |
reactive() |
| Rendering | @render.text |
renderText() |
| Events | @reactive.event() |
bindEvent() |
| UI | ui.input_slider() |
sliderInput() |
| Layout | ui.page_fluid() |
page_fluid() (bslib) |
Footnotes
The code below has been adapted from the modeling section of the ML Ops with vetiver example.↩︎
Similar to the
renvpackage in R.↩︎The code below is adapted from the Deploy section of the ML Ops with vetiver example.↩︎
In comparison to the
loggerpackage in the previous post.↩︎Read more about ‘logging to multiple destinations’ in Logging cookbook↩︎
Logging handlers “are responsible for dispatching the appropriate log messages (based on the log messages’ severity) to the handler’s specified destination.”↩︎