pkgs <- c("vetiver", "pins", "plumber", "logger", "palmerpenguins",
          "duckdb","DBI", "dplyr", "bslib", "bsicons", "httr2",
          "jsonlite")
install.packages(pkgs)I’ve been working my way through DevOps for Data Science by Alex K Gold (highly recommended) and the chapter on APIs includes exercises for using apps to communicate with APIs. The examples provided are for accomplishing this in both Python and R.
This post covers the R solution I came up with using shiny, duckdb, vetiver, pins, logger and plumber.
Suggested reading
Below are the packages you’ll need to reproduce the solution:
If this is your first time encountering APIs, I suggest watching the Expanding R horizons: Integrating R with Plumber APIs video and reading the Creating APIs for data science with plumber and RStudio and APIs blog posts. I’ll do my best to summarize the information in these resources, but they are excellent references worth reading from the original authors.
What is an API?
An API, or Application Programming Interface, is like a shared language that lets different pieces of software talk to each other and exchange information or commands.
APIs provide a clear way for software programs to interact, allowing different apps and services to connect without needing to understand their internal workings.
%%{init: {'theme': 'neutral', 'look': 'handDrawn', 'themeVariables': { 'fontFamily': 'monospace', "fontSize":"18px"}}}%%

graph LR
    AppA["App A"] -->|Request| API["<strong>API<br/>(<em>Shared Language</em>)</strong>"]
    API -->|Translated<br>Request| AppB["App B"]
    AppB -->|Response| API
    API -->|Translated<br>Response| AppA

    style API fill:#4CAF50,stroke:#2E7D32,color:#fff
    style AppA color:#000
    style AppB color:#000
In R, package APIs handle things like authentication (OAuth tokens, API keys, etc.), creating the correct query parameters, and parsing the JSON/XML responses into data frames or lists, which means we can focus on the higher-level data tasks rather than on the low-level networking details.
Consider the gh package sequence diagram below:
%%{init: {'theme': 'neutral', 'look': 'handDrawn', 'themeVariables': { 'fontFamily': 'monospace', "fontSize":"18px"}}}%%

sequenceDiagram
    participant User as R User
    participant Pkg as gh Package
    participant Auth as Auth Handler
    participant API as GitHub API

    User->>Pkg: gh("GET /repos/tidyverse/dplyr")
    Pkg->>Auth: Retrieve PAT token
    Auth-->>Pkg: GITHUB_PAT
    Pkg->>API: GET request + token + headers
    API-->>Pkg: JSON response
    Pkg->>Pkg: Parse JSON to list
    Pkg-->>User: R list with repo info

    Note over User,Pkg: User never sees tokens,<br/>URLs, or raw JSON
The lab exercise for this chapter involves 1) putting the palmerpenguins in a duckdb database,1 2) pointing a vetiver model to the database and converting it into an API,2 and 3) building a Shiny app that calls the model API to display predictions:3
“…you’ll want to store input parameters in a reactive and then send a request to the API when the user presses a button.”
The API
The API code files I created for these lab exercises are displayed in the folder tree below:4
api/
├── api.Rproj
├── model.R
├── models/
│   └── penguin_model/
├── my-db.duckdb
├── plumber.R
├── renv/
└── renv.lock

6 directories, 7 files
The model
The model.R file creates our model (found in the models folder). After loading the necessary packages, we establish a connection to the duckdb database (con) and register the penguins dataset.
We use SQL to create a persistent table in the database and extract a subset of columns and rows for the model (df).
Finally, we disconnect from the database.
show/hide database creation
con <- DBI::dbConnect(duckdb::duckdb(), "my-db.duckdb")

duckdb::duckdb_register(con, "penguins_raw", palmerpenguins::penguins)

DBI::dbExecute(
  con,
  "CREATE OR REPLACE TABLE penguins AS SELECT * FROM penguins_raw"
)
df <- DBI::dbGetQuery(
  con,
  "SELECT bill_length_mm, species, sex, body_mass_g
   FROM penguins
   WHERE body_mass_g IS NOT NULL
   AND bill_length_mm BETWEEN 30 AND 60
   AND sex IS NOT NULL
   AND species IS NOT NULL"
)

DBI::dbDisconnect(con)
For the model:
Start by using the
stats::lm()function to predict body mass using bill length, species, and sex.We then pass the model object to the
vetiver_model()and provide amodel_nameanddescriptionvetiver_pin_write()‘pins’ a trained model, an input prototype for new data, and and other model metadata to a model boardThe
board_folder()from thepinspackage allows us write model to a board inside a folder (for sharing on network drives like Dropbox)
show/hide vetiver model creation
model <- lm(body_mass_g ~ bill_length_mm + species + sex, data = df)

v <- vetiver::vetiver_model(
  model,
  model_name = "penguin_model",
  description = "Linear model predicting penguin body mass from bill length, species, and sex",
  save_prototype = TRUE
)

model_board <- pins::board_folder("models/")

vetiver::vetiver_pin_write(model_board, v)
Now we’ve creates a vetiver model and stored it in the board_folder named models/penguin_model. The model.R file only needs to run once to build the model.
plumber.R
In plumber.R, we read the model into our environment using board_folder() to connect to the pins board, and vetiver_pin_read() will return the vetiver model object ready for deployment:
model_board <- pins::board_folder("models/")
v <- vetiver::vetiver_pin_read(model_board, "penguin_model")
With the model in our environment, we’ll print some attributes to the console when the plumber API is run:
show/hide model attributes
cat("\n=== Model Loaded Successfully ===\n")
cat("Model name:", v$model_name, "\n")
cat("Model class:", class(v$model), "\n")
cat("Prototype (expected input):\n")
print(v$prototype)
cat("Factor levels:\n")
cat("  species:", paste(levels(v$prototype$species), collapse = ", "), "\n")
cat("  sex:", paste(levels(v$prototype$sex), collapse = ", "), "\n")
cat("=================================\n\n")
=== Model Loaded Successfully ===
Model name: penguin_model
Model class: butchered_lm lm
Prototype (expected input):
# A tibble: 0 × 3
# ℹ 3 variables: bill_length_mm <dbl>, species <fct>, sex <fct>
Factor levels:
species: Adelie, Chinstrap, Gentoo
sex: female, male
=================================Helper functions
Most of the challenges I encountered with the Shiny/API lab were due to data formatting. APIs love JSON, and I’m used to working with rectangular data (i.e., a data.frame or tibble), specifically with factors. I wrote a helper function for converting incoming JSON data (strings) to the proper R types (factors) that our model expects:
prep_pred_data <- function(input_data) {
  species_levels <- levels(v$prototype$species)
  sex_levels <- levels(v$prototype$sex)

  data.frame(
    bill_length_mm = as.numeric(input_data$bill_length_mm),
    species = factor(input_data$species, levels = species_levels),
    sex = factor(input_data$sex, levels = sex_levels),
    stringsAsFactors = FALSE
  )
}
prep_pred_data() uses the prototype stored in the vetiver model to get correct factor levels. If we pass a data.frame with character values for species and sex:
prep_pred_data(
  data.frame(
    bill_length_mm = 45,
    species = "Adelie",
    sex = "male" )
  )
prep_pred_data() converts the characters to factors with the appropriate levels:
#> 'data.frame':    1 obs. of  3 variables:
#>  $ bill_length_mm: num 45
#>  $ species       : Factor w/ 3 levels "Adelie","Chinstrap",..: 1
#>  $ sex           : Factor w/ 2 levels "female","male": 2
Handlers
The plumber package allows us to create RESTful APIs5 in R by decorating regular R functions with special comments (#*) that define API endpoints and their HTTP methods (also called verbs).
The HTTP methods and their corresponding plumber tags are listed below:
| HTTP verb | plumber tag | Description |
|---|---|---|
| GET | @get |
Request data from a server without modifying anything |
| POST | @post |
Send data to the server to create a new resource |
| PUT | @put |
Replace an entire resource with new data |
| DELETE | @delete |
Delete a specified resource from the server |
| HEAD | @head |
Same as GET but returns only headers (no body content) |
%%{init: {'theme': 'neutral', 'look': 'handDrawn', 'themeVariables': { 'fontFamily': 'monospace', "fontSize":"15px"}}}%%

graph TB
    WriteFun("<em>Write R function</em>")
    RFunc("<code>add <- function(a, b) {<br>  a + b<br>}</code>")
    WriteCom("<em>Add special comments</em>")
    Decor("<code>#* @get /add<br/>#* @param a:int<br/>#* @param b:int</code>")
    Plumber("<em><strong>plumber</strong> package<br/>reads decorations</em>")

    API["<strong>RESTful API Endpoint<br/><code>GET /add?a=5&b=3</code></strong>"]
    Response["<strong>JSON Response<br/><code>{result: 8}</code></strong>"]

    WriteFun --> RFunc
    RFunc --> WriteCom
    WriteCom --> Decor
    Decor --> Plumber
    Plumber --> API
    API --> Response

    style WriteFun fill:#fff,stroke:#fff,color:#000
    style WriteCom  fill:#fff,stroke:#fff,color:#000
    style Plumber  fill:#fff,stroke:#fff,color:#000

    style RFunc text-align:left,fill:#2196F3,stroke:#2196F3,color:#fff
    style Decor text-align:left,fill:#2196F3,stroke:#2196F3,color:#fff

    style API  fill:#fff,stroke:#4051B5,color:#4051B5
    style Response  fill:#fff,stroke:#4CAF50,color:#4051B5
Health Check
The first plumber handler function is a standard health check (or ping). This is a GET/@get endpoint, since it’s only returning requested information (without altering anything).
#* Basic health check
#*
#* Simple endpoint to verify the API is running. Returns a minimal response
#* with status and timestamp.
#*
#* @get /ping
#*
#* @serializer json
#*
handle_ping <- function() {
  list(
    status = "alive",
    timestamp = Sys.time()
  )
}
handle_ping() creates a simple endpoint to verify our API is running without performing any complex operations or database queries. Below is an illustration of how a Client or (Shiny app) would communicate with the API using this endpoint:
%%{init: {'theme': 'neutral', 'look': 'handDrawn', 'themeVariables': { 'fontFamily': 'monospace', "fontSize":"18px"}}}%%

sequenceDiagram
    participant Client
    participant API as plumber<br>API
    participant Handler as handle_ping()

    Note over Client,Handler: Health Check

    Client->>API: GET /ping
    activate API

    API->>Handler: Execute function
    activate Handler

    Handler->>Handler: Get timestamp<br/>Build response list

    Handler-->>API: {status: "alive",<br/>timestamp: Sys.time()}
    deactivate Handler

    API->>API: Serialize to JSON

    API-->>Client: 200 OK<br/>{"status": "alive",<br/>"timestamp": "..."}
    deactivate API
The health check will be displayed in the application to let us know if the API is running.
Predictions
The primary endpoint for predictions is created with handle_predict(). This function uses the prep_pred_data() helper and returns a single numeric predicted penguin body mass (g).
#* Predict penguin body mass
#*
#* Main prediction endpoint that accepts penguin characteristics and returns
#* predicted body mass in grams. Supports both single predictions and batch
#* predictions (multiple penguins in one request).
#*
#* @post /predict
#*
#* @serializer json
handle_predict <- function(req, res) {
cat("\n=== /predict called ===\n")
cat("Raw body:", req$postBody, "\n")
result <- tryCatch({
body <- jsonlite::fromJSON(req$postBody)
cat("Parsed body:\n")
print(body)
if (is.list(body) && !is.data.frame(body)) {
body <- as.data.frame(body)
}
pred_data <- prep_pred_data(body)
cat("Prepared data:\n")
print(pred_data)
str(pred_data)
cat("Calling predict...\n")
prediction <- predict(v, pred_data)
cat("Prediction result:\n")
print(prediction)
cat("Prediction class:", class(prediction), "\n")
if (is.data.frame(prediction) && ".pred" %in% names(prediction)) {
response <- list(.pred = prediction$.pred)
} else if (is.numeric(prediction)) {
response <- list(.pred = as.numeric(prediction))
} else {
response <- list(.pred = as.numeric(prediction))
}
cat("Response:\n")
print(response)
cat("=== /predict complete ===\n\n")
return(response)
}, error = function(e) {
cat("\n!!! ERROR !!!\n")
cat("Error message:", conditionMessage(e), "\n")
print(e)
cat("!!! END ERROR !!!\n\n")
res$status <- 500
return(list(
error = conditionMessage(e),
timestamp = as.character(Sys.time())
))
})
return(result)
}- 1
-
Parse JSON
- 2
-
Prep data (convert strings to factors)
- 3
-
Make prediction with
predict()using thevetivermodel andprep_data
- 4
-
Handle different return types from
vetiver
- 5
- Error handling
The diagram below outlines the sequence from the Client request to the plumber API, the handle_predict() and prep_pred_data() functions, and the response from the vetiver API:
%%{init: {'theme': 'neutral', 'look': 'handDrawn', 'themeVariables': { 'fontFamily': 'monospace', "fontSize":"18px"}}}%%

sequenceDiagram

    participant Client
    participant API as plumber<br>API
    participant Handler as handle_predict()
    participant Helper as prep_pred_data()
    participant VetiverObj as vetiver<br>model (v)

    Client->>API: POST /predict<br/>Body: {bill_length_mm, species, sex}
    activate API

    API->>Handler: Execute<br>function
    activate Handler

    Handler->>Handler: Parse JSON<br>from req$postBody

    Handler->>Handler: Convert to<br>data.frame<br>(if needed)

    Handler->>Helper: prep_pred_data(body)
    activate Helper
    Helper->>Helper: Convert strings<br>to factors
    Helper-->>Handler: Return prepared<br>data
    deactivate Helper

    Handler->>VetiverObj: predict(v, pred_data)
    activate VetiverObj
    VetiverObj->>VetiverObj: Run model<br>prediction
    VetiverObj-->>Handler: Return<br>prediction
    deactivate VetiverObj

    Handler->>Handler: Format response:<br/>{.pred = prediction}

    Handler-->>API: {.pred: [value]}
    deactivate Handler

    API-->>Client: 200 OK + JSON
    deactivate API
When launched, the API lists the endpoints and documentation:
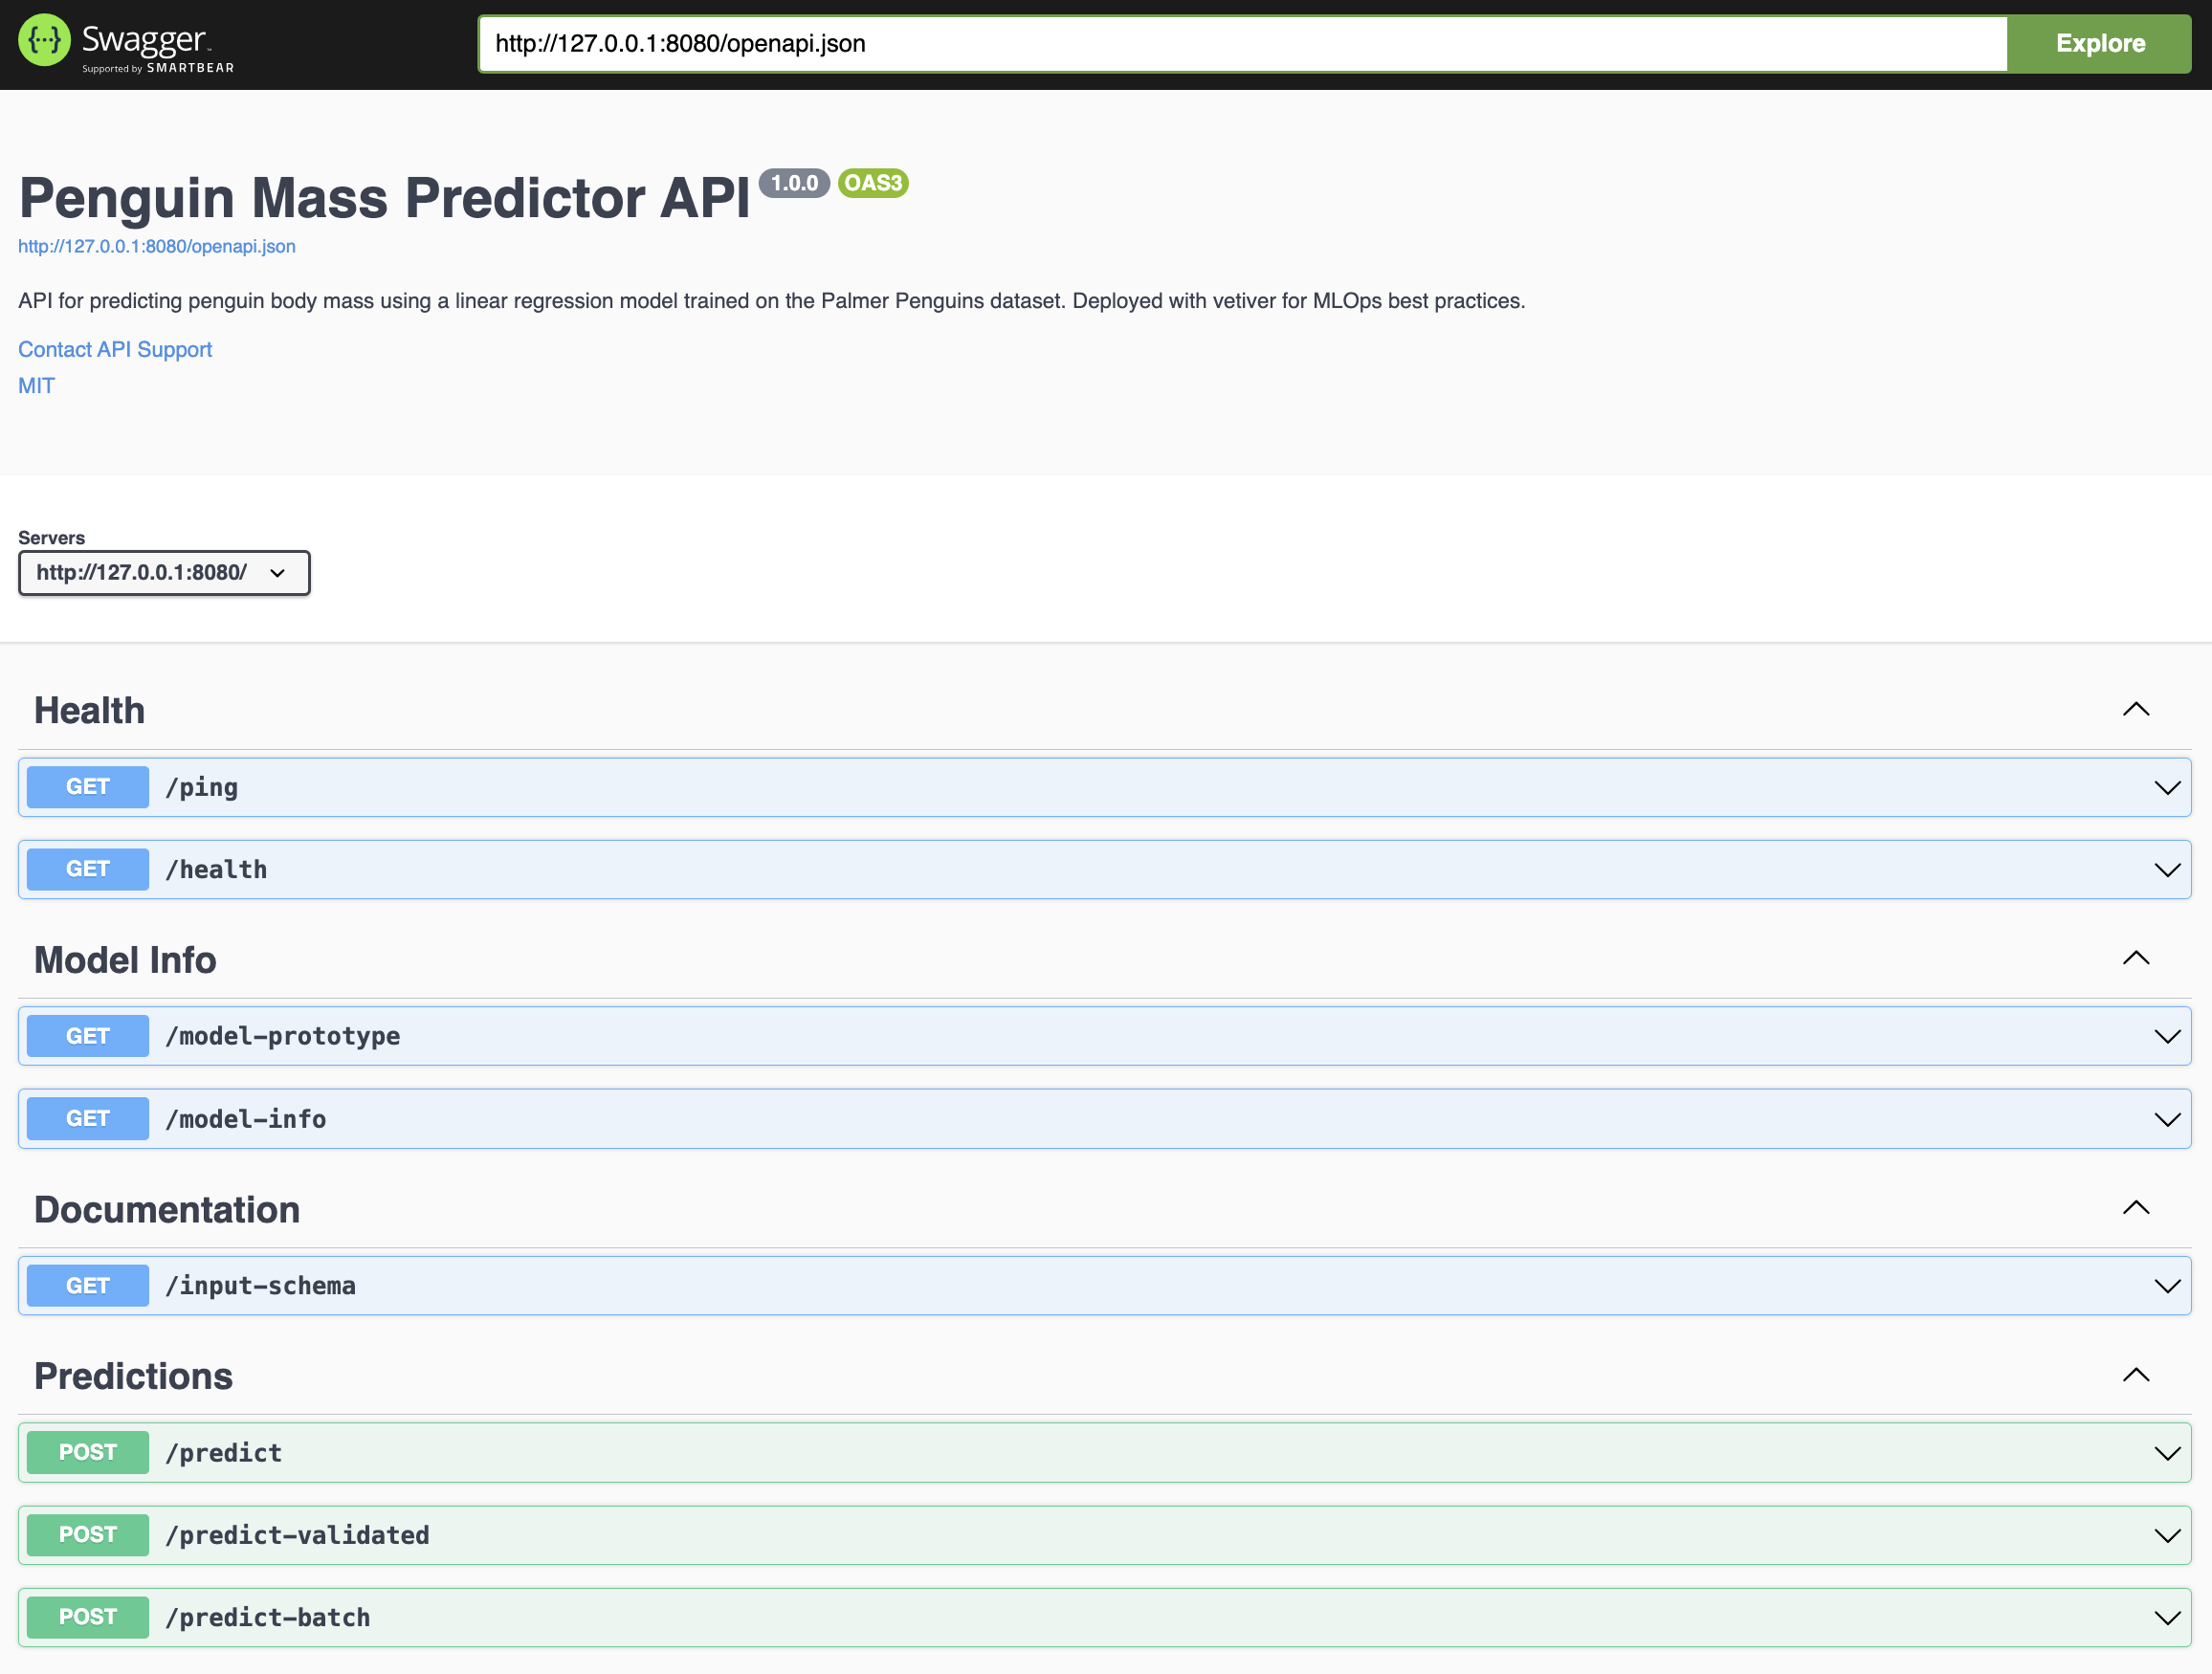
The shiny app below will access two of these endpoints (/health and /predict).
The Shiny App
The Shiny app we’ll use is one I developed for the following chapter on logging and monitoring.6
R/
├── app.R
├── R.Rproj
├── README.md
├── renv/
├── renv.lock
└── shiny_app.log
The UI is built using bslib and a few custom HTML functions with basic CSS styling.
The application server is going to be making API calls, so we’ll be using httr2 to make requests and logger to monitor the application behaviors and API requests.
Logging
Logging is configured with logger’s:
log_threshold()sets the default log level (set to"INFO")
log_appender()andappender_tee()specify the log file (shiny_app.log)
log_formatter()determines the format of the logs.
logger::log_threshold(level = "INFO")
logger::log_appender(appender = appender_tee(file = "shiny_app.log"))
logger::log_formatter(logger::formatter_glue_or_sprintf)
URL
We set the api_url to an internal location with port 8080 and the /predict endpoint:
api_url <- "http://127.0.0.1:8080/predict"App start up
In the server, the session$token and session$clientData$url_hostname values are included in the log using the priority argument in observe() (higher values have higher priority).
observe({
logger::log_info(
"Shiny app started - Session: {session$token} - Host: {session$clientData$url_hostname}"
)
}, priority = 1000)- 1
- log app startup is set to a high priority
User interactions
The user inputs are also included in the logs using throttle, which “delays invalidation if the throttled reactive recently (within the time window) invalidated.”7
observe({
logger::log_debug(
"User input changed - Session: {session$token} - bill_length: {input$bill_length} - species: {input$species} - sex: {input$sex}"
)
}) |>
throttle(2000)- 1
- User interactions are throttled
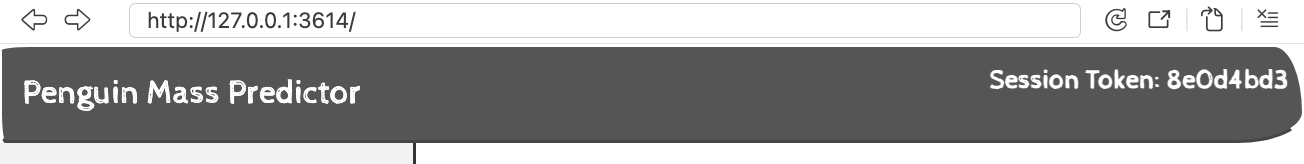
Session token
We’ll display the session token in the upper-right corner of the UI. This can be used for debugging (or to reference for testing).

UI
A div() is useful here because we want the token to be visible (but not distracting from the primary functions of the app).
  div(
    style = "position: fixed; top: 10px; right: 10px; z-index: 1000; color: #fff;",
    strong("Session",
      textOutput("log_status", inline = TRUE)
      )
  )
Server
The output for the session token is rendered using a subset of session$token and renderText():
output$log_status <- renderText({
paste("Token:", substr(session$token, 1, 8))
})- 1
- Token display
In the Console, we see the entire session$token:
INFO [2025-12-23 23:59:52] Shiny application initialized - timestamp: 2025-12-23
23:59:52.776227 - r_version: R version 4.5.2 (2025-10-31)
INFO [2025-12-23 23:59:54] Shiny app started -
Session: 936742bee2eded243ac80768f4953359 - Host: localhost
In the UI, we see:
API health check
When the application is launched, we want to perform a GET request to the /health endpoint to make sure the API is available to make predictions.
UI
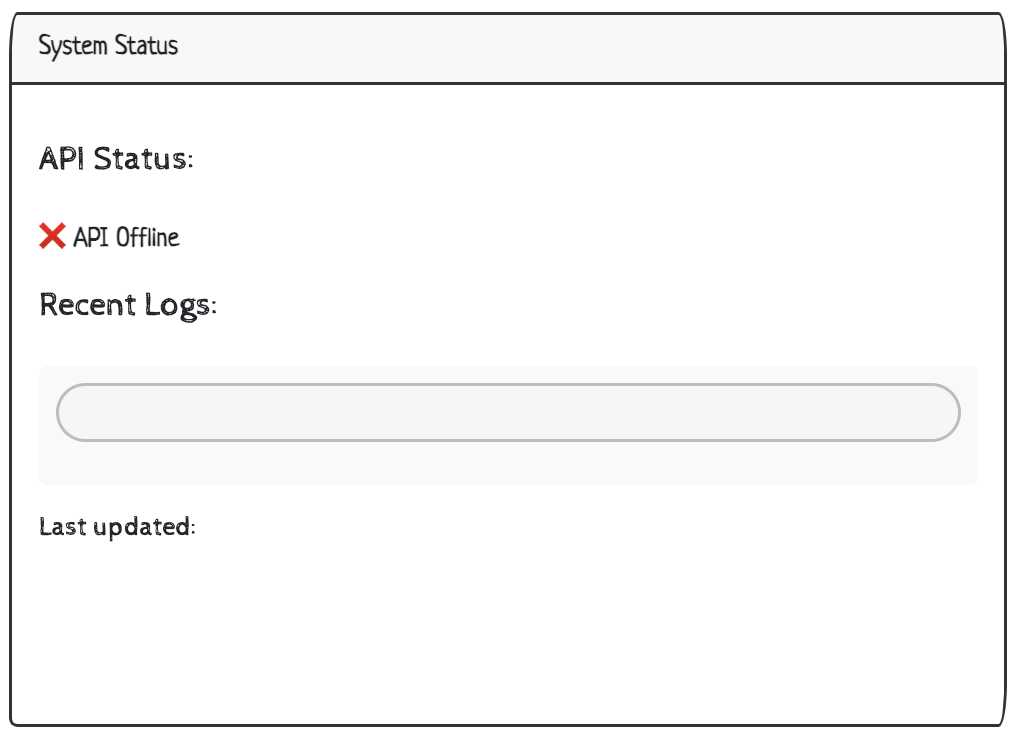
The response from the /health endpoint is displayed under a System Status section using a simple textOutput():
card_body(
    h5("API Status:"),
    textOutput("api_health")
    # ...
  )
Server
The initial ping (health check) is sent using a httr2 pipeline:
request(): include the API url with the/pingendpoint
req_timeout(): set the timeout to5(seconds)
req_perform(): perform the request
# ping
api_health <- reactive({
tryCatch({
logger::log_debug("Checking API health - Session: {session$token}")
response <- httr2::request("http://127.0.0.1:8080/ping") |>
httr2::req_timeout(5) |>
httr2::req_perform()
if (httr2::resp_status(response) == 200) {
logger::log_info("API health check successful - Session: {session$token}")
return("✅ API Online")
} else {
logger::log_warn(
"API health check returned non-200 status - Session: {session$token} - status: {httr2::resp_status(response)}"
)
return("⚠️ API Issues")
}
}, error = function(e) {
logger::log_error(
"API health check failed - Session: {session$token} - error: {conditionMessage(e)}"
)
return("❌ API Offline")
})
})
# display
output$api_health <- renderText({
api_health()
})- 1
-
Perform request safely
- 2
-
Include the
base_urlto create thehttr2request object
- 3
-
Set time limit (before error is returned)
- 4
-
Perform the request
- 5
-
Check request for
200withresponse - 6
-
Warn if non-
200is returned withresponse
- 7
-
Fall back safely to error messages
- 8
- Display API health check response
The Console displays the successful health check status:
INFO [2025-12-23 06:43:30] API health check successful -
Session: 8e0d4bd326098f9c2d2d01aeaab6b1db
Or failed health check status:
ERROR [2025-12-24 00:33:30] API health check failed -
Session: da3df1b7975e953612eb6f2d552f1c06 - error: Failed to perform HTTP
request.
Caused by error in `curl::curl_fetch_memory()`:
! Could not connect to server [127.0.0.1]:
Failed to connect to 127.0.0.1 port 8080 after 3 ms: Could not connect to
server
If the API is offline:
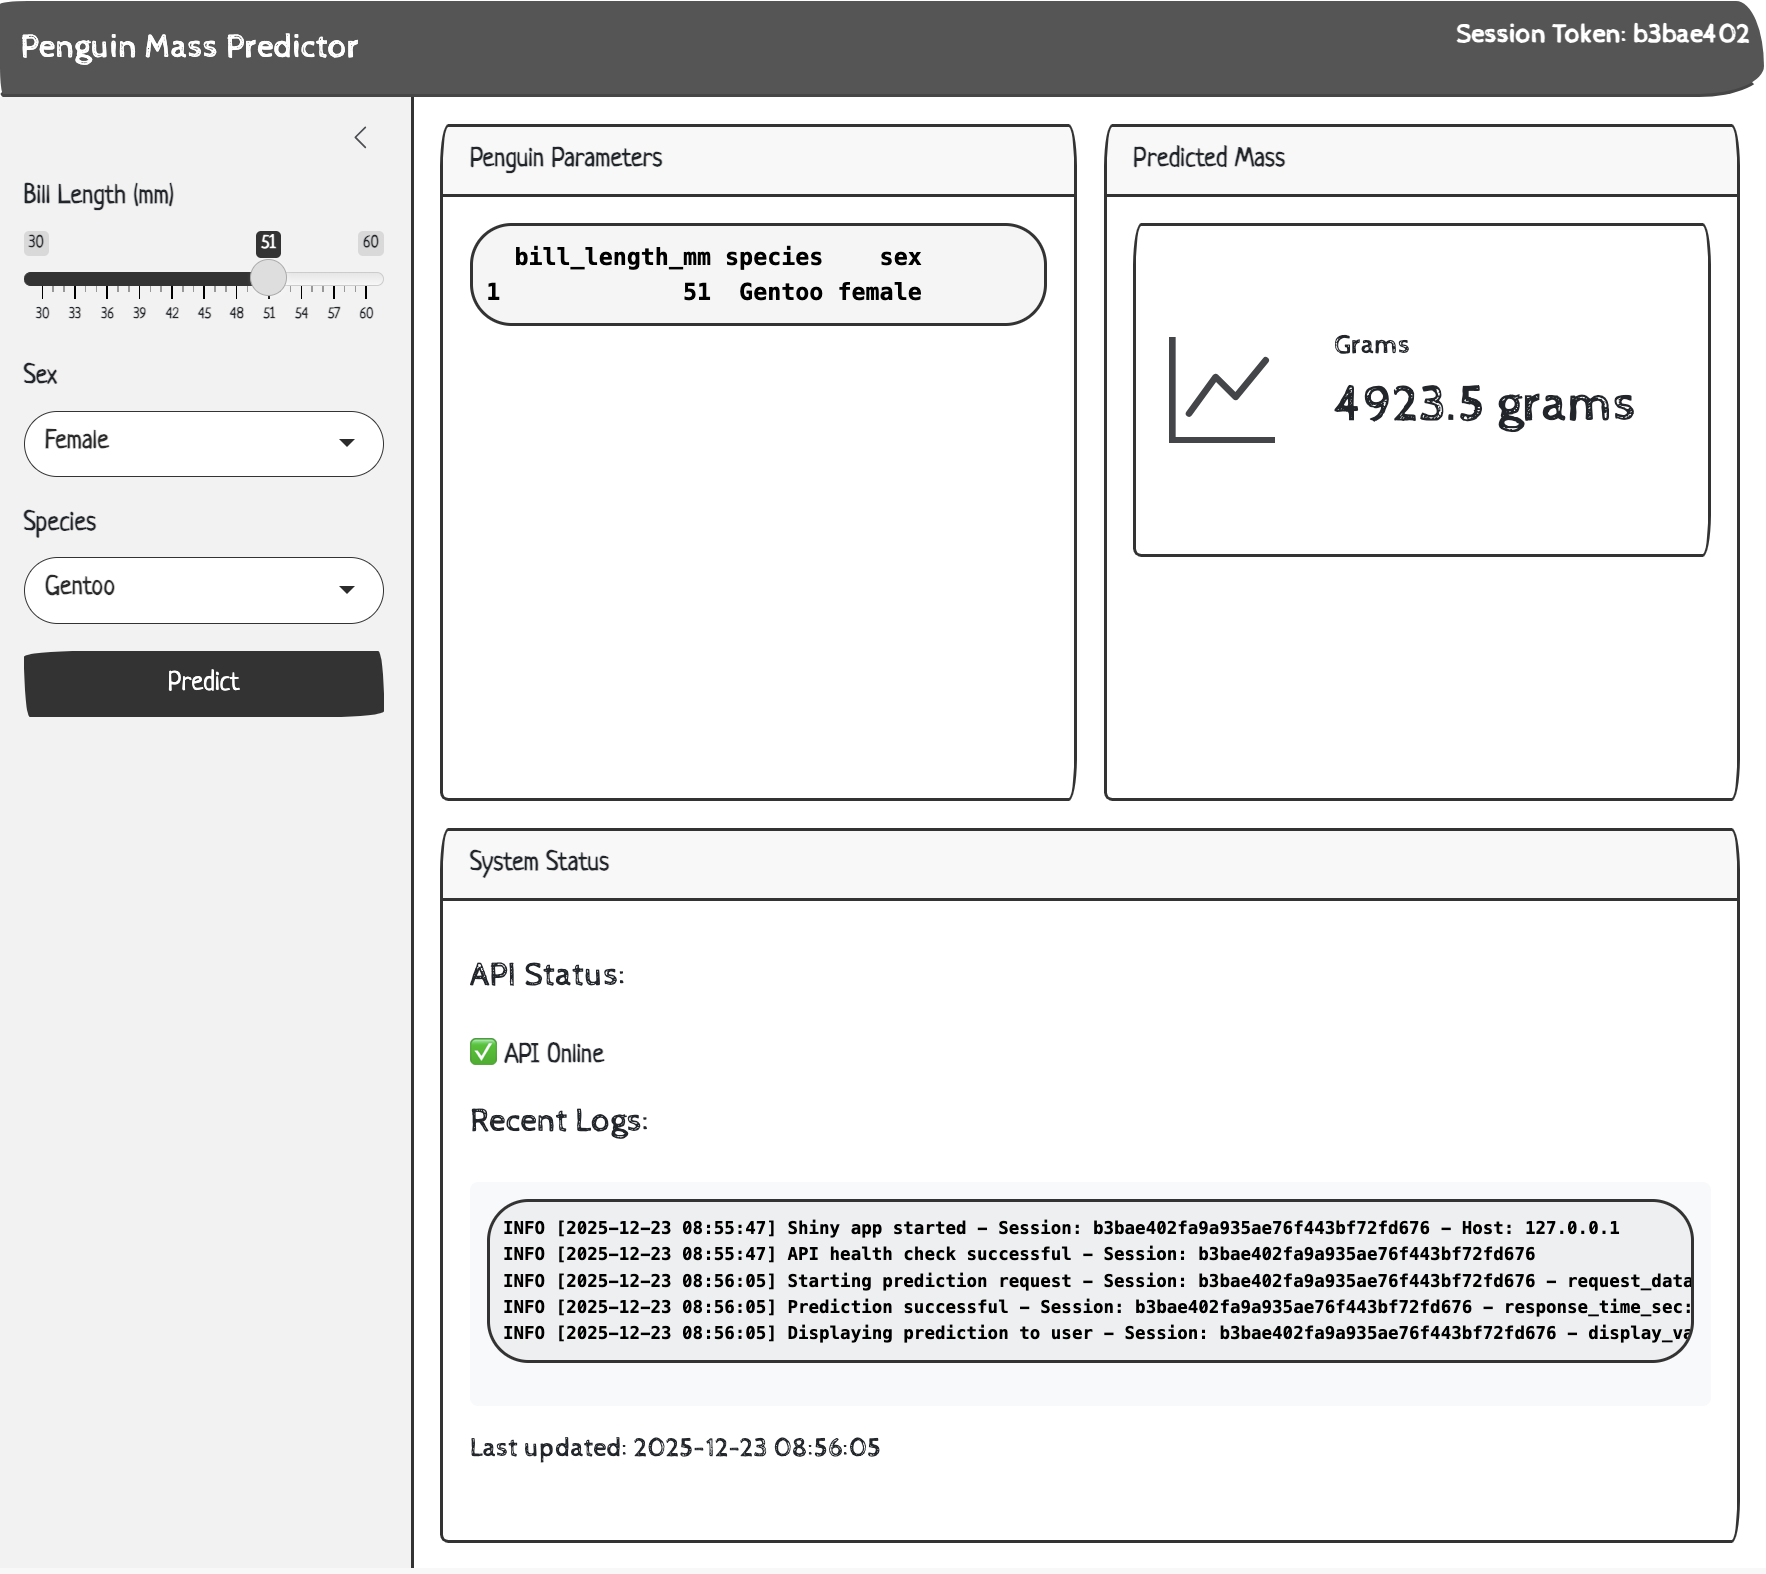
If the API is online:

Predictions
The API has multiple options for making predictions, but we’re going to focus on the /predict endpoint because it’s relatively straightforward to implement in our application.
UI
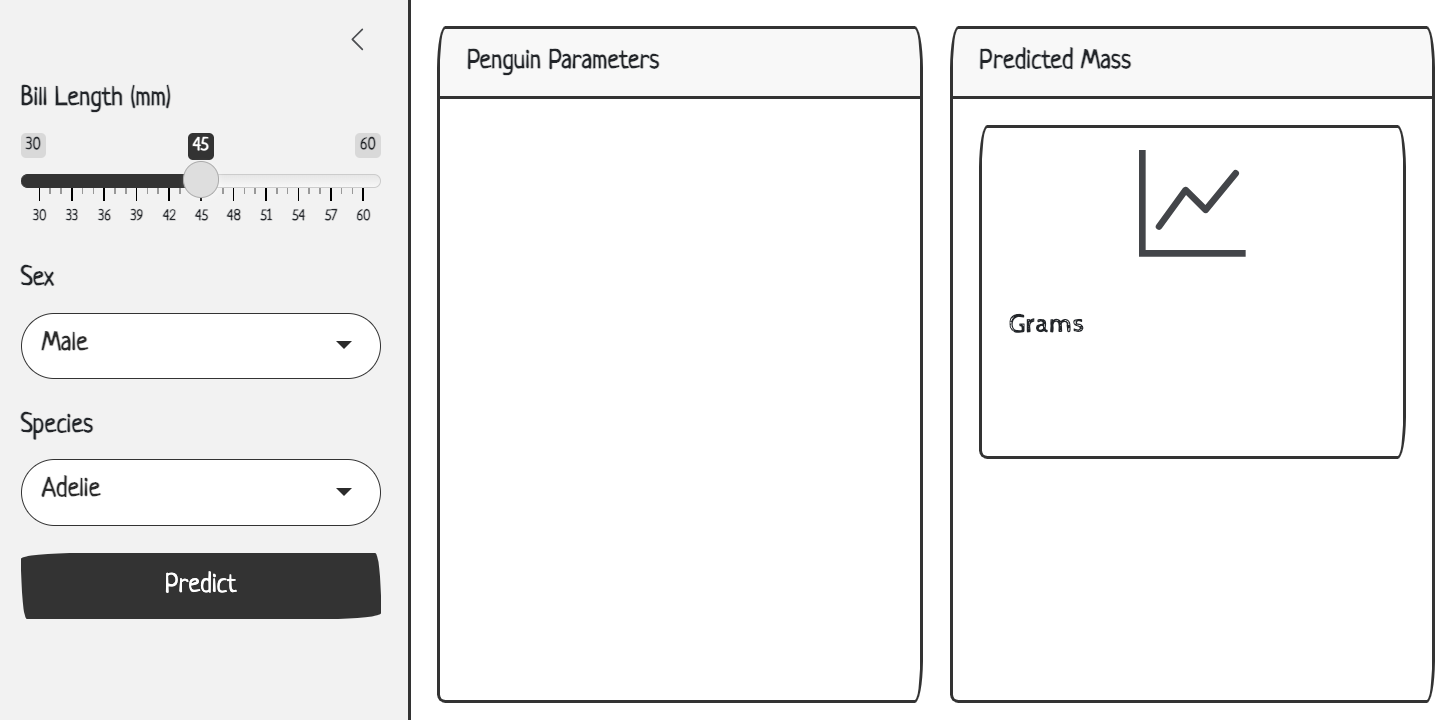
The model inputs and display in the sidebar (using the values we know are in the subset of penguins data we used to build the model).
sidebar = sidebar(
sliderInput(
inputId = "bill_length",
label = "Bill Length (mm)",
min = 30,
max = 60,
value = 45,
step = 1
),
selectInput(
inputId = "sex",
label = "Sex",
choices = c("Male", "Female"),
selected = "Male"
),
selectInput(
inputId = "species",
label = "Species",
choices = c("Adelie", "Chinstrap", "Gentoo"),
selected = "Adelie"
),
actionButton(
inputId = "predict",
label = "Predict",
class = "btn-primary"
)
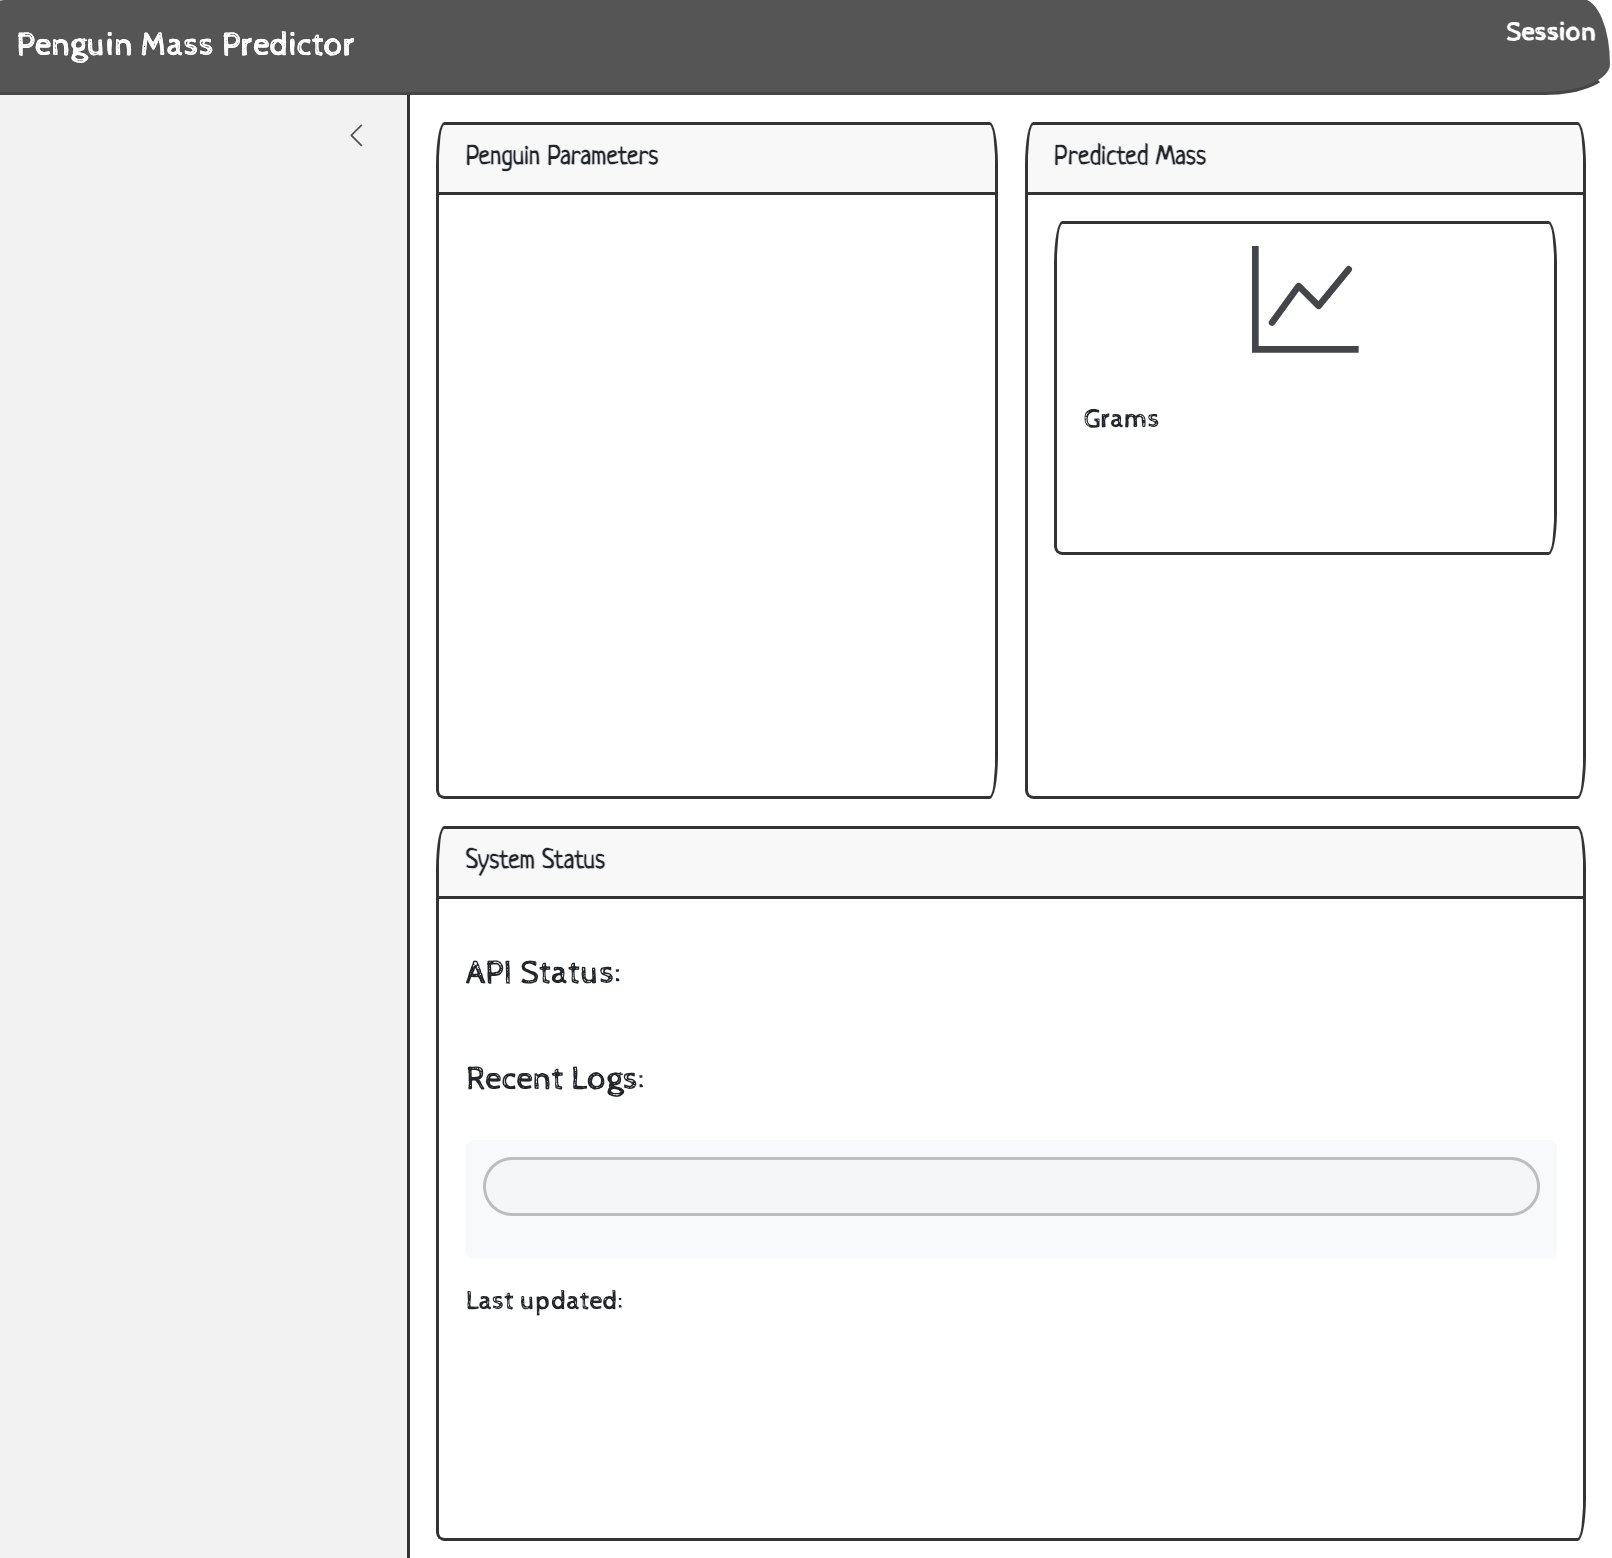
)The prediction results are returned along with a display of the reactive values in the server. This gives us an idea of the data format in the application before it’s sent off to the API.
card(
  card_header("Penguin Parameters"),
  card_body(
    verbatimTextOutput(outputId = "vals")
  )
)
The predicted mass is displayed in a value_box() with a textOutput():
card(
  card_header("Predicted Mass"),
  card_body(
    value_box(
      showcase_layout = "left center",
      title = "Grams",
      value = textOutput(outputId = "pred"),
      showcase = bs_icon("graph-up"),
      max_height = "200px",
      min_height = "200px"
    )
  )
)
Server
In the server, the reactive value are collected, converted to a data.frame, and displayed in a plain-text format.
# values
vals <- reactive({
bill_length <- input$bill_length
species <- input$species
sex <- input$sex
if (bill_length < 30 || bill_length > 60) {
logger::log_warn(
"Bill length out of typical range - Session: {session$token} - bill_length: {bill_length}"
)
}
if (is.null(species) || is.null(sex)) {
logger::log_error(
"Missing required inputs - Session: {session$token} - species_null: {is.null(species)} - sex_null: {is.null(sex)}"
)
return(NULL)
}
data <- data.frame(
bill_length_mm = bill_length,
species = species,
sex = tolower(sex)
)
logger::log_debug(
"Input data prepared - Session: {session$token} - data: {jsonlite::toJSON(data, auto_unbox = TRUE)}"
)
return(data)
})
# display
output$vals <- renderPrint({
data <- vals()
if (!is.null(data)) {
logger::log_debug("Displaying input values to user - Session: {session$token}")
return(data)
} else {
return("Invalid inputs")
}
})- 1
-
Reactive values from inputs
- 2
- Inputs (bill_length, species, and sex)
- 3
-
Input validation
- 4
-
Prepare data
- 5
-
Log prepared data (for debugging)
- 6
- Display structure of inputs
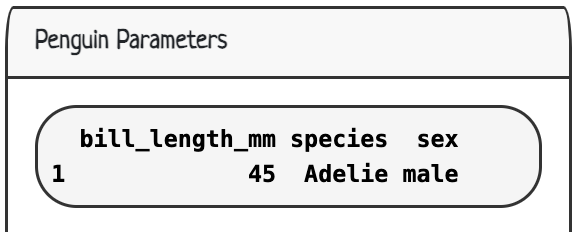
In the UI, we can see the default values displayed as a data.frame:
If a user changes the inputs, the reactive values will also update. To make a prediction, we click the Predict button with the selected inputs.
# prediction
pred <- reactive({
request_start <- Sys.time()
request_data <- vals()
if (is.null(request_data)) {
logger::log_error(
"Cannot make prediction with invalid inputs - Session: {session$token}"
)
return("❌ Invalid inputs")
}
logger::log_info(
"Starting prediction request - Session: {session$token} - request_data: {jsonlite::toJSON(request_data, auto_unbox = TRUE)}"
)
tryCatch({
showNotification(
"Predicting penguin mass...",
type = "default",
duration = 3
)
response <- httr2::request(api_url) |>
httr2::req_method("POST") |>
httr2::req_body_json(request_data, auto_unbox = FALSE) |>
httr2::req_timeout(30) |>
httr2::req_perform()
response_time <- as.numeric(
difftime(Sys.time(), request_start, units = "secs")
)
response_data <- httr2::resp_body_json(response)
prediction_value <- if (is.list(response_data$.pred)) {
as.numeric(response_data$.pred[[1]])
} else {
as.numeric(response_data$.pred[1])
}
logger::log_info(
"Prediction successful - Session: {session$token} - response_time_sec: {round(response_time, 3)} - prediction: {prediction_value}"
)
if (response_time > 5) {
logger::log_warn(
"Slow API response - Session: {session$token} - response_time_sec: {response_time}"
)
}
showNotification(
"✅ Prediction successful!",
type = "message",
duration = 3
)
return(prediction_value)
}, error = function(e) {
error_msg <- conditionMessage(e)
response_time <- as.numeric(
difftime(Sys.time(), request_start, units = "secs")
)
logger::log_error(
"Prediction request failed - Session: {session$token} - error: {error_msg} - response_time_sec: {round(response_time, 3)}"
)
if (grepl("Connection refused|couldn't connect", error_msg, ignore.case = TRUE)) {
user_msg <- "API not available - is the server running on port 8080?"
logger::log_error("API connection refused - Session: {session$token}")
} else if (grepl("timeout|timed out", error_msg, ignore.case = TRUE)) {
user_msg <- "Request timed out - API may be overloaded"
logger::log_warn("API timeout occurred - Session: {session$token}")
} else {
user_msg <- paste("API Error:", substr(error_msg, 1, 50))
logger::log_error(
"Unknown API error - Session: {session$token} - error: {error_msg}"
)
}
showNotification(
paste("❌", user_msg),
type = "error",
duration = 5
)
return(paste("❌", user_msg))
})
}) |>
bindEvent(input$predict, ignoreInit = TRUE)
# outputs ----
output$pred <- renderText({
prediction <- pred()
if (is.numeric(prediction)) {
result <- paste(round(prediction, 1), "grams")
logger::log_info(
"Displaying prediction to user - Session: {session$token} - display_value: {result}"
)
return(result)
} else {
logger::log_debug(
"Displaying error message to user - Session: {session$token} - message: {prediction}"
)
return(as.character(prediction))
}
})- 1
-
Create reactive for predictions
- 2
-
Request start time
- 3
-
Request data converted to
request_data
- 4
-
Log error for invalid inputs
- 5
-
Log prediction being sent to API
- 6
-
Safely perform request
- 7
-
Notification for starting prediction
- 8
-
Perform
POSTrequest usingrequest_data
- 9
-
Create response time
- 10
-
Convert data to JSON
- 11
-
Extract prediction - handle different response formats
- 12
-
Log successful prediction
- 13
-
Performance monitoring
- 14
-
Notification for successful prediction
- 15
-
Return predicted value
- 16
-
Construct and display error message
- 17
-
Construct API response time
- 18
-
Log prediction request error
- 19
-
Log connection refused error
- 20
-
Log timeout error
- 21
- Log unknown API error
- 22
-
Notification for failed prediction
- 23
-
Error for failed prediction
- 24
-
Bind to
actionButton()input - 25
-
Create prediction from reactive
pred()
- 26
-
Format successful prediction for display
- 27
- Log unsuccessful prediction
In the Console, we see the following:
INFO [2025-12-23 08:32:56] Starting prediction request -
  Session: 8e0d4bd326098f9c2d2d01aeaab6b1db -
  request_data: [{"bill_length_mm":51,"species":"Gentoo","sex":"female"}]
INFO [2025-12-23 08:32:56] Prediction successful -
  Session: 8e0d4bd326098f9c2d2d01aeaab6b1db -
  response_time_sec: 0.293 - prediction: 4923.5183
INFO [2025-12-23 08:32:56] Displaying prediction to user -
  Session: 8e0d4bd326098f9c2d2d01aeaab6b1db -
  display_value: 4923.5 grams
In the UI, we see the following:

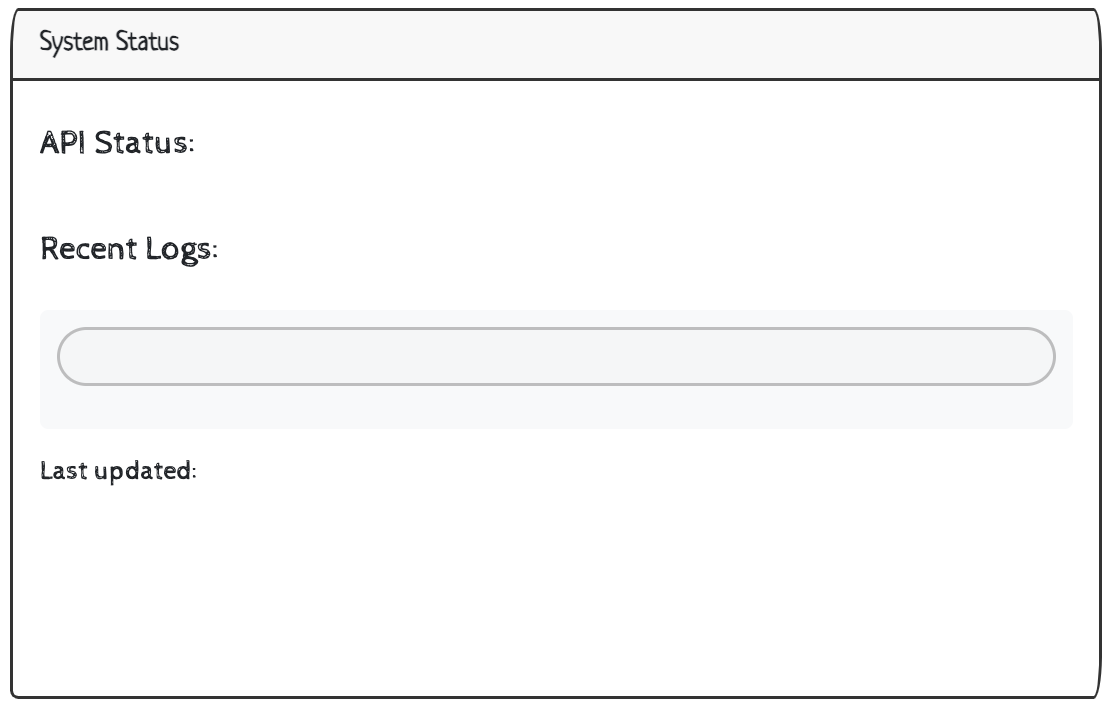
Logs
The System Status section includes a reactive display of the log file (recent_logs) and a timestamp for the last time the application was run (log_timestamp).
UI
h5("Recent Logs:"),
  div(
    style = "font-family: 'Ubuntu Mono', monospace; font-size: 12px; background-color: #f8f9fa; padding: 10px; border-radius: 5px;",
    verbatimTextOutput("recent_logs", placeholder = TRUE)
  ),
h6("Last updated:",
    textOutput("log_timestamp", inline = TRUE)
  )
Server
The logs are created using reactiveFileReader() and the log file (shiny_app.log) to update the display in the UI. This is a handy way of viewing the log outputs in the UI (without having to open the log file).
The final output is the timestamp.
# log file
log_file_content <- reactiveFileReader(
intervalMillis = 1000,
session = session,
filePath = "shiny_app.log",
readFunc = function(filePath) {
if (file.exists(filePath)) {
lines <- readLines(filePath, warn = FALSE)
mod_time <- file.mtime(filePath)
list(
lines = lines,
last_mod = mod_time,
total_lines = length(lines)
)
} else {
list(
lines = character(0),
last_mod = Sys.time(),
total_lines = 0
)
}
}
)
# display
output$recent_logs <- renderText({
log_data <- log_file_content()
if (length(log_data$lines) > 0) {
recent_lines <- if (log_data$total_lines > 5) {
tail(log_data$lines, 5)
} else {
log_data$lines
}
logger::log_debug(
"Updating recent logs display - Session: {session$token} - showing {length(recent_lines)} lines"
)
paste(recent_lines, collapse = "\n")
} else {
"No logs available"
}
})
output$log_timestamp <- renderText({
log_data <- log_file_content()
format(log_data$last_mod, "%Y-%m-%d %H:%M:%S")
})- 1
-
Reactive file reader for log monitoring
- 2
-
The
shiny_app.logfile we specified in the log configuration
- 3
-
Return as list
- 4
-
Create
log_dataobject
- 5
-
Only return the top five lines of the log file
- 6
-
Log message for debugging log display
- 7
- Log timestamp
In the UI, we see the top 5 lines of the shiny_app.log file and the timestamp.

The app includes a log for the session ending, too:
INFO [2025-12-23 08:53:16] User session ended - Session: 5f61a8ce042d21d5e6a6702127f24946Recap
We’ve covered how to create a vetiver model (with duckdb) with plumber and access this API using a shiny app. The httr2 package is used to make API requests and logger is used throughout the application to log behaviors and actions.
Access the code for the API and app in my DO4DS: Lab Solutions.
Footnotes
DevOps for Data Science: Step 2: Point the EDA and modeling scripts to the database↩︎
DevOps for Data Science: Step 3: Build an app that calls the API↩︎
These files can also be found in this GitHub repo..↩︎
What is a RESTful API? Appsilon has a great tutorial on using
plumber. This is also a great tutorial (but is usescaretfor modeling).↩︎Read more in the Shiny documentation on debounce/throttle.↩︎