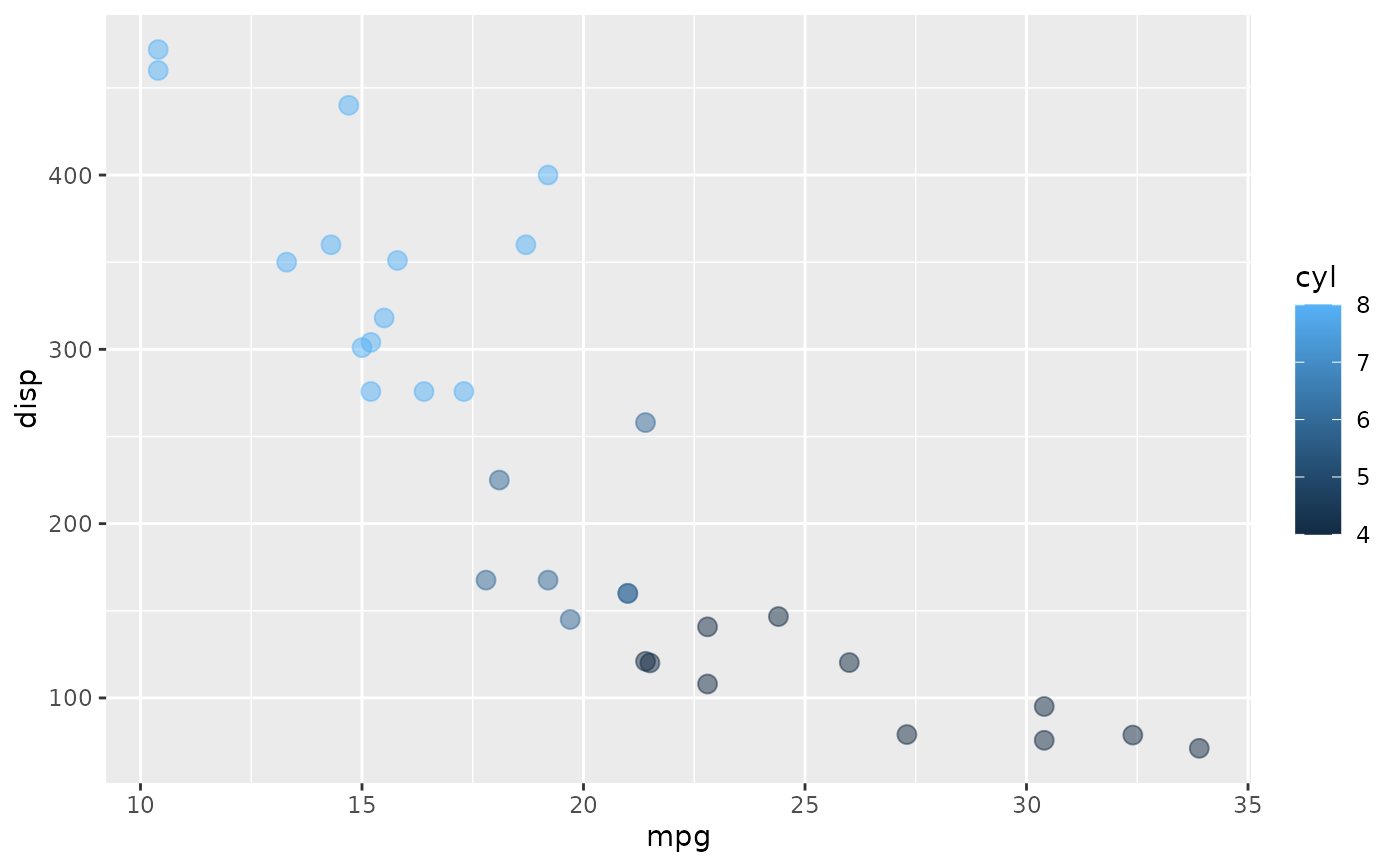
Create scatter plot
scatter_plot.RdCustom ggplot2 function for building
scatter plots in sap.
Arguments
- df
(data.frame) The dataset containing the variables to plot.
- x_var
(character) Name of the variable for the x-axis.
- y_var
(character) Name of the variable for the y-axis.
- col_var
(character) Name of the variable for the color aesthetic.
- alpha_var
(numeric) Transparency level of points (0 to 1).
- size_var
(numeric) Size of points.
Details
scatter_plot() is designed for use in Shiny applications but can also be
used independently.
It supports customization of transparency, size, and color aesthetics.
See also
mod_scatter_display_server()for integrating this function into the scatter plot module.ggplot2::ggplot()for details onggplot2usage.
Other Utility Functions:
log_message()