Scatter plots
scatter-plots.RmdBuilding scatter-plots
The graphs in tsap are built ‘layer-by-layer’, which
poses a problem for the module sequence:
mod_pkg > mod_ds >
mod_cols > mod_plot
In theory, this would work like so:
mod_pkg
# get packages with data.frames/tibbles
pkgs <- get_pkgs_with_dfs()
# select package with data.frames/tibbles
pkg <- pkgs["palmerpenguins"]
pkg
#>   palmerpenguins
#> "palmerpenguins"
The pkg is passed as a reactive to
mod_ds
mod_ds
# select dataset
ds <- get_pkg_df_names(pkg)[1]
# get dataset
pkg_data <- janitor::clean_names(get(x = ds, pos = paste0("package:", pkg)))
head(pkg_data)
#> # A tibble: 6 × 8
#>   species island    bill_length_mm bill_depth_mm flipper_length_mm body_mass_g
#>   <fct>   <fct>              <dbl>         <dbl>             <int>       <int>
#> 1 Adelie  Torgersen           39.1          18.7               181        3750
#> 2 Adelie  Torgersen           39.5          17.4               186        3800
#> 3 Adelie  Torgersen           40.3          18                 195        3250
#> 4 Adelie  Torgersen           NA            NA                  NA          NA
#> 5 Adelie  Torgersen           36.7          19.3               193        3450
#> 6 Adelie  Torgersen           39.3          20.6               190        3650
#> # ℹ 2 more variables: sex <fct>, year <int>
pkg_data is passed as a reactive to
mod_cols
mod_cols
mod_cols extracts the columns by type and
returns a reactive list of of plot_values
# get numeric x var
x_var <- pull_numeric_cols(pkg_data)[1]
# get numeric y var
y_var <- pull_numeric_cols(pkg_data)[2]
# get binary color var
col_var <- pull_binary_cols(pkg_data)[1]
# get facet var
facet_var <- pull_facet_cols(pkg_data)[1]
# set size
size <- 2L
# set alpha
alpha <- 0.75
# create list of plot_values
plot_values <- list(
  'df' = pkg_data,
  'x_var' = x_var,
  'y_var' = y_var,
  'col_var' = col_var,
  'facet_var' = facet_var,
  'size' = size,
  'alpha' = alpha
)
Plot values
The plot_values list is what’s returned from
mod_cols:
str(plot_values, list.len = 7)
#> List of 7
#>  $ df       : tibble [344 × 8] (S3: tbl_df/tbl/data.frame)
#>   ..$ species          : Factor w/ 3 levels "Adelie","Chinstrap",..: 1 1 1 1 1 1 1 1 1 1 ...
#>   ..$ island           : Factor w/ 3 levels "Biscoe","Dream",..: 3 3 3 3 3 3 3 3 3 3 ...
#>   ..$ bill_length_mm   : num [1:344] 39.1 39.5 40.3 NA 36.7 39.3 38.9 39.2 34.1 42 ...
#>   ..$ bill_depth_mm    : num [1:344] 18.7 17.4 18 NA 19.3 20.6 17.8 19.6 18.1 20.2 ...
#>   ..$ flipper_length_mm: int [1:344] 181 186 195 NA 193 190 181 195 193 190 ...
#>   ..$ body_mass_g      : int [1:344] 3750 3800 3250 NA 3450 3650 3625 4675 3475 4250 ...
#>   ..$ sex              : Factor w/ 2 levels "female","male": 2 1 1 NA 1 2 1 2 NA NA ...
#>   .. [list output truncated]
#>  $ x_var    : Named chr "bill_length_mm"
#>   ..- attr(*, "names")= chr "bill_length_mm"
#>  $ y_var    : Named chr "bill_depth_mm"
#>   ..- attr(*, "names")= chr "bill_depth_mm"
#>  $ col_var  : Named chr "sex"
#>   ..- attr(*, "names")= chr "sex"
#>  $ facet_var: Named chr "species"
#>   ..- attr(*, "names")= chr "species"
#>  $ size     : int 2
#>  $ alpha    : num 0.75
mod_plot
The plot_values list is then passed to
mod_plot, where the plot is rendered:
plot <- gg_color_scatter_facet(
  df = plot_values$df,
  x_var = plot_values$x_var,
  y_var = plot_values$y_var,
  col_var = plot_values$col_var,
  facet_var = plot_values$facet_var,
  size = plot_values$size,
  alpha = plot_values$alpha)
plot
#> Warning: Removed 2 rows containing missing values or values outside the scale range
#> (`geom_point()`).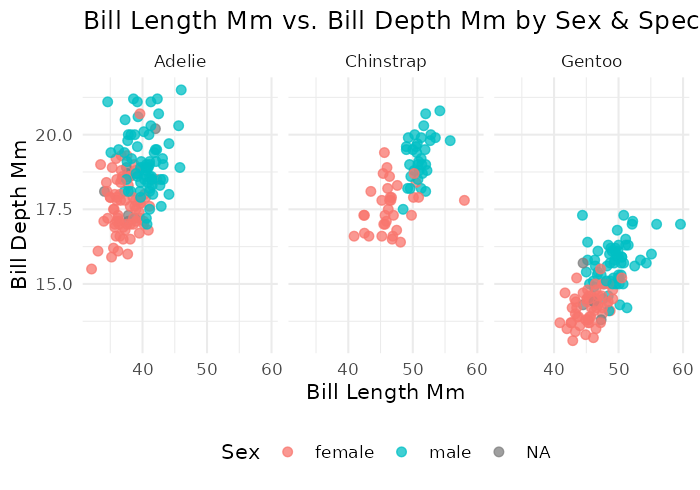
Error
When switching data sources (i.e.,
palmerpenguins::penguins_raw to
NHANES::NHANES), the graph in the application renders with
the following error:
# Warning: Error in [[: Column 'race1' not found in '.data'.
gg_color_scatter_facet(
  df = janitor::clean_names(palmerpenguins::penguins),
  x_var = "bill_length_mm",
  y_var = "bill_depth_mm",
  col_var = "sex",
  facet_var = "race1", # wrong facet variable
  alpha = 0.5,
  size = 2
)
#> Error in `.data[["race1"]]`:
#> ! Column `race1` not found in `.data`.
race1 is the facet_var from the previous graph
(NHANES), but it’s not getting flushed out with the rest of
the variables.
plot_values$facet_var
#>   species
#> "species"