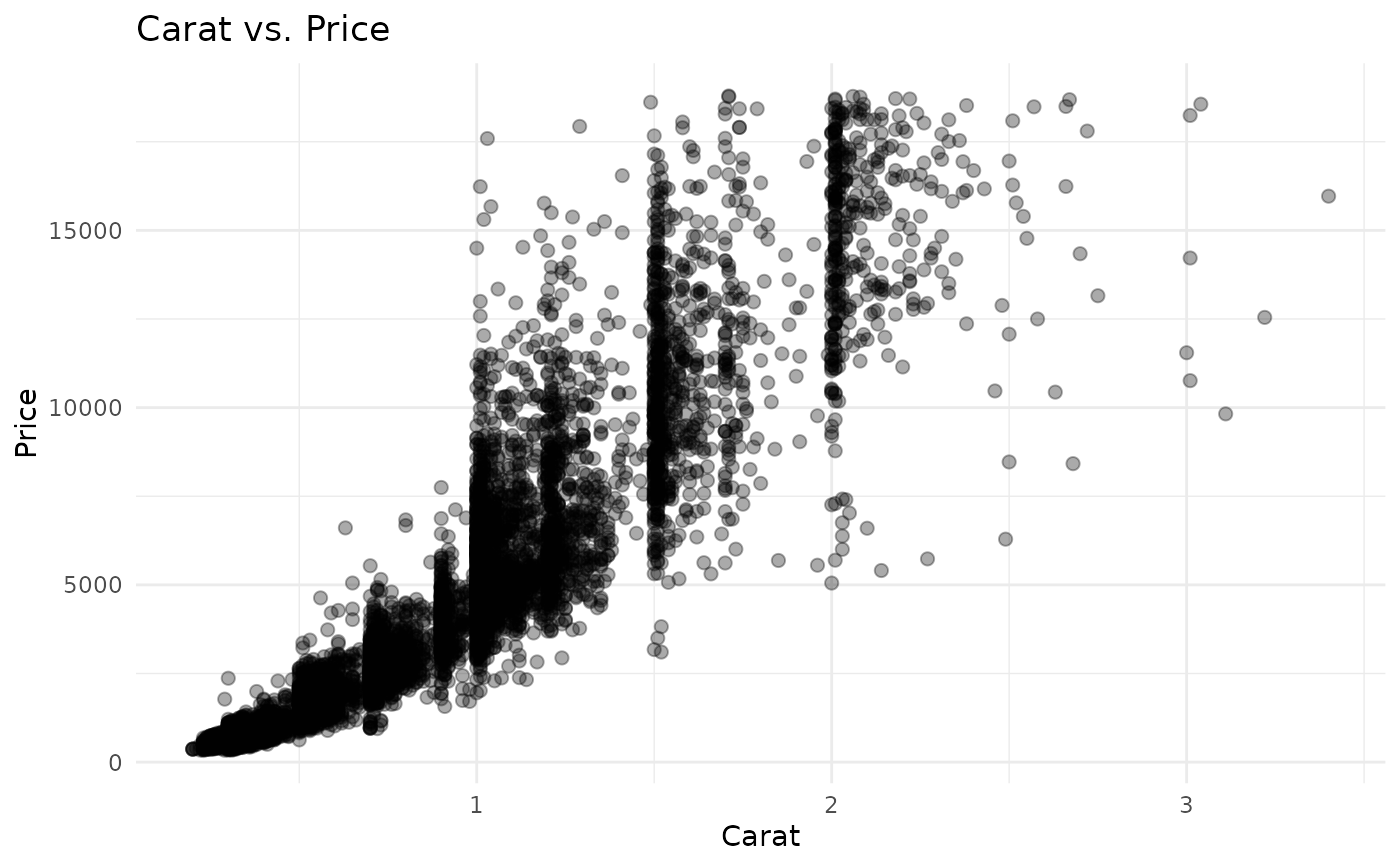
Point plot (scatter-plot)
gg_scatter.RdPoint plot (scatter-plot)
Arguments
- df
input dataset (tibble or data.frame)
- x_var
x variable (supplied to
ggplot2::aes(x = ))- y_var
y variable (supplied to
ggplot2::aes(y = ))- ...
other arguments passed to
ggplot2::geom_point(), outside ofggplot2::aes()