Colored point plot (scatter-plot) with facets
gg_scatter_color_facet.RdColored point plot (scatter-plot) with facets
Arguments
- df
input dataset (tibble or data.frame)
- x_var
x variable (supplied to
ggplot2::aes(x = ))- y_var
y variable (supplied to
ggplot2::aes(y = ))- col_var
color variable (supplied to
ggplot2::geom_point(ggplot2::aes(color = )))- facet_var
facet variable (supplied to
ggplot2::geom_point(ggplot2::aes(color = )))- ...
other arguments passed to (
ggplot2::facet_wrap(vars()))
Examples
diamonds <- ggplot2::diamonds
mini_dmnds <- diamonds[sample(nrow(diamonds), 10000), ]
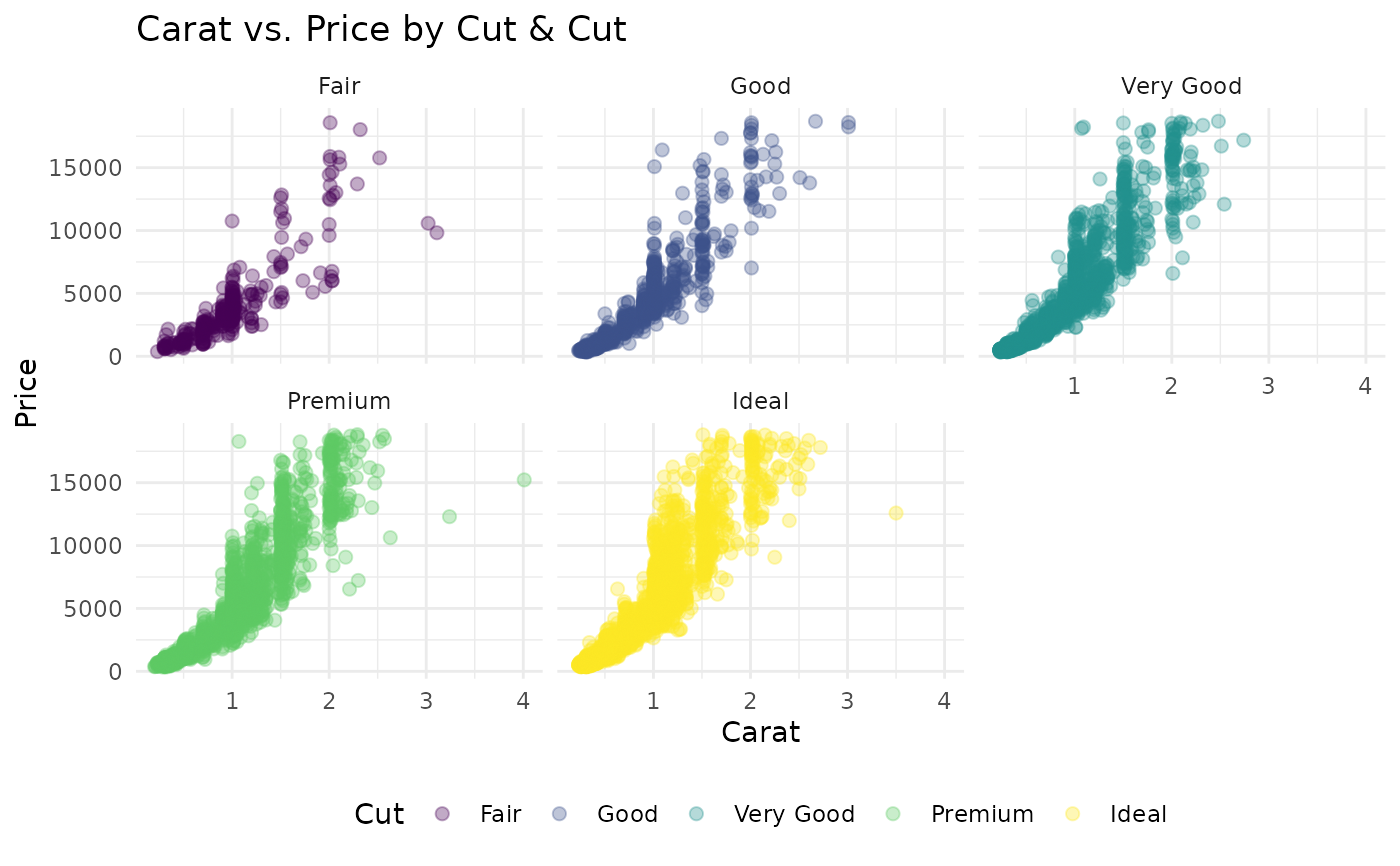
gg_scatter_color_facet(
df = mini_dmnds,
x_var = "carat",
y_var = "price",
col_var = "cut",
facet_var = "cut",
alpha = 1 / 3,
size = 2
)
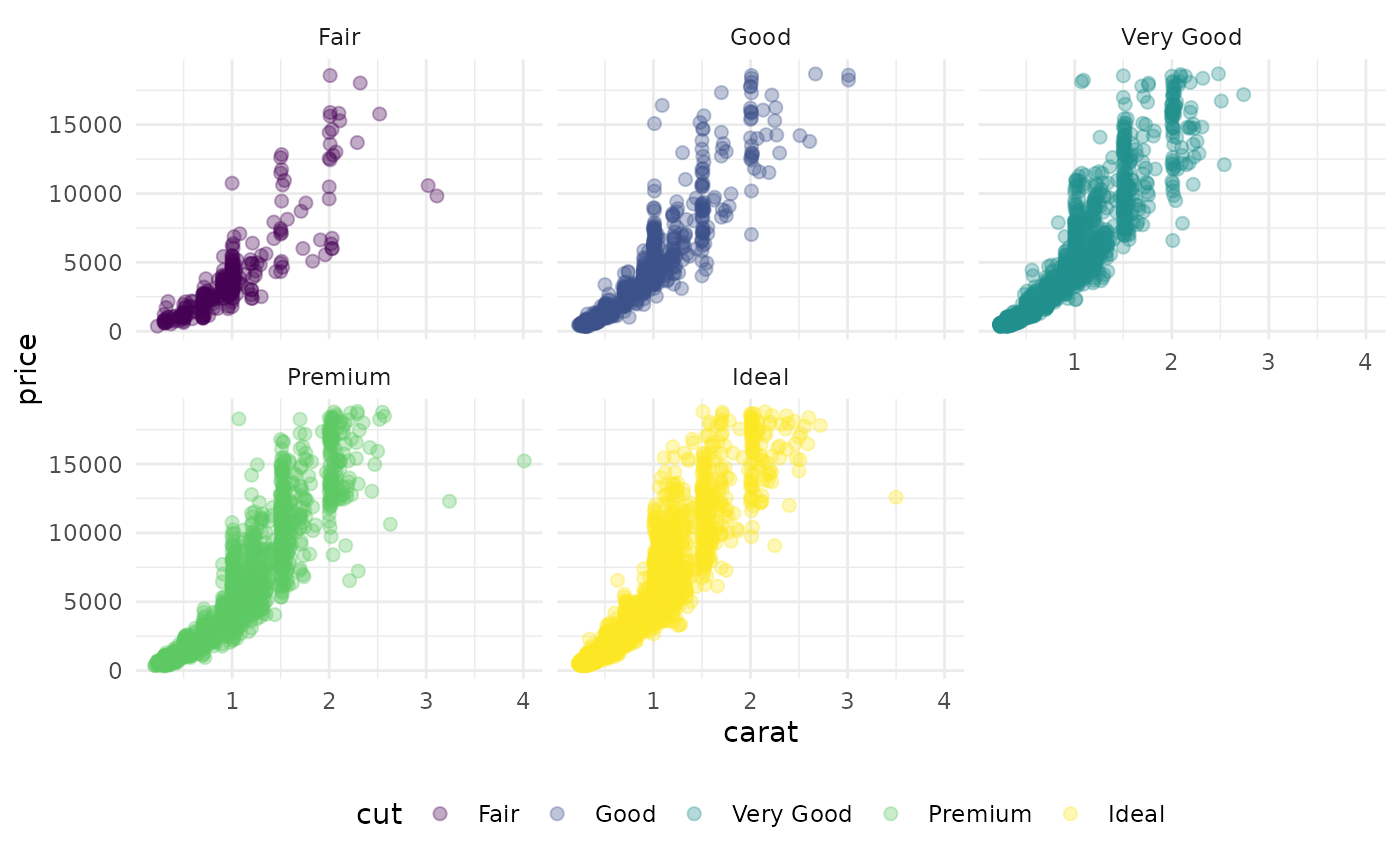
 # compare with
ggplot2::ggplot(
data = mini_dmnds,
mapping = ggplot2::aes(x = carat, y = price)
) +
ggplot2::geom_point(ggplot2::aes(color = cut, group = cut),
size = 2, alpha = 1 / 3
) +
ggplot2::facet_wrap(. ~ cut) +
ggplot2::theme_minimal() +
ggplot2::theme(legend.position = "bottom")
# compare with
ggplot2::ggplot(
data = mini_dmnds,
mapping = ggplot2::aes(x = carat, y = price)
) +
ggplot2::geom_point(ggplot2::aes(color = cut, group = cut),
size = 2, alpha = 1 / 3
) +
ggplot2::facet_wrap(. ~ cut) +
ggplot2::theme_minimal() +
ggplot2::theme(legend.position = "bottom")
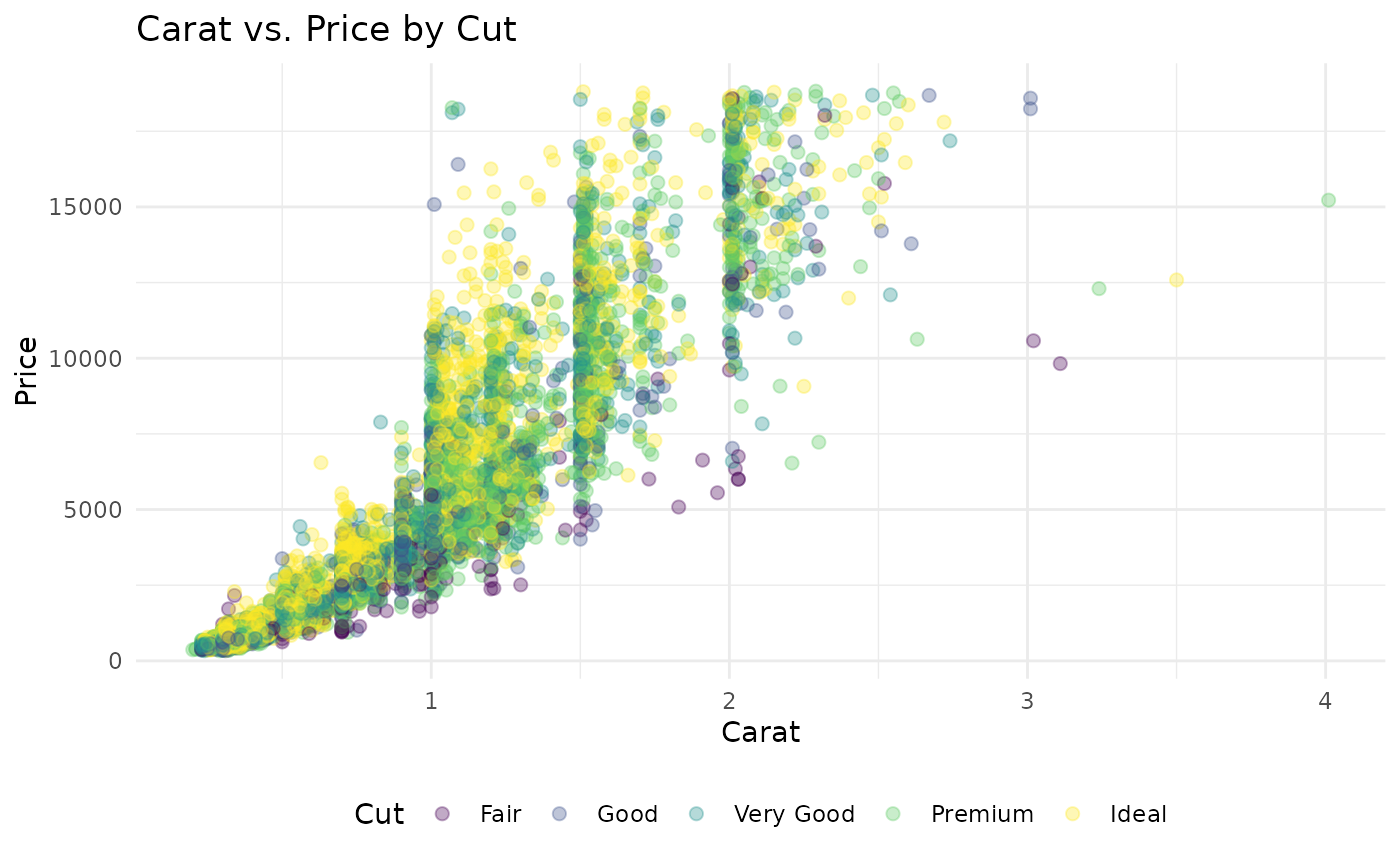
 gg_scatter_color_facet(
df = mini_dmnds,
x_var = "carat",
y_var = "price",
col_var = "cut",
facet_var = NULL,
alpha = 1 / 3,
size = 2
)
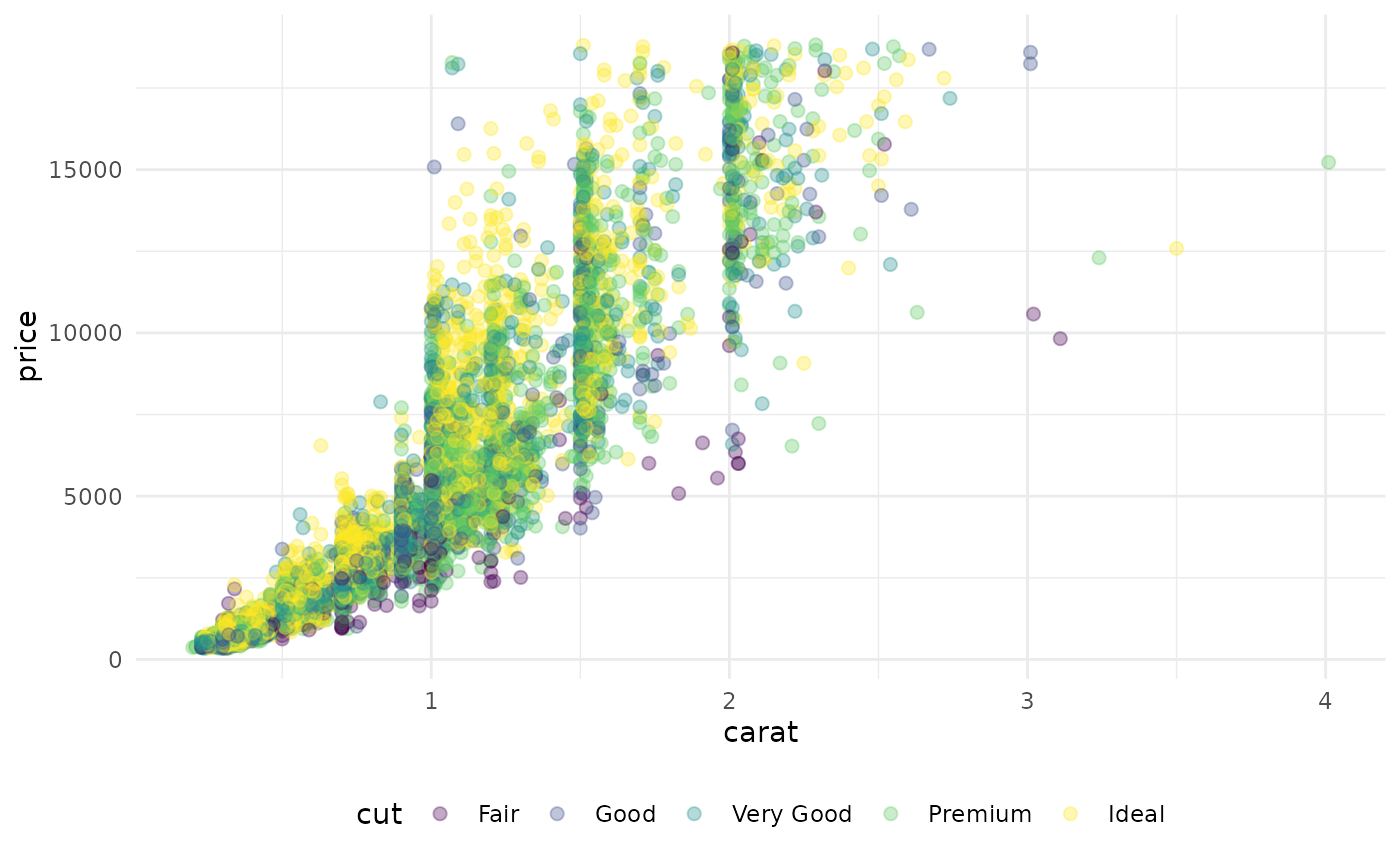
gg_scatter_color_facet(
df = mini_dmnds,
x_var = "carat",
y_var = "price",
col_var = "cut",
facet_var = NULL,
alpha = 1 / 3,
size = 2
)
 # compare with
ggplot2::ggplot(
data = mini_dmnds,
mapping = ggplot2::aes(x = carat, y = price)
) +
ggplot2::geom_point(ggplot2::aes(color = cut, group = cut),
size = 2, alpha = 1 / 3
) +
ggplot2::theme_minimal() +
ggplot2::theme(legend.position = "bottom")
# compare with
ggplot2::ggplot(
data = mini_dmnds,
mapping = ggplot2::aes(x = carat, y = price)
) +
ggplot2::geom_point(ggplot2::aes(color = cut, group = cut),
size = 2, alpha = 1 / 3
) +
ggplot2::theme_minimal() +
ggplot2::theme(legend.position = "bottom")
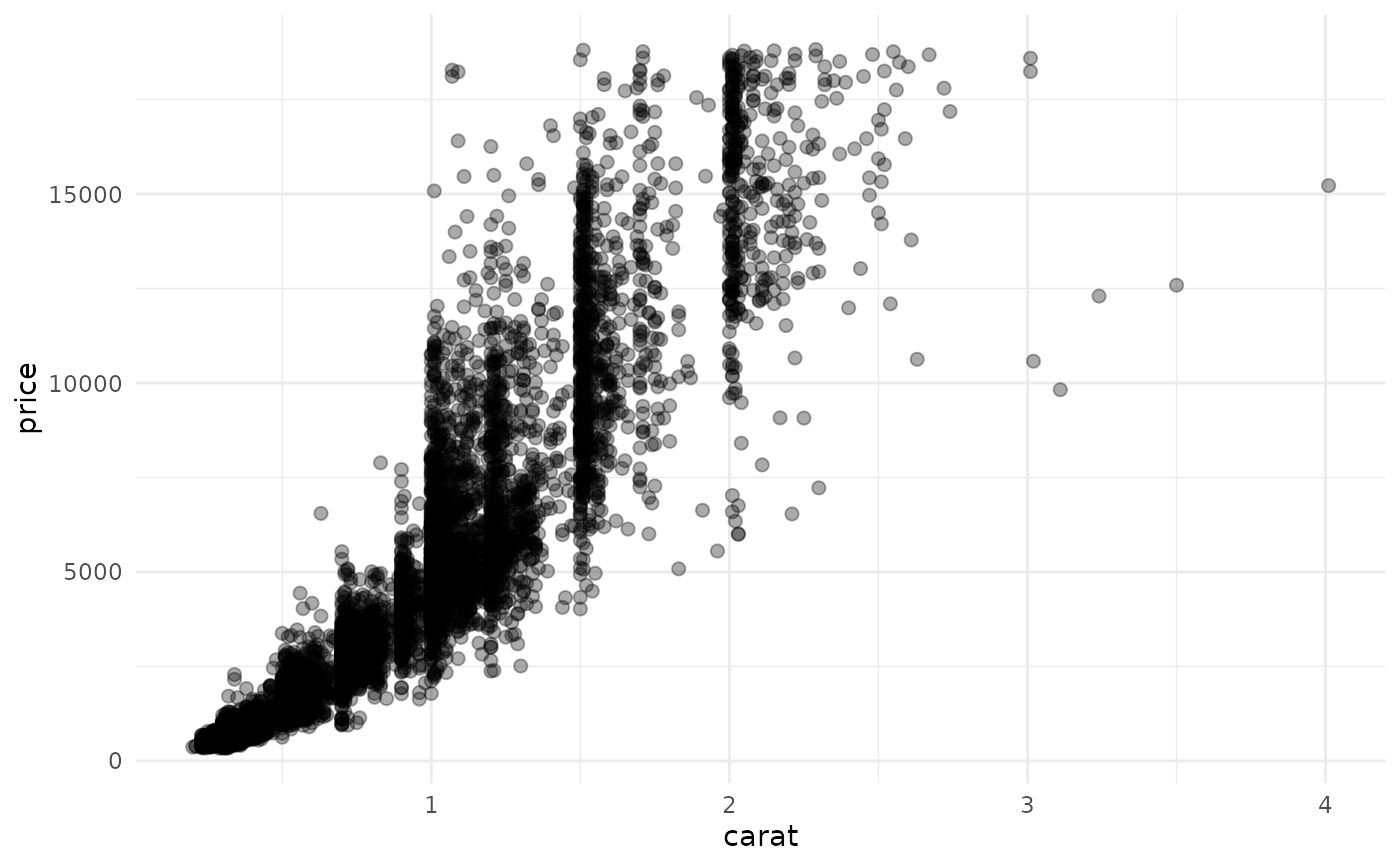
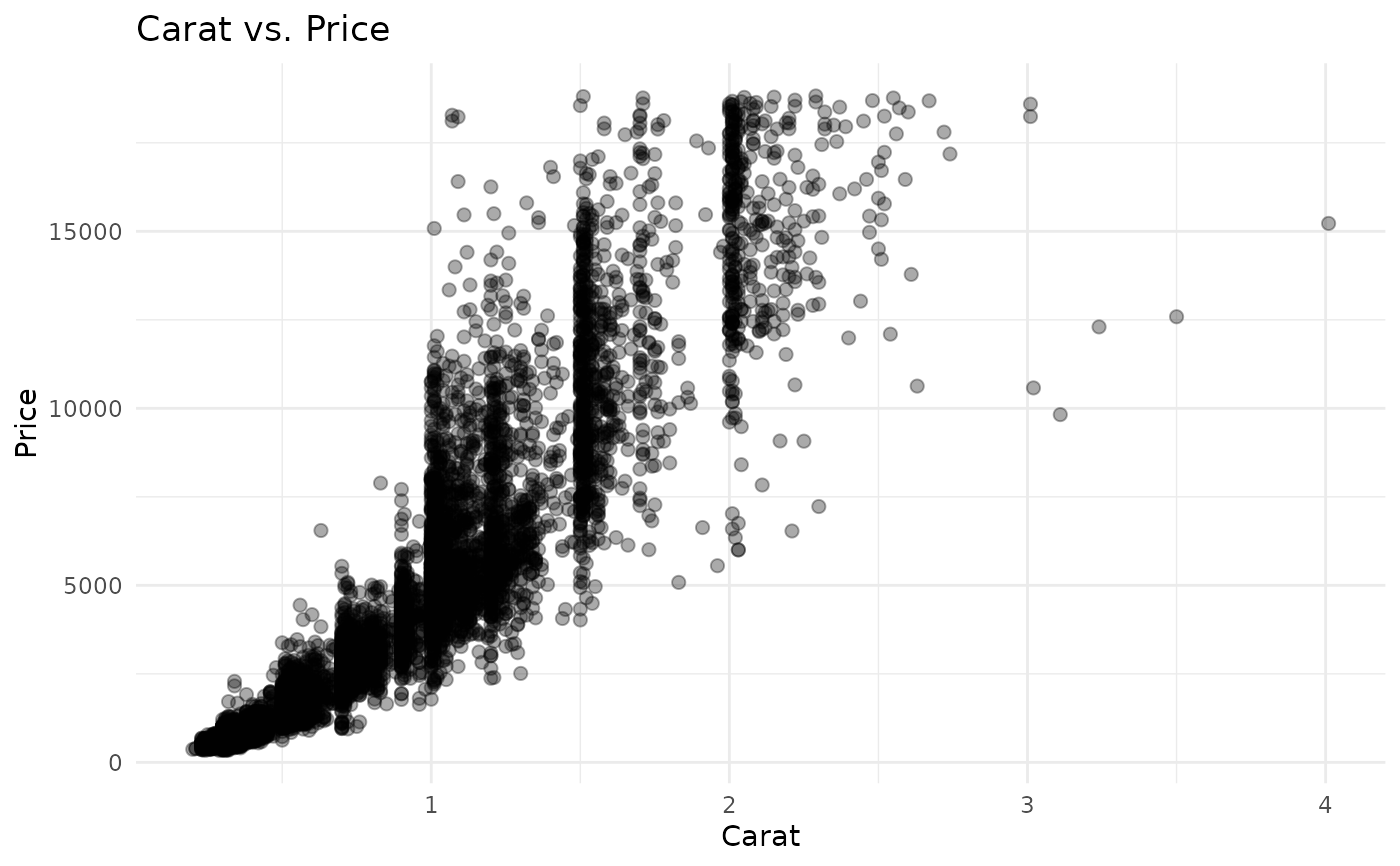
 gg_scatter_color_facet(
df = mini_dmnds,
x_var = "carat",
y_var = "price",
col_var = NULL,
facet_var = NULL,
alpha = 1 / 3,
size = 2
)
gg_scatter_color_facet(
df = mini_dmnds,
x_var = "carat",
y_var = "price",
col_var = NULL,
facet_var = NULL,
alpha = 1 / 3,
size = 2
)
 # compare with
ggplot2::ggplot(
data = mini_dmnds,
mapping = ggplot2::aes(x = carat, y = price)
) +
ggplot2::geom_point(size = 2, alpha = 1 / 3) +
ggplot2::theme_minimal() +
ggplot2::theme(legend.position = "bottom")
# compare with
ggplot2::ggplot(
data = mini_dmnds,
mapping = ggplot2::aes(x = carat, y = price)
) +
ggplot2::geom_point(size = 2, alpha = 1 / 3) +
ggplot2::theme_minimal() +
ggplot2::theme(legend.position = "bottom")