Graphs
graphs.RmdBelow are examples of the data visualizations using
inspectdf in the Shiny app.
Data
We’ll need data to demonstrate how the inspect_plot()
function works. We’ll use the load_tt_data() function to
collect four lists of data from the TidyTuesday
repo.
"Netflix Titles" has a single dataset:
ttd <- load_tt_data("Netflix Titles")
#> INFO [2026-05-28 13:46:04] Starting import for netflix_titles.csv from https://raw.githubusercontent.com/rfordatascience/tidytuesday/refs/heads/main/data/2021/2021-04-20/netflix_titles.csv
#> SUCCESS [2026-05-28 13:46:04] Successfully loaded netflix_titles.csv
purrr::map(.x = ttd, .f = attr, "clean_title")
#> $netflix_titles.csv
#> [1] "netflix_titles"
# for a list with two datasets, we'll use the `"Space Launches"` data
ttd2 <- load_tt_data("Space Launches")
#> INFO [2026-05-28 13:46:04] Starting import for agencies.csv from https://raw.githubusercontent.com/rfordatascience/tidytuesday/refs/heads/main/data/2019/2019-01-15/agencies.csv
#> SUCCESS [2026-05-28 13:46:04] Successfully loaded agencies.csv
#> INFO [2026-05-28 13:46:04] Starting import for launches.csv from https://raw.githubusercontent.com/rfordatascience/tidytuesday/refs/heads/main/data/2019/2019-01-15/launches.csv
#> SUCCESS [2026-05-28 13:46:05] Successfully loaded launches.csv
purrr::map(.x = ttd2, .f = attr, "clean_title")
#> $agencies.csv
#> [1] "space_launches"
#>
#> $launches.csv
#> [1] "space_launches"
# "Moore's Law" contains three datasets
ttd3 <- load_tt_data("Moore’s Law")
#> INFO [2026-05-28 13:46:05] Starting import for cpu.csv from https://raw.githubusercontent.com/rfordatascience/tidytuesday/refs/heads/main/data/2019/2019-09-03/cpu.csv
#> SUCCESS [2026-05-28 13:46:05] Successfully loaded cpu.csv
#> INFO [2026-05-28 13:46:05] Starting import for gpu.csv from https://raw.githubusercontent.com/rfordatascience/tidytuesday/refs/heads/main/data/2019/2019-09-03/gpu.csv
#> SUCCESS [2026-05-28 13:46:05] Successfully loaded gpu.csv
#> INFO [2026-05-28 13:46:05] Starting import for ram.csv from https://raw.githubusercontent.com/rfordatascience/tidytuesday/refs/heads/main/data/2019/2019-09-03/ram.csv
#> SUCCESS [2026-05-28 13:46:05] Successfully loaded ram.csv
purrr::map(.x = ttd3, .f = attr, "clean_title")
#> $cpu.csv
#> [1] "moores_law"
#>
#> $gpu.csv
#> [1] "moores_law"
#>
#> $ram.csv
#> [1] "moores_law"
# finally, we'll download the "LEGO database" data with 12 datasets into the
# ttd_many list:
ttd_many <- load_tt_data("LEGO database")
#> INFO [2026-05-28 13:46:05] Starting import for colors.csv.gz from https://raw.githubusercontent.com/rfordatascience/tidytuesday/refs/heads/main/data/2022/2022-09-06/colors.csv.gz
#> SUCCESS [2026-05-28 13:46:05] Successfully loaded colors.csv.gz
#> INFO [2026-05-28 13:46:05] Starting import for elements.csv.gz from https://raw.githubusercontent.com/rfordatascience/tidytuesday/refs/heads/main/data/2022/2022-09-06/elements.csv.gz
#> SUCCESS [2026-05-28 13:46:05] Successfully loaded elements.csv.gz
#> INFO [2026-05-28 13:46:05] Starting import for inventories.csv.gz from https://raw.githubusercontent.com/rfordatascience/tidytuesday/refs/heads/main/data/2022/2022-09-06/inventories.csv.gz
#> SUCCESS [2026-05-28 13:46:05] Successfully loaded inventories.csv.gz
#> INFO [2026-05-28 13:46:05] Starting import for inventory_minifigs.csv.gz from https://raw.githubusercontent.com/rfordatascience/tidytuesday/refs/heads/main/data/2022/2022-09-06/inventory_minifigs.csv.gz
#> SUCCESS [2026-05-28 13:46:05] Successfully loaded inventory_minifigs.csv.gz
#> INFO [2026-05-28 13:46:05] Starting import for inventory_parts.csv.gz from https://raw.githubusercontent.com/rfordatascience/tidytuesday/refs/heads/main/data/2022/2022-09-06/inventory_parts.csv.gz
#> SUCCESS [2026-05-28 13:46:06] Successfully loaded inventory_parts.csv.gz
#> INFO [2026-05-28 13:46:06] Starting import for inventory_sets.csv.gz from https://raw.githubusercontent.com/rfordatascience/tidytuesday/refs/heads/main/data/2022/2022-09-06/inventory_sets.csv.gz
#> SUCCESS [2026-05-28 13:46:06] Successfully loaded inventory_sets.csv.gz
#> INFO [2026-05-28 13:46:06] Starting import for minifigs.csv.gz from https://raw.githubusercontent.com/rfordatascience/tidytuesday/refs/heads/main/data/2022/2022-09-06/minifigs.csv.gz
#> SUCCESS [2026-05-28 13:46:06] Successfully loaded minifigs.csv.gz
#> INFO [2026-05-28 13:46:06] Starting import for part_categories.csv.gz from https://raw.githubusercontent.com/rfordatascience/tidytuesday/refs/heads/main/data/2022/2022-09-06/part_categories.csv.gz
#> SUCCESS [2026-05-28 13:46:06] Successfully loaded part_categories.csv.gz
#> INFO [2026-05-28 13:46:06] Starting import for part_relationships.csv.gz from https://raw.githubusercontent.com/rfordatascience/tidytuesday/refs/heads/main/data/2022/2022-09-06/part_relationships.csv.gz
#> SUCCESS [2026-05-28 13:46:07] Successfully loaded part_relationships.csv.gz
#> INFO [2026-05-28 13:46:07] Starting import for parts.csv.gz from https://raw.githubusercontent.com/rfordatascience/tidytuesday/refs/heads/main/data/2022/2022-09-06/parts.csv.gz
#> SUCCESS [2026-05-28 13:46:07] Successfully loaded parts.csv.gz
#> INFO [2026-05-28 13:46:07] Starting import for sets.csv.gz from https://raw.githubusercontent.com/rfordatascience/tidytuesday/refs/heads/main/data/2022/2022-09-06/sets.csv.gz
#> SUCCESS [2026-05-28 13:46:07] Successfully loaded sets.csv.gz
#> INFO [2026-05-28 13:46:07] Starting import for themes.csv.gz from https://raw.githubusercontent.com/rfordatascience/tidytuesday/refs/heads/main/data/2022/2022-09-06/themes.csv.gz
#> SUCCESS [2026-05-28 13:46:07] Successfully loaded themes.csv.gz
purrr::map(.x = ttd_many, .f = attr, "clean_title")
#> $colors.csv.gz
#> [1] "lego_database"
#>
#> $elements.csv.gz
#> [1] "lego_database"
#>
#> $inventories.csv.gz
#> [1] "lego_database"
#>
#> $inventory_minifigs.csv.gz
#> [1] "lego_database"
#>
#> $inventory_parts.csv.gz
#> [1] "lego_database"
#>
#> $inventory_sets.csv.gz
#> [1] "lego_database"
#>
#> $minifigs.csv.gz
#> [1] "lego_database"
#>
#> $part_categories.csv.gz
#> [1] "lego_database"
#>
#> $part_relationships.csv.gz
#> [1] "lego_database"
#>
#> $parts.csv.gz
#> [1] "lego_database"
#>
#> $sets.csv.gz
#> [1] "lego_database"
#>
#> $themes.csv.gz
#> [1] "lego_database"
Utility functions
The inspect_plot() function has the following utility
functions:
Check numeric columns
Check if datasets have numerical columns:
check_ttd_num_cols(ttd = ttd3)
#> $cpu.csv
#> [1] "transistor_count"     "date_of_introduction" "process"
#> [4] "area"
#>
#> $gpu.csv
#> [1] "transistor_count"     "date_of_introduction" "process"
#> [4] "area"
#>
#> $ram.csv
#> [1] "capacity_bits"        "transistor_count"     "date_of_introduction"
#> [4] "process" "area"- If so, do they have two or more?
Check categorical columns
Check if datasets have categorical (character) columns:
check_ttd_cat_cols(ttd3)
#> $cpu.csv
#> [1] "processor" "designer"
#>
#> $gpu.csv
#> [1] "processor"      "designer_s"     "manufacturer_s" "ref"
#>
#> $ram.csv
#> [1] "chip_name"      "bit_units"      "ram_type"       "manufacturer_s"
#> [5] "ref"
Check list columns
Check list columns:
check_ttd_list_cols(ttd3)
#> $cpu.csv
#> [1] 0
#>
#> $gpu.csv
#> [1] 0
#>
#> $ram.csv
#> [1] 0
Check logical columns
Check logical columns:
check_ttd_log_cols(ttd3)
#> $cpu.csv
#> [1] 0
#>
#> $gpu.csv
#> [1] 0
#>
#> $ram.csv
#> [1] 0
Check date columns
Check date columns:
check_ttd_date_cols(ttd3)
#> $cpu.csv
#> [1] 0
#>
#> $gpu.csv
#> [1] 0
#>
#> $ram.csv
#> [1] 0
check_col_types()
These are wrapped in the check_col_types() function:
identical( # check the
  x = length(check_col_types(ttd = ttd3, type = "cat")),
  y = length(check_ttd_cat_cols(ttd3))
)
#> [1] TRUE
identical(
  x = length(check_col_types(ttd = ttd3, type = "date")),
  y = length(check_ttd_date_cols(ttd3))
)
#> [1] TRUE
identical(
  x = length(check_col_types(ttd = ttd3, type = "log")),
  y = length(check_ttd_log_cols(ttd3))
)
#> [1] TRUE
identical(
  x = length(check_col_types(ttd = ttd3, type = "num")),
  y = length(check_ttd_num_cols(ttd3))
)
#> [1] TRUE
The functions above allow us to collect the following:
- Determine the number of datasets in the
ttdlist
- Determine the name of the datasets in the
ttdlist
- Determine the number of numerical columns in each dataset in the
ttdlist
- Determine the names of any intersecting numerical columns in each
dataset in the
ttdlist
- Determine the number of categorical columns in each dataset in the
ttdlist
- Determine the names of any intersecting categorical columns in each
dataset in the
ttdlist
- Determine the number of logical columns in each dataset in the
ttdlist
- Determine the number of date columns in each dataset in the
ttdlist
- Determine the names of any date columns in each dataset in the
ttdlist
- Determine the number of list columns in each dataset in the
ttdlist
- Determine the names of any list columns in each dataset in the
ttdlist
Function logic
Using the functions above, write the custom
inspect_plot() function and have it adhere to the following
rules:
inspect_types()
if (length(ttd) == 1)
If one dataset in ttd:
inspectdf::inspect_types(
  df1 = ttd2[[1]],
  df2 = NULL
) |>
  inspectdf::show_plot(text_labels = TRUE)
inspect_plot(ttd =
    list("agencies.csv" = ttd2[[1]]),
  plots = "types")
#> INFO [2026-05-28 13:46:08] inspect_plot(): starting analysis
#> INFO [2026-05-28 13:46:08] Beginning plot type 'types'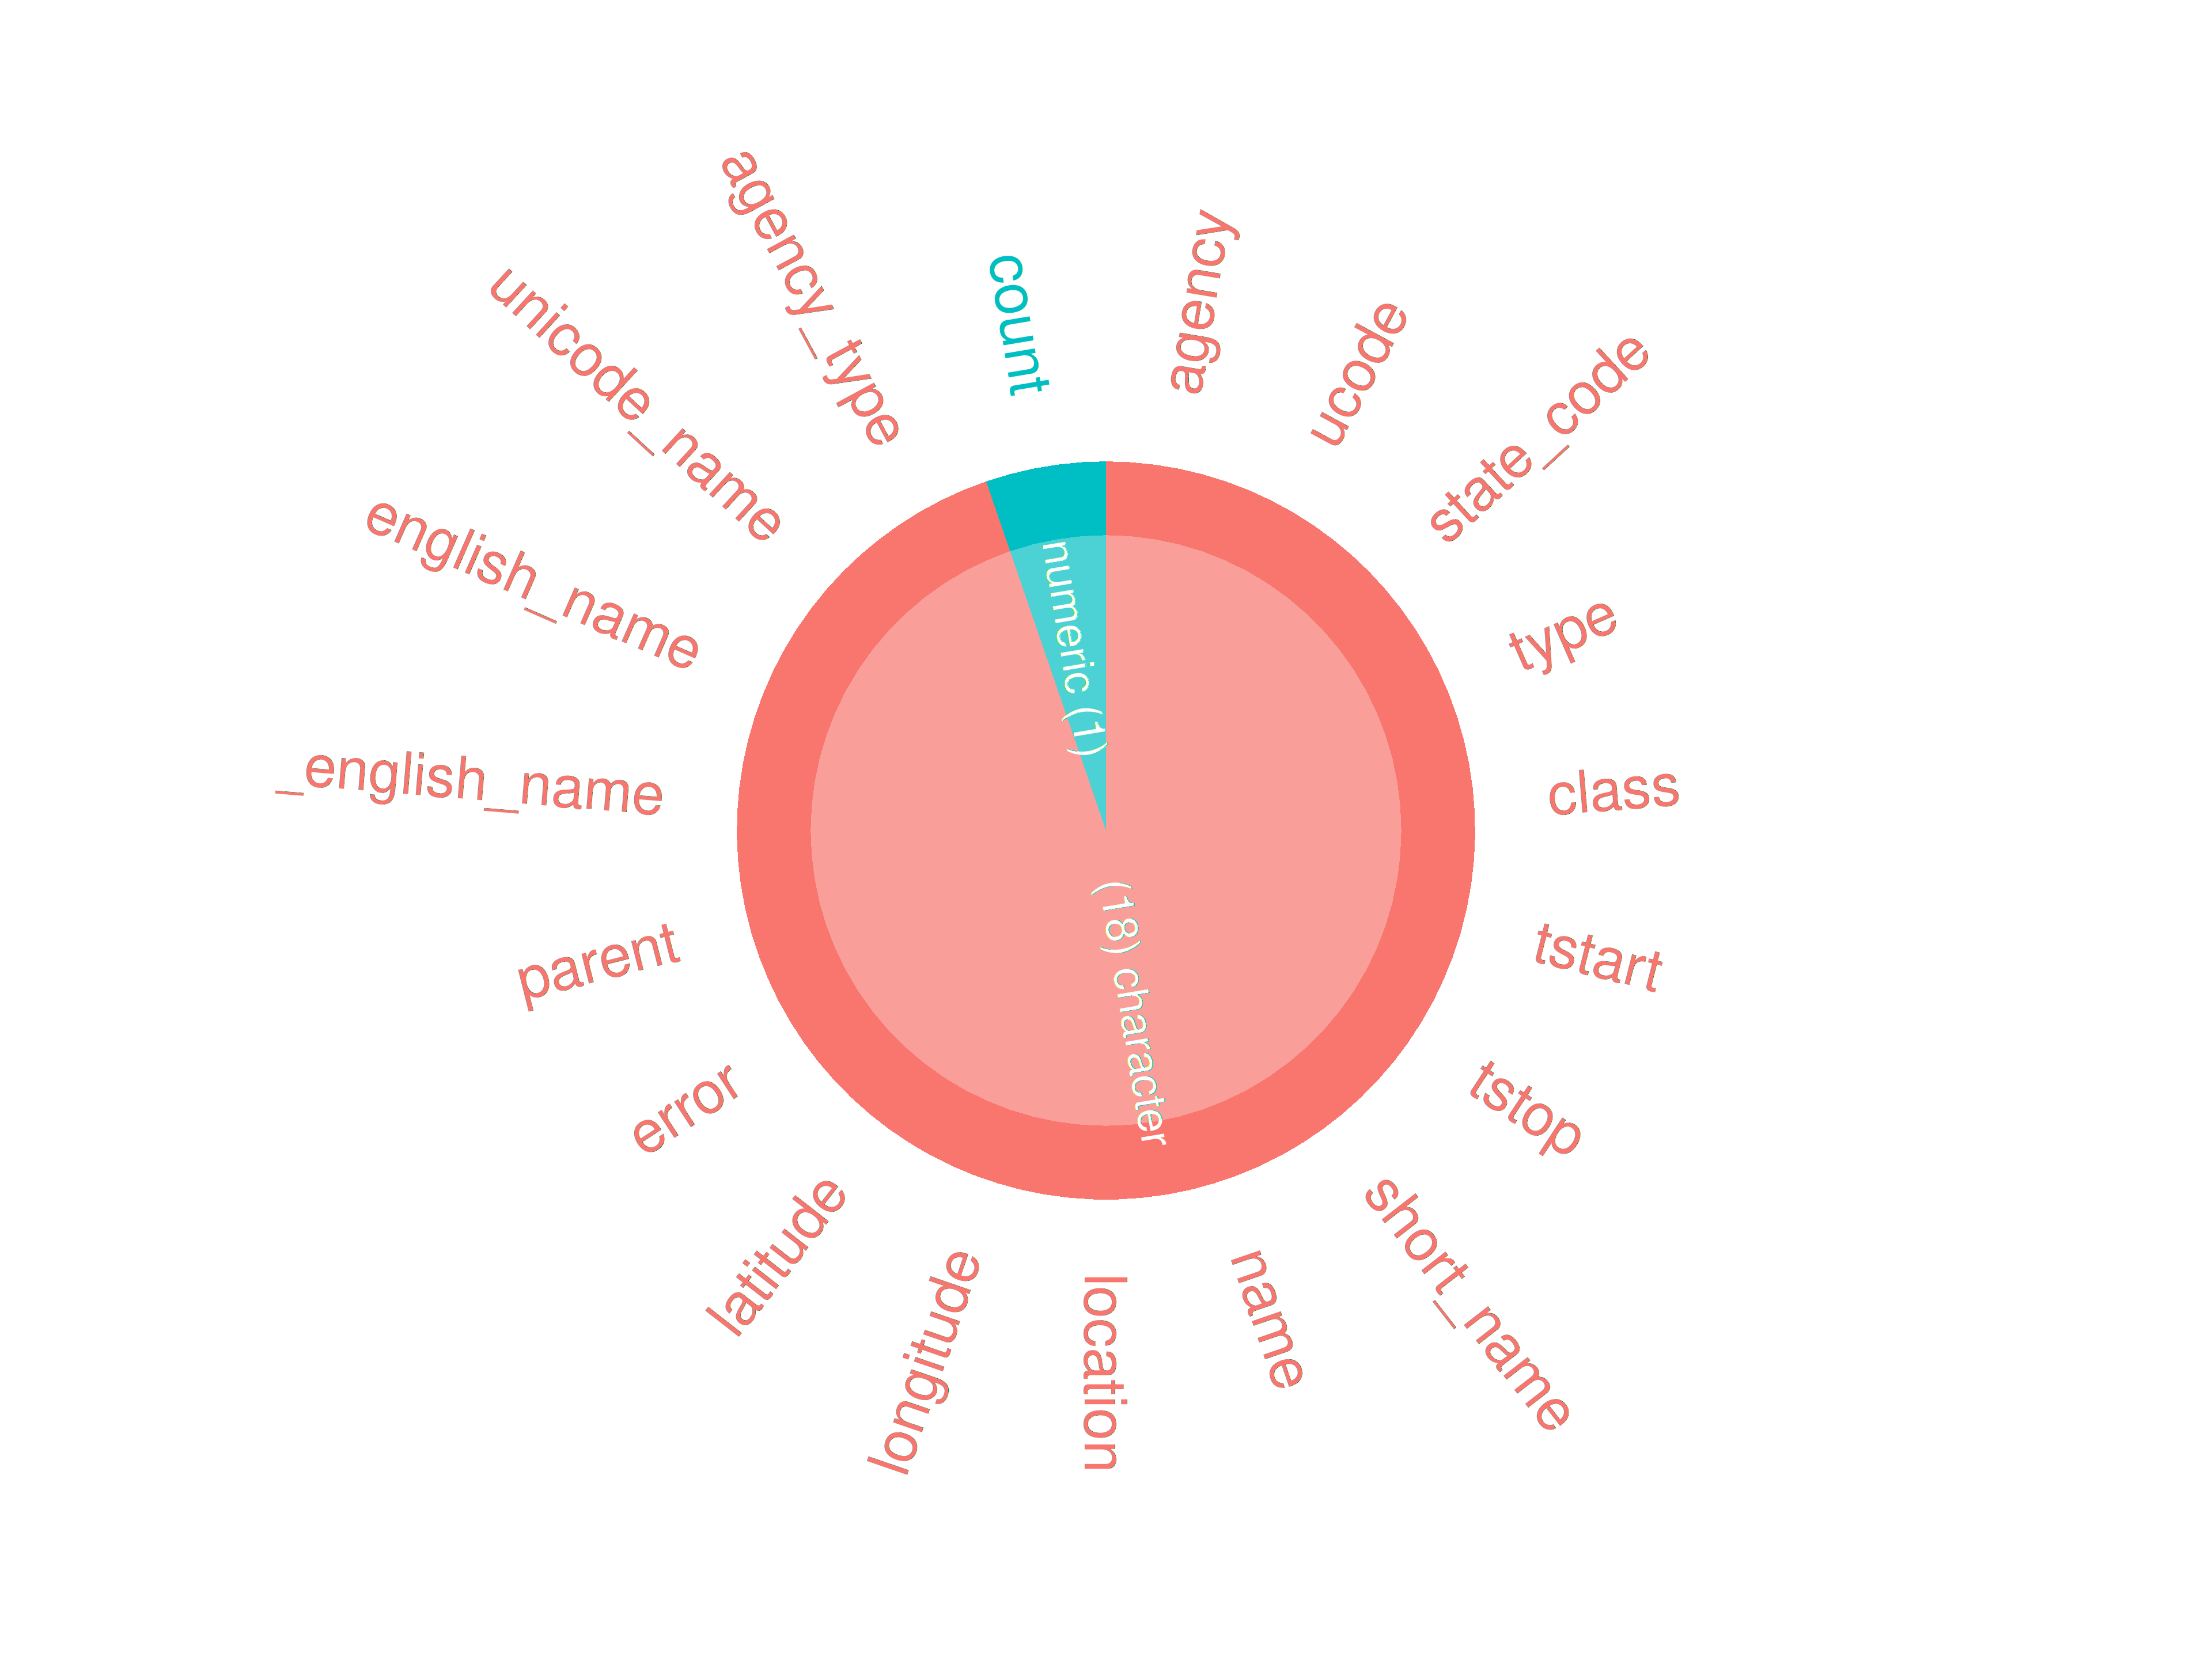
#> SUCCESS [2026-05-28 13:46:08] Completed plot type 'types'
#> SUCCESS [2026-05-28 13:46:08] inspect_plot(): all requested plots finished
#> NULL
if (length(ttd) == 2)
If two datasets in ttd:
check for intersecting columns
if columns intersect, store column names as
intersecting_columns
if (length(intersect(names(ttd2[[1]]), names(ttd2[[2]]))) > 0) {
  intersecting_columns <- intersect(
  x = names(ttd2[[1]]),
  y = names(ttd2[[2]])
  )
}- Then use
intersecting_columnsto subsetttdfor theinspect_cat()function:
inspectdf::inspect_types(
  df1 = ttd2[[1]][intersecting_columns],
  df2 = ttd2[[2]][intersecting_columns],
) |>
  inspectdf::show_plot(text_labels = TRUE)
#> Warning: Using `size` aesthetic for lines was deprecated in ggplot2 3.4.0.
#> ℹ Please use `linewidth` instead.
#> ℹ The deprecated feature was likely used in the inspectdf package.
#>   Please report the issue at
#>   <https://github.com/alastairrushworth/inspectdf/issues>.
#> This warning is displayed once per session.
#> Call `lifecycle::last_lifecycle_warnings()` to see where this warning was
#> generated.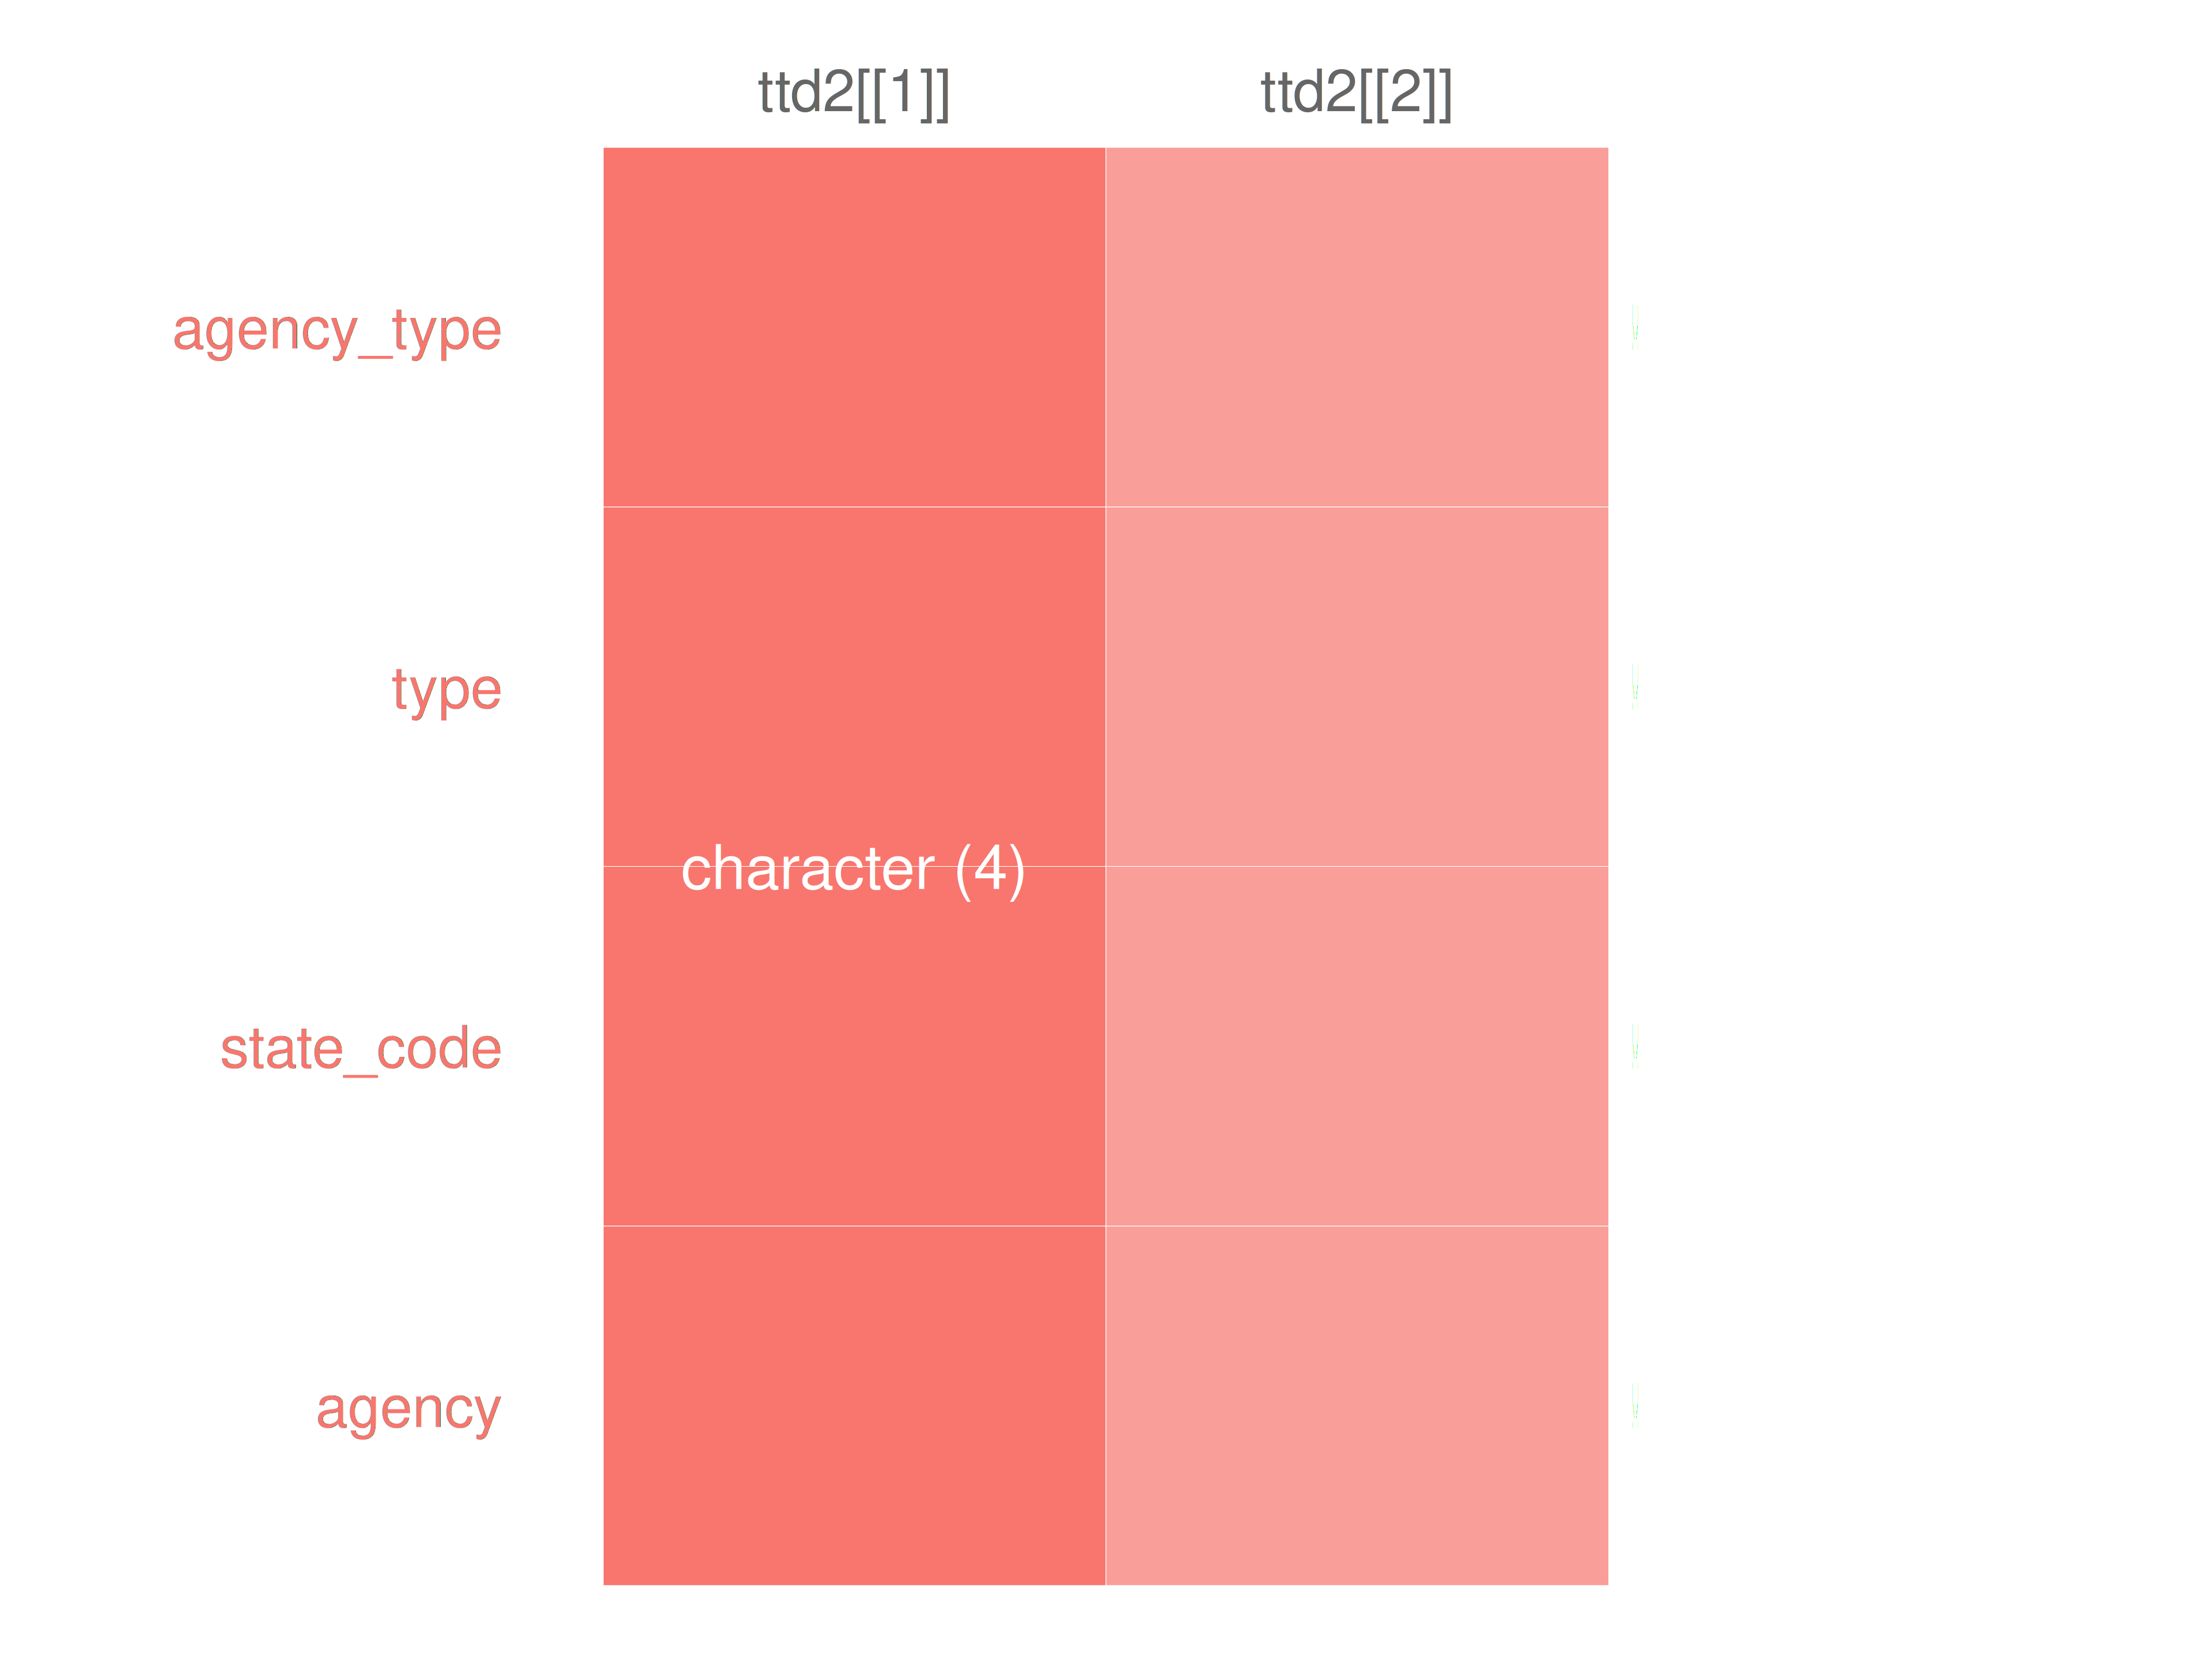
if (length(ttd) >= 3)
If more than two datasets in ttd:
inspectdf::inspect_types(
  df1 = ttd3[[1]],
  df2 = NULL
) |>
  inspectdf::show_plot(text_labels = TRUE)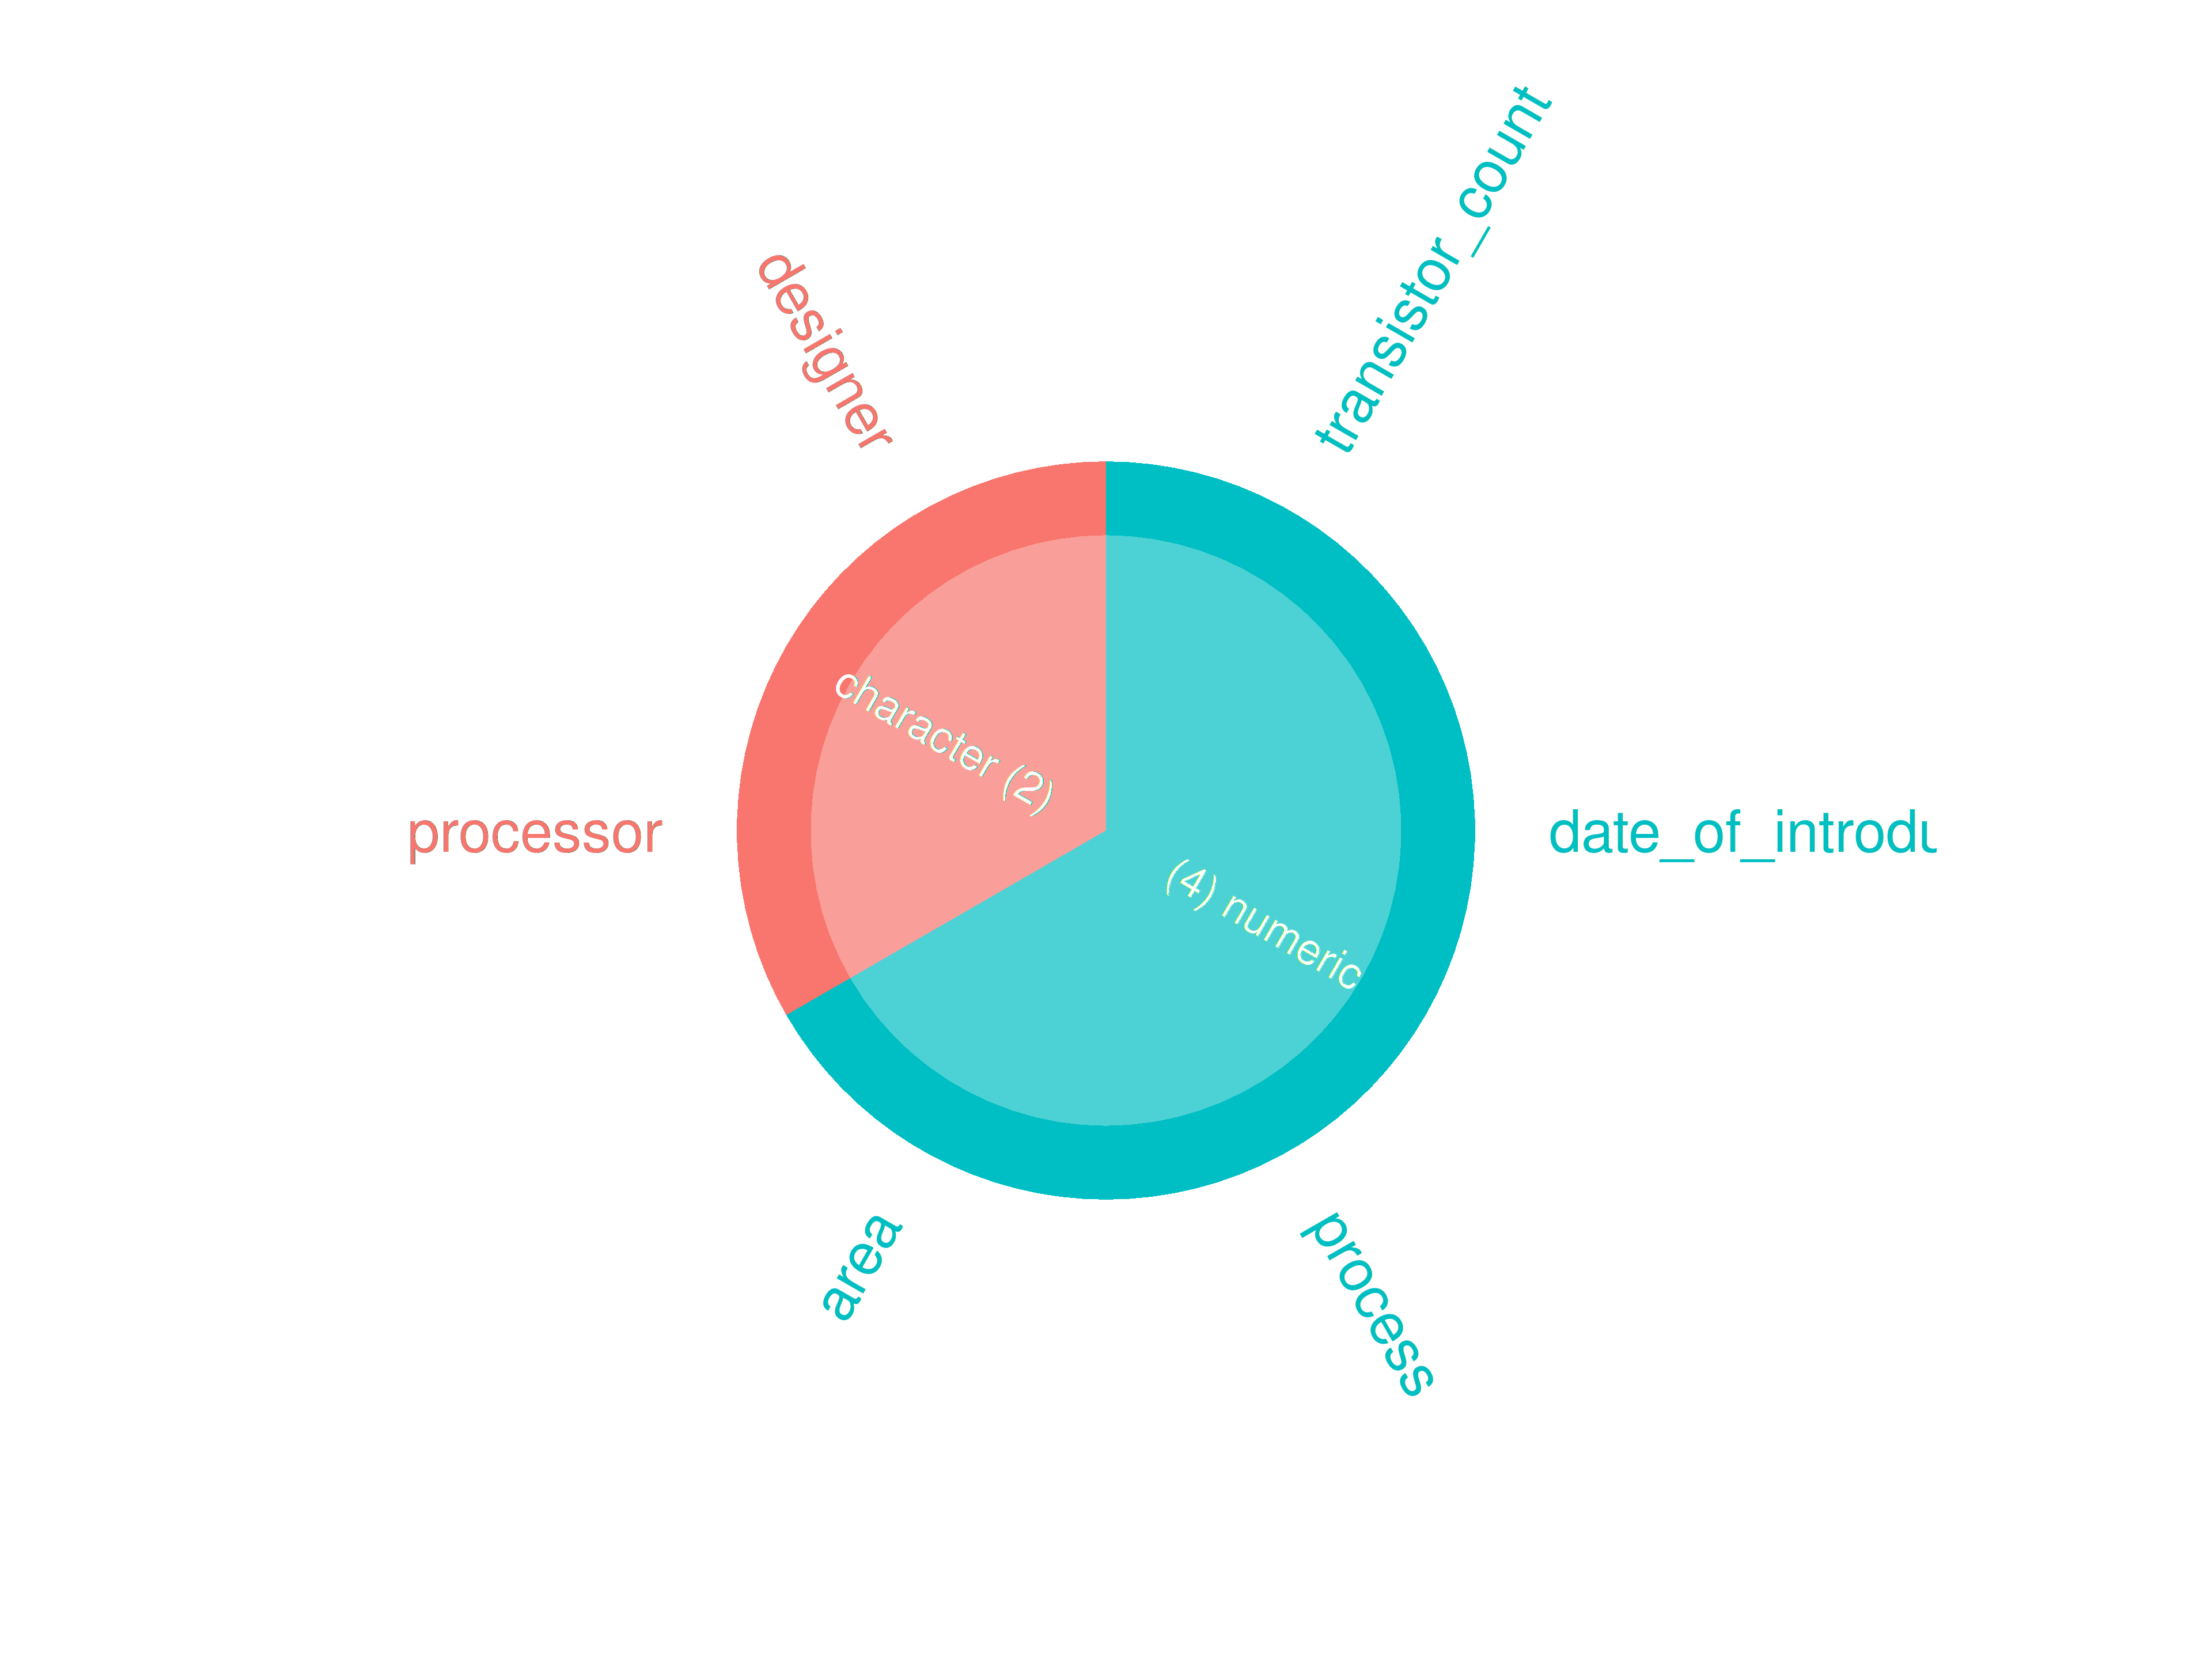
inspect_plot(
  ttd = list("cpu.csv" = ttd3[[1]]),
  plots = "types"
  )
#> INFO [2026-05-28 13:46:12] inspect_plot(): starting analysis
#> INFO [2026-05-28 13:46:12] Beginning plot type 'types'
#> SUCCESS [2026-05-28 13:46:12] Completed plot type 'types'
#> SUCCESS [2026-05-28 13:46:12] inspect_plot(): all requested plots finished
#> NULL
inspectdf::inspect_types(
  df1 = ttd3[[2]],
  df2 = NULL
) |>
  inspectdf::show_plot(text_labels = TRUE)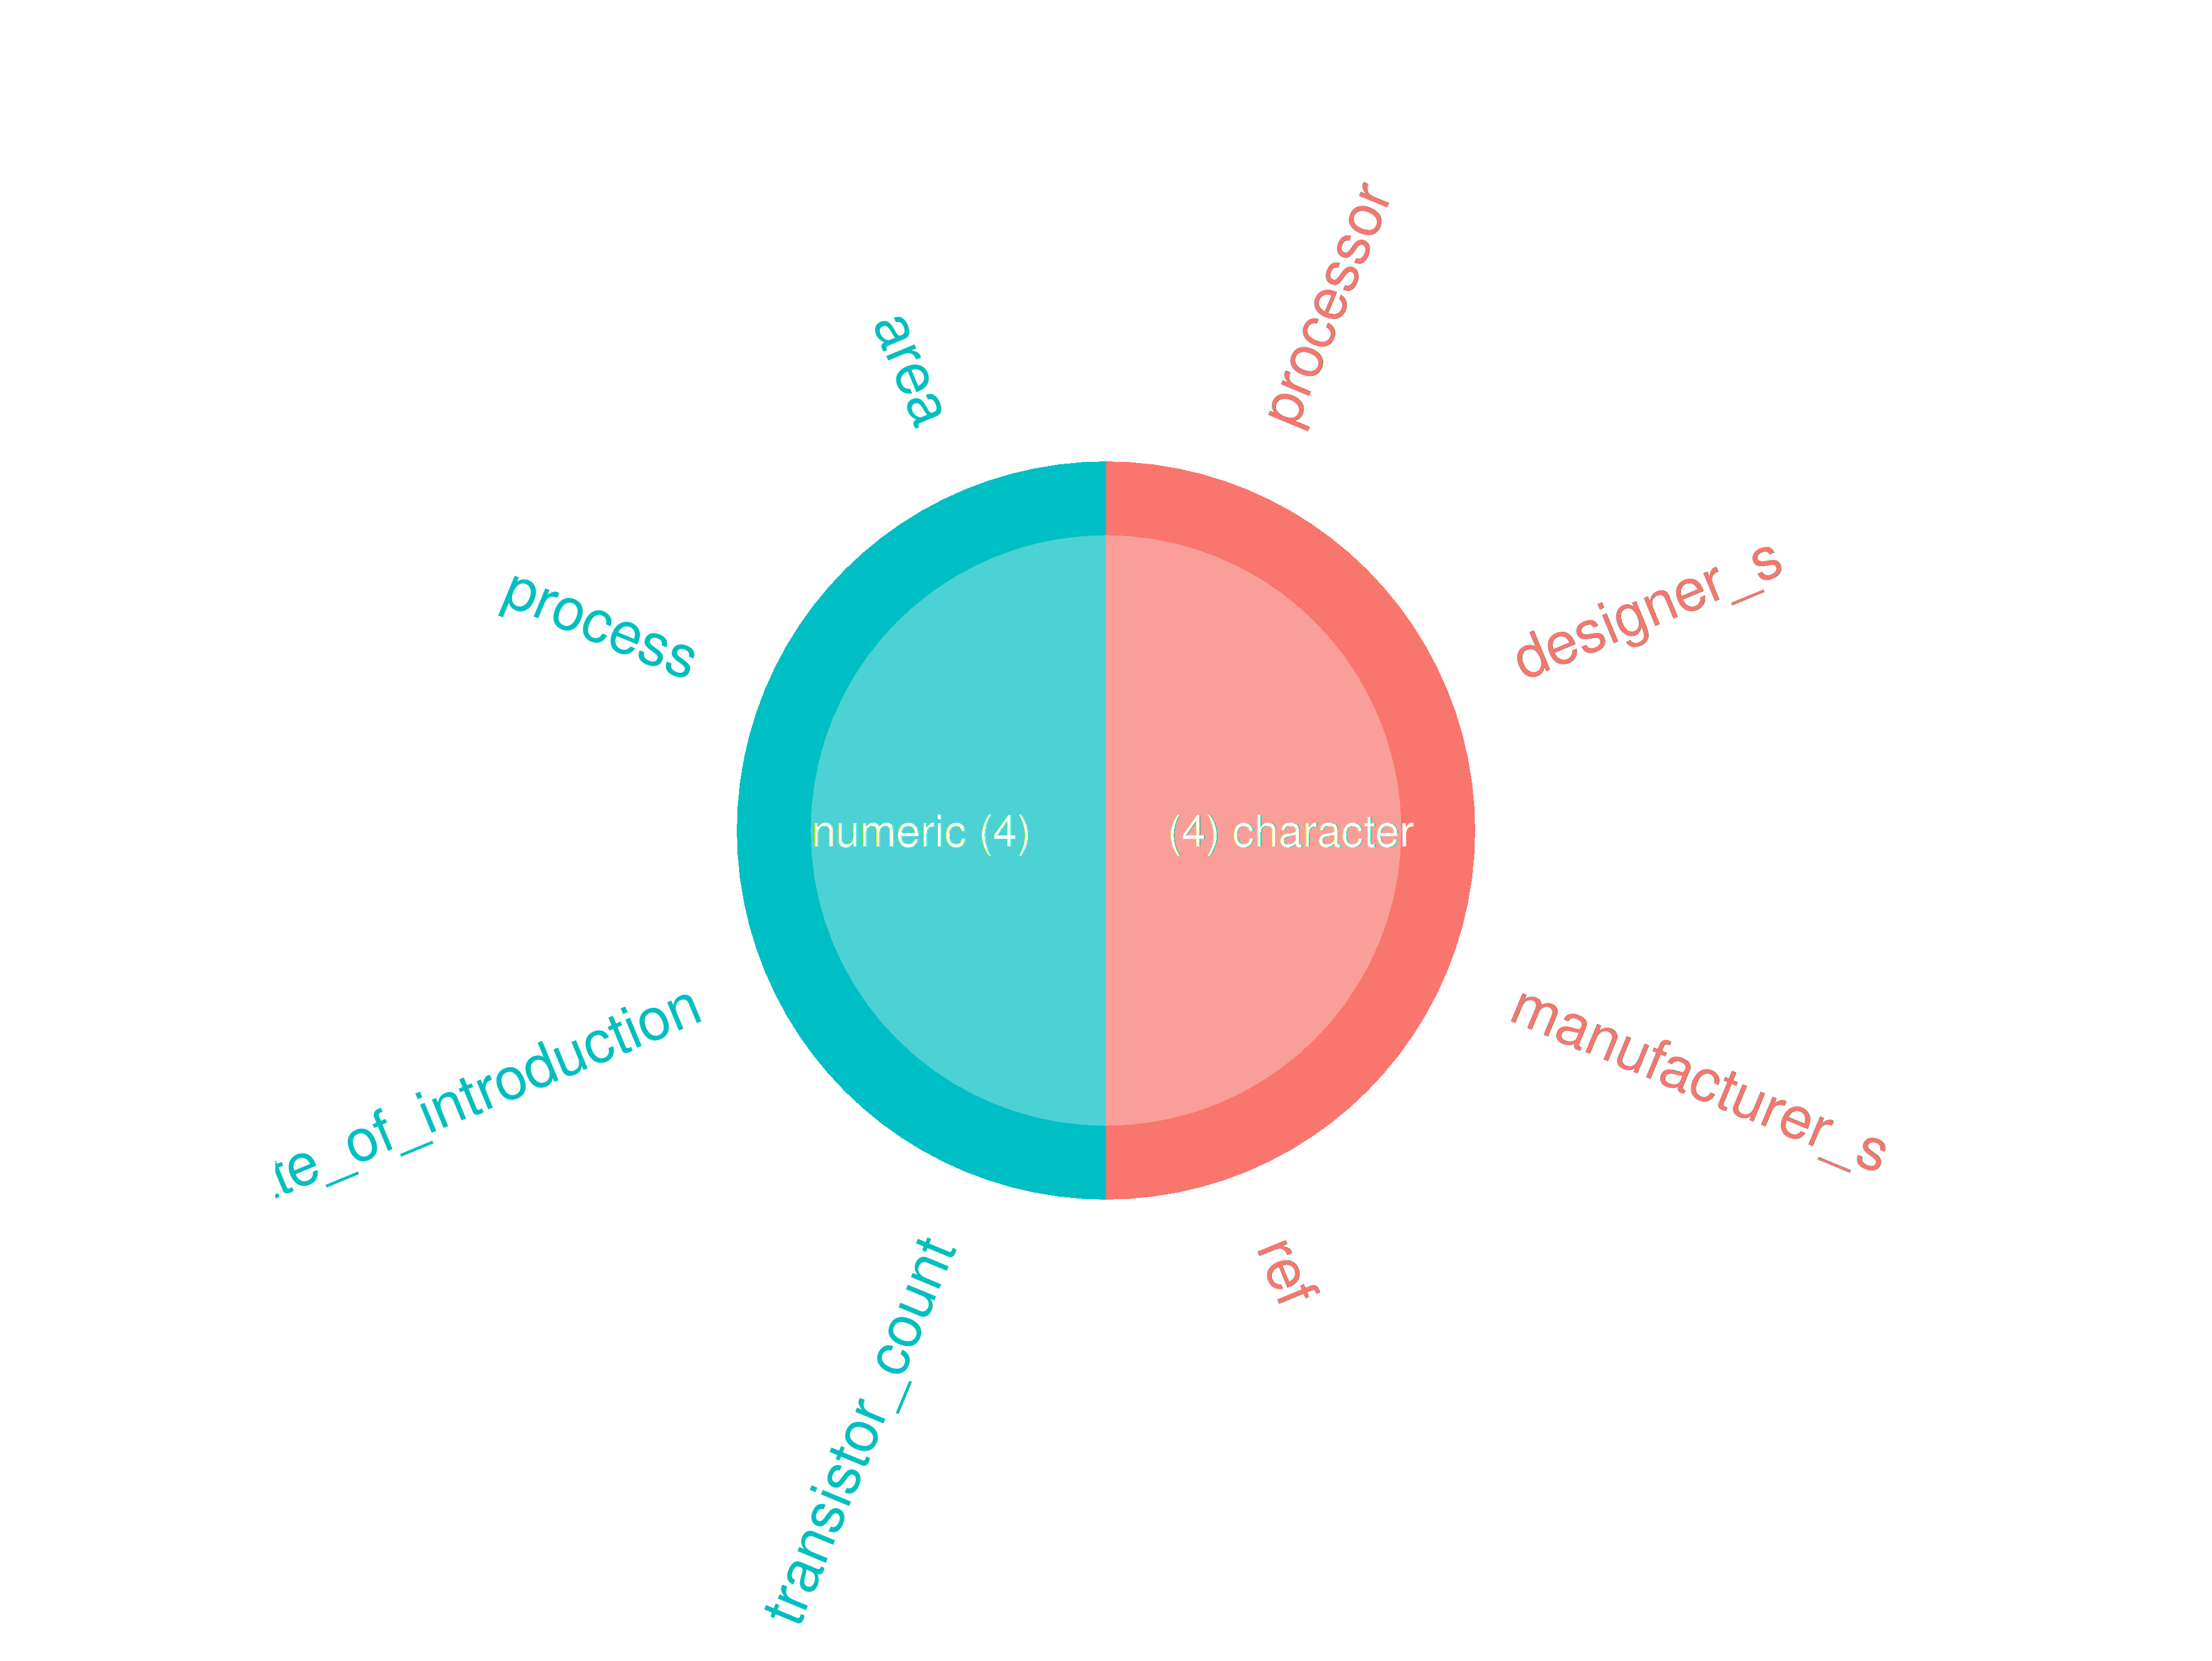
inspect_plot(
  ttd = list("gpu.csv" = ttd3[[2]]),
  plots = "types"
  )
#> INFO [2026-05-28 13:46:14] inspect_plot(): starting analysis
#> INFO [2026-05-28 13:46:14] Beginning plot type 'types'
#> SUCCESS [2026-05-28 13:46:15] Completed plot type 'types'
#> SUCCESS [2026-05-28 13:46:15] inspect_plot(): all requested plots finished
#> NULL
inspectdf::inspect_types(
  df1 = ttd3[[3]],
  df2 = NULL
) |>
  inspectdf::show_plot(text_labels = TRUE)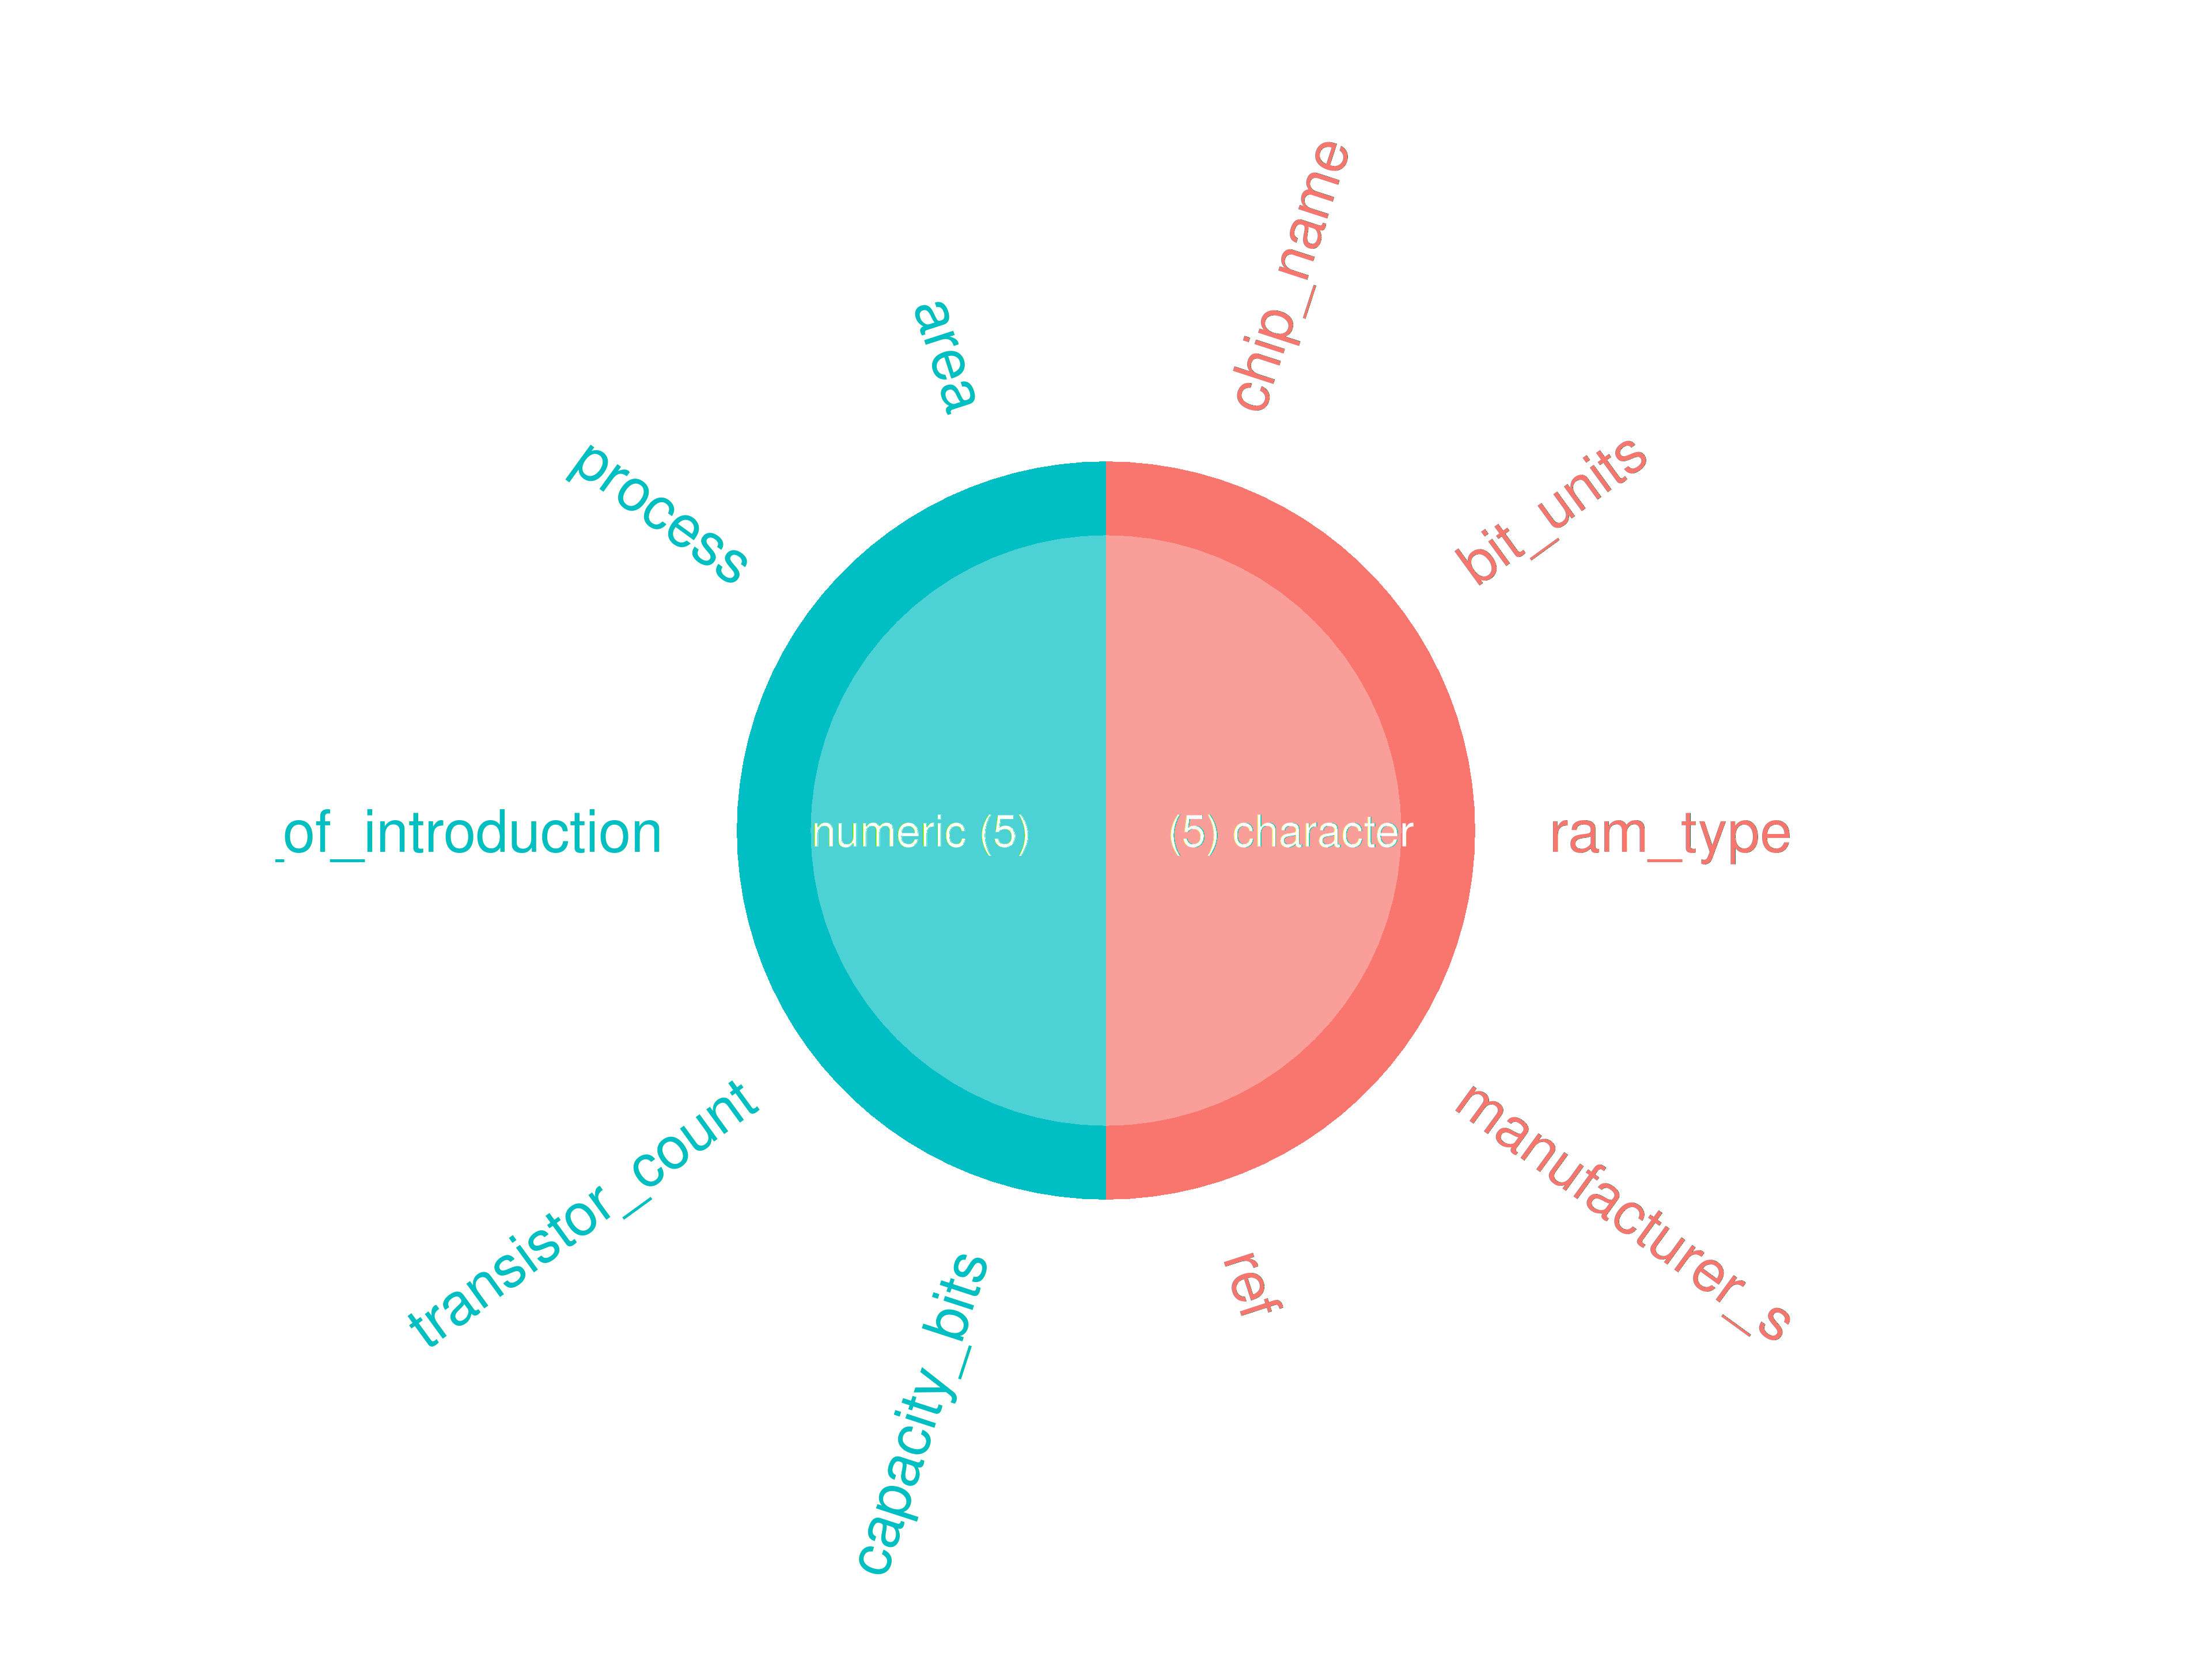
inspect_plot(
  ttd = list("ram.csv" = ttd3[[3]]),
  plots = "types"
  )
#> INFO [2026-05-28 13:46:17] inspect_plot(): starting analysis
#> INFO [2026-05-28 13:46:17] Beginning plot type 'types'
#> SUCCESS [2026-05-28 13:46:17] Completed plot type 'types'
#> SUCCESS [2026-05-28 13:46:17] inspect_plot(): all requested plots finished
#> NULL
inspect_mem()
if (length(ttd) == 1)
If one dataset in ttd:
inspectdf::inspect_mem(
  df1 = ttd[[1]],
  df2 = NULL) |>
  inspectdf::show_plot(text_labels = TRUE)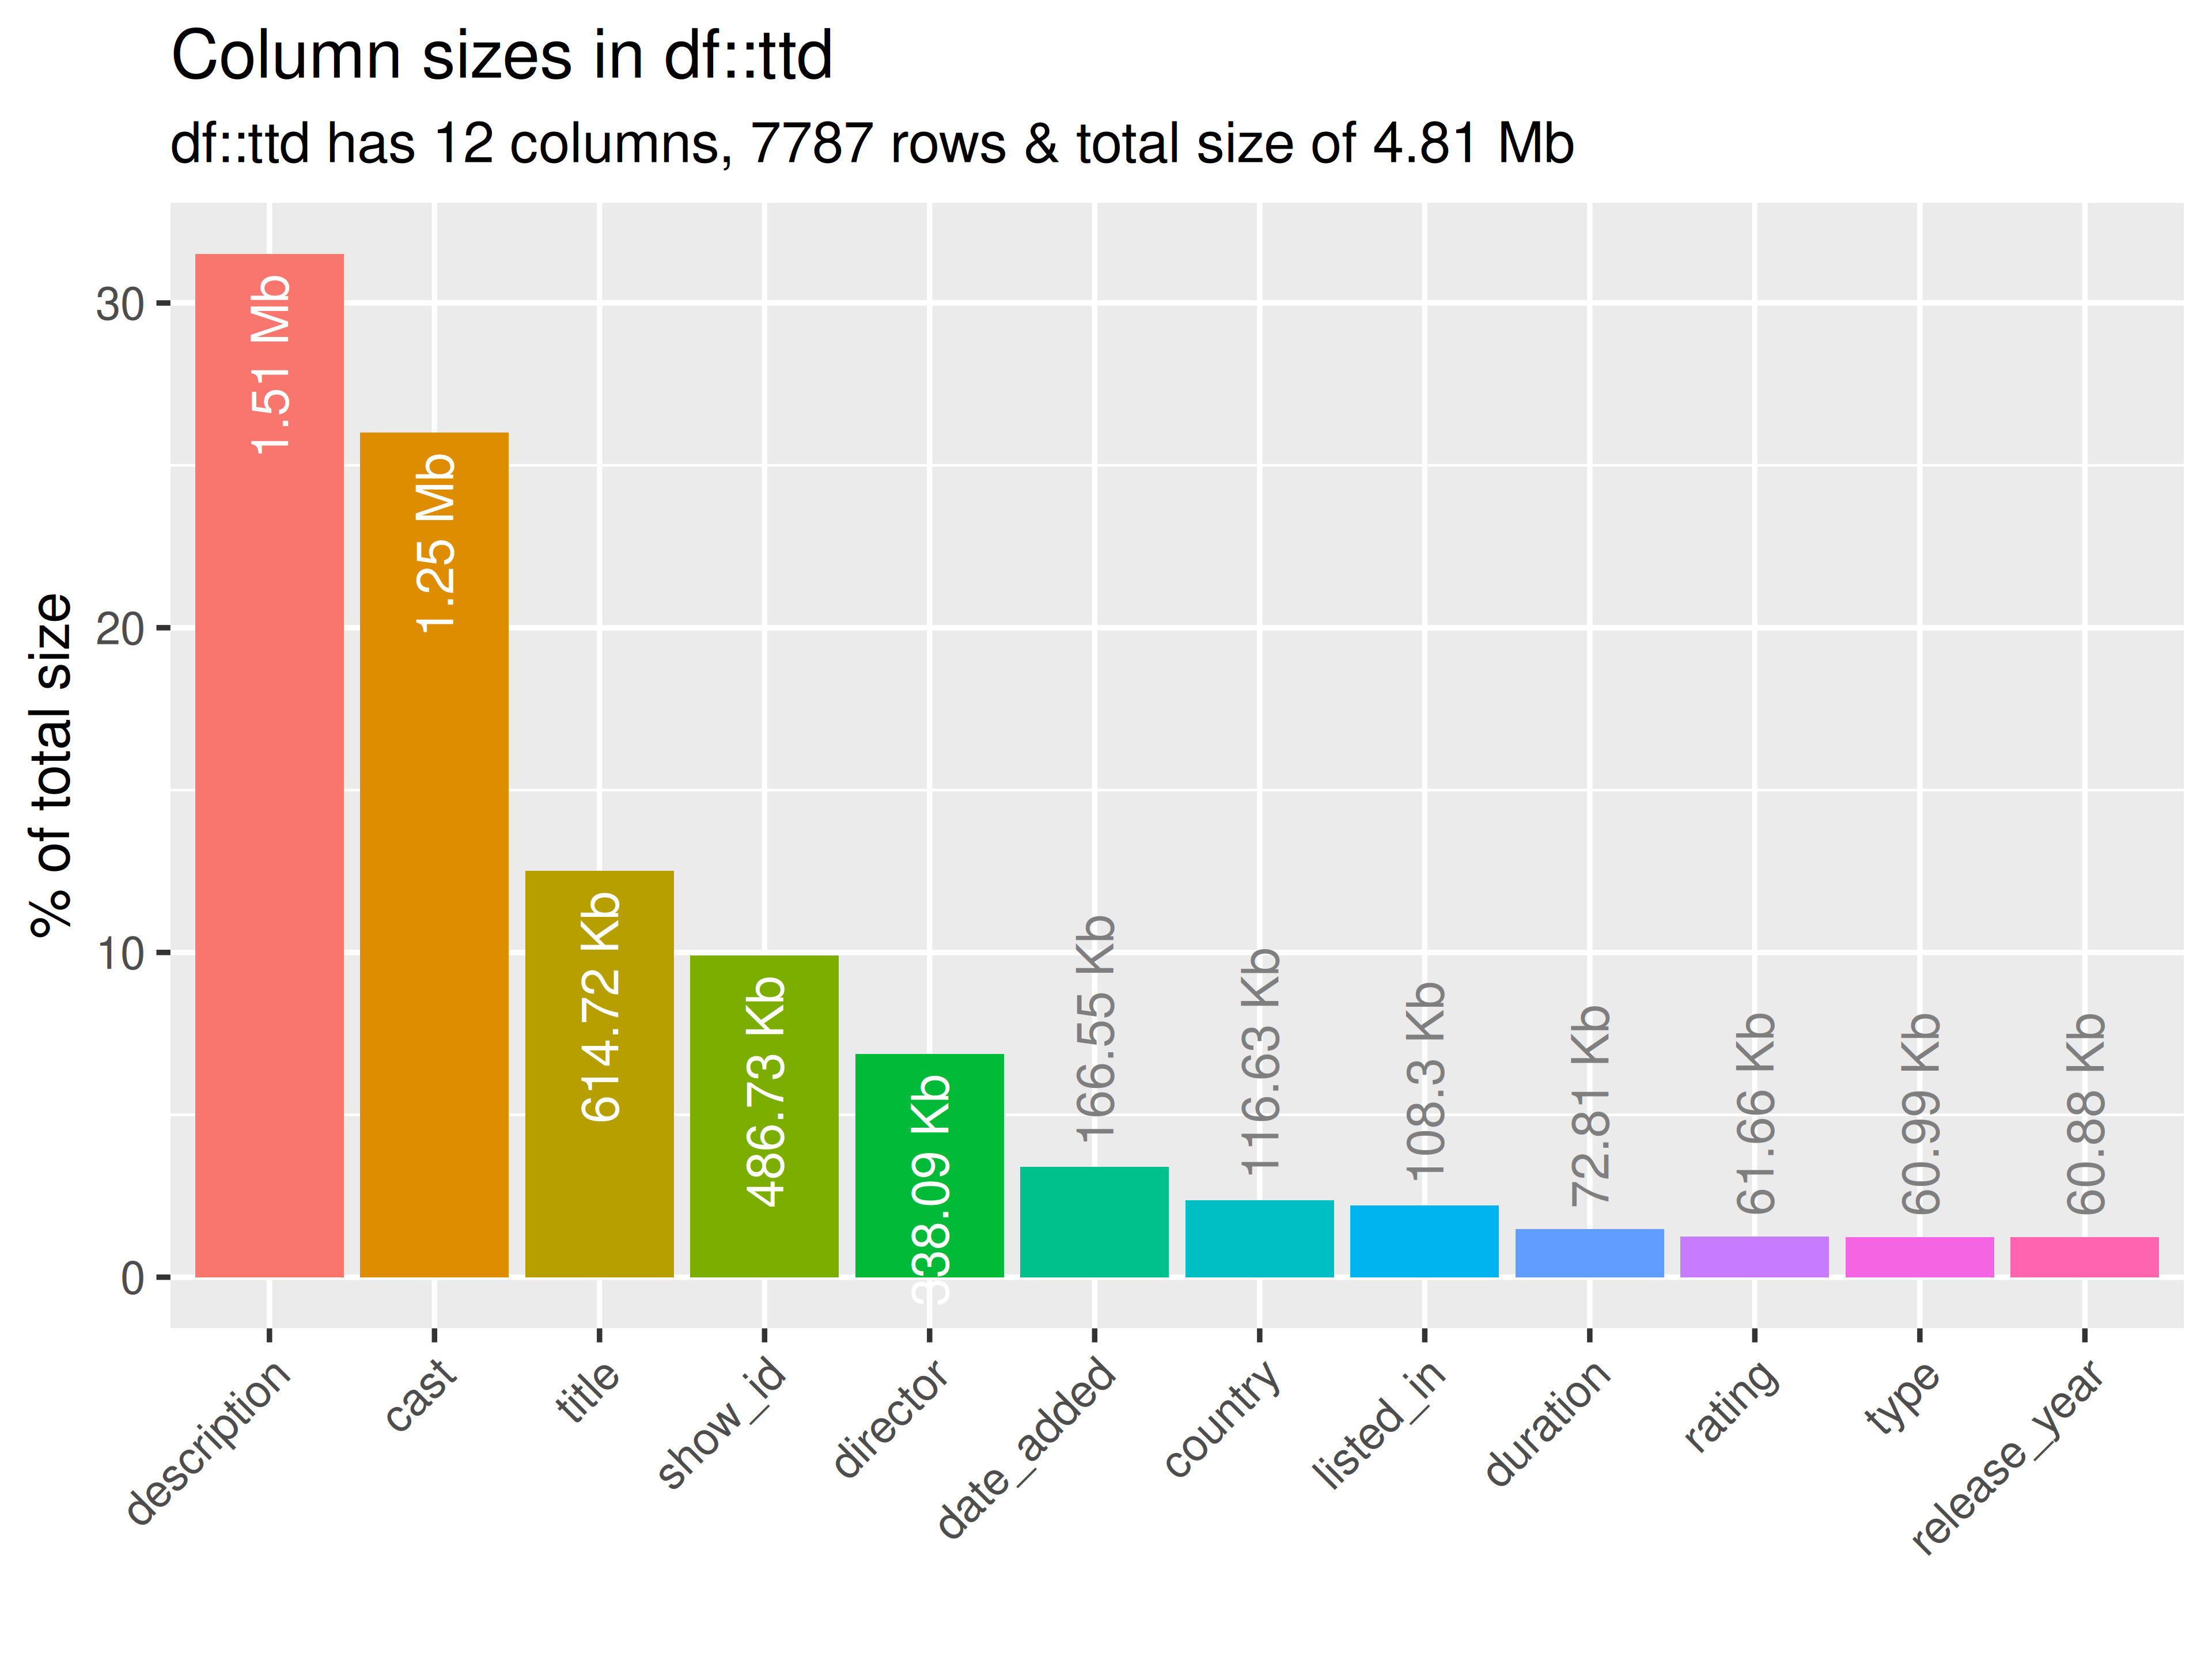
inspect_plot(
  ttd = list("netflix_titles.csv" = ttd[[1]]),
  plots = "mem"
  )
#> INFO [2026-05-28 13:46:19] inspect_plot(): starting analysis
#> INFO [2026-05-28 13:46:19] Beginning plot type 'mem'
#> SUCCESS [2026-05-28 13:46:19] Completed plot type 'mem'
#> SUCCESS [2026-05-28 13:46:19] inspect_plot(): all requested plots finished
#> NULL
if (length(ttd) == 2)
If two datasets in ttd:
inspectdf::inspect_mem(
  df1 = ttd2[[1]],
  df2 = ttd2[[2]]) |>
  inspectdf::show_plot(text_labels = TRUE)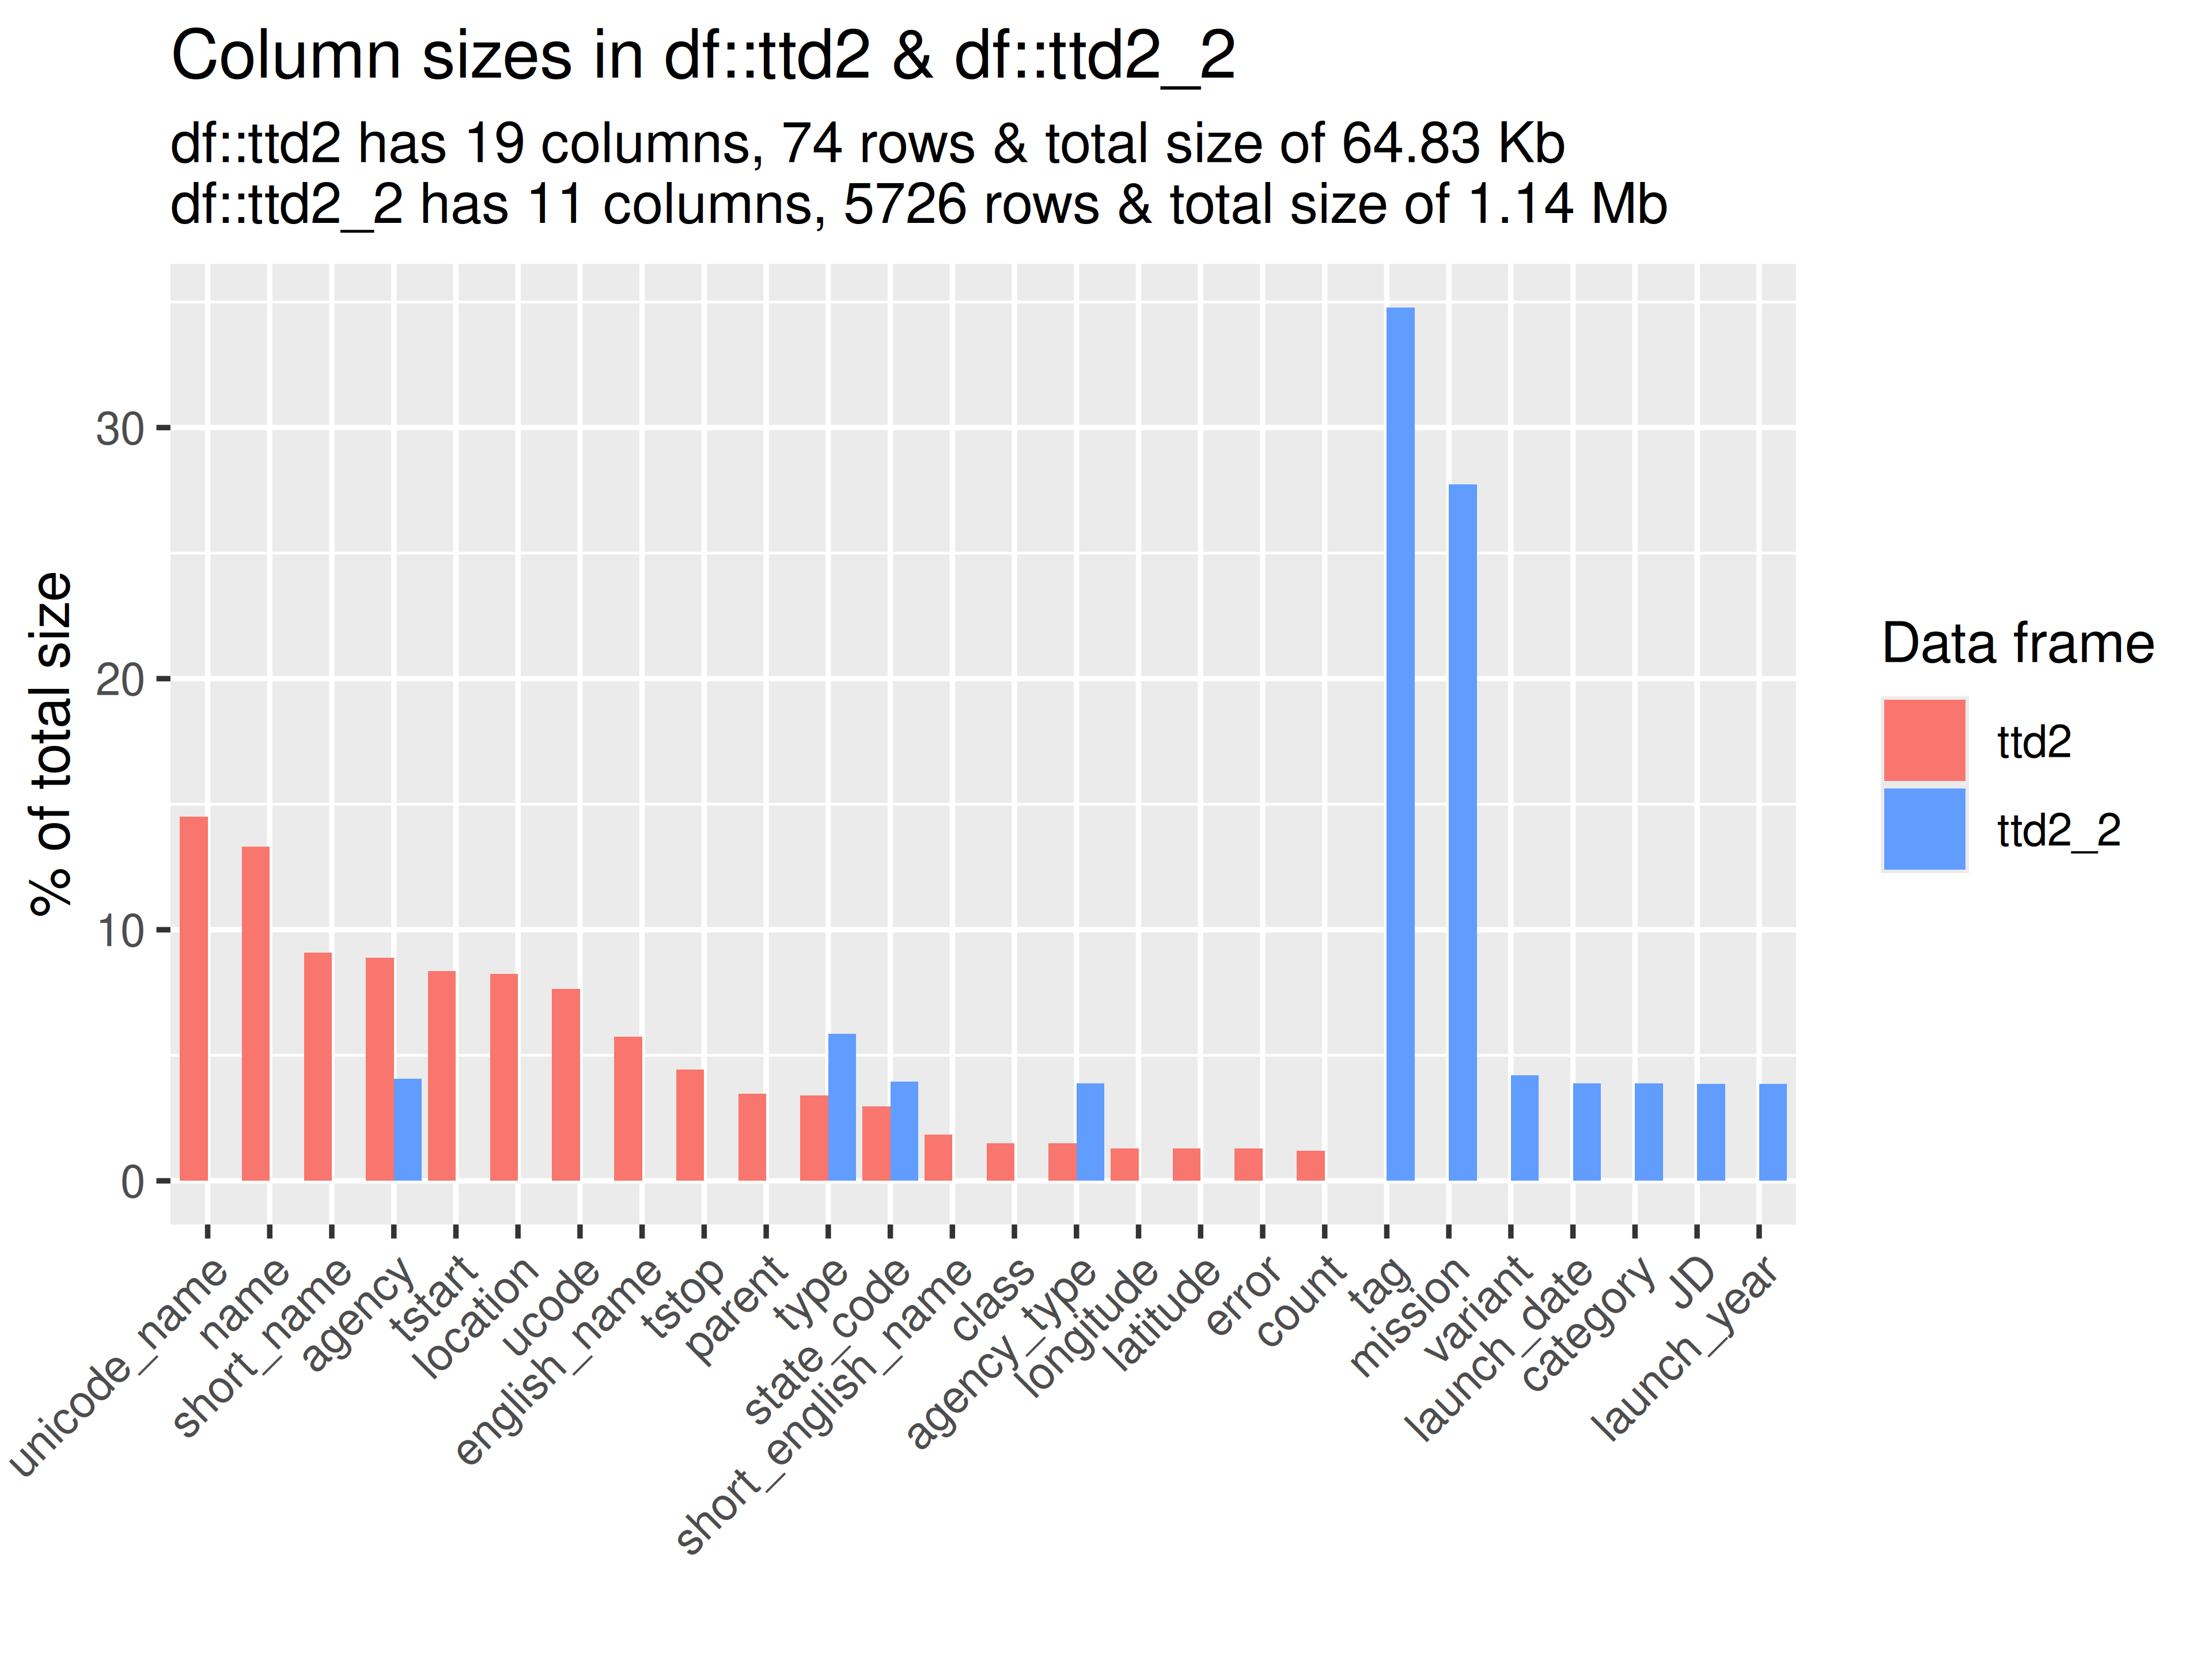
inspect_plot(
  ttd = list(
    "agencies.csv" = ttd2[[1]],
    "launches.csv" = ttd2[[2]]
    ),
  plots = "mem")
#> INFO [2026-05-28 13:46:22] inspect_plot(): starting analysis
#> INFO [2026-05-28 13:46:22] Beginning plot type 'mem'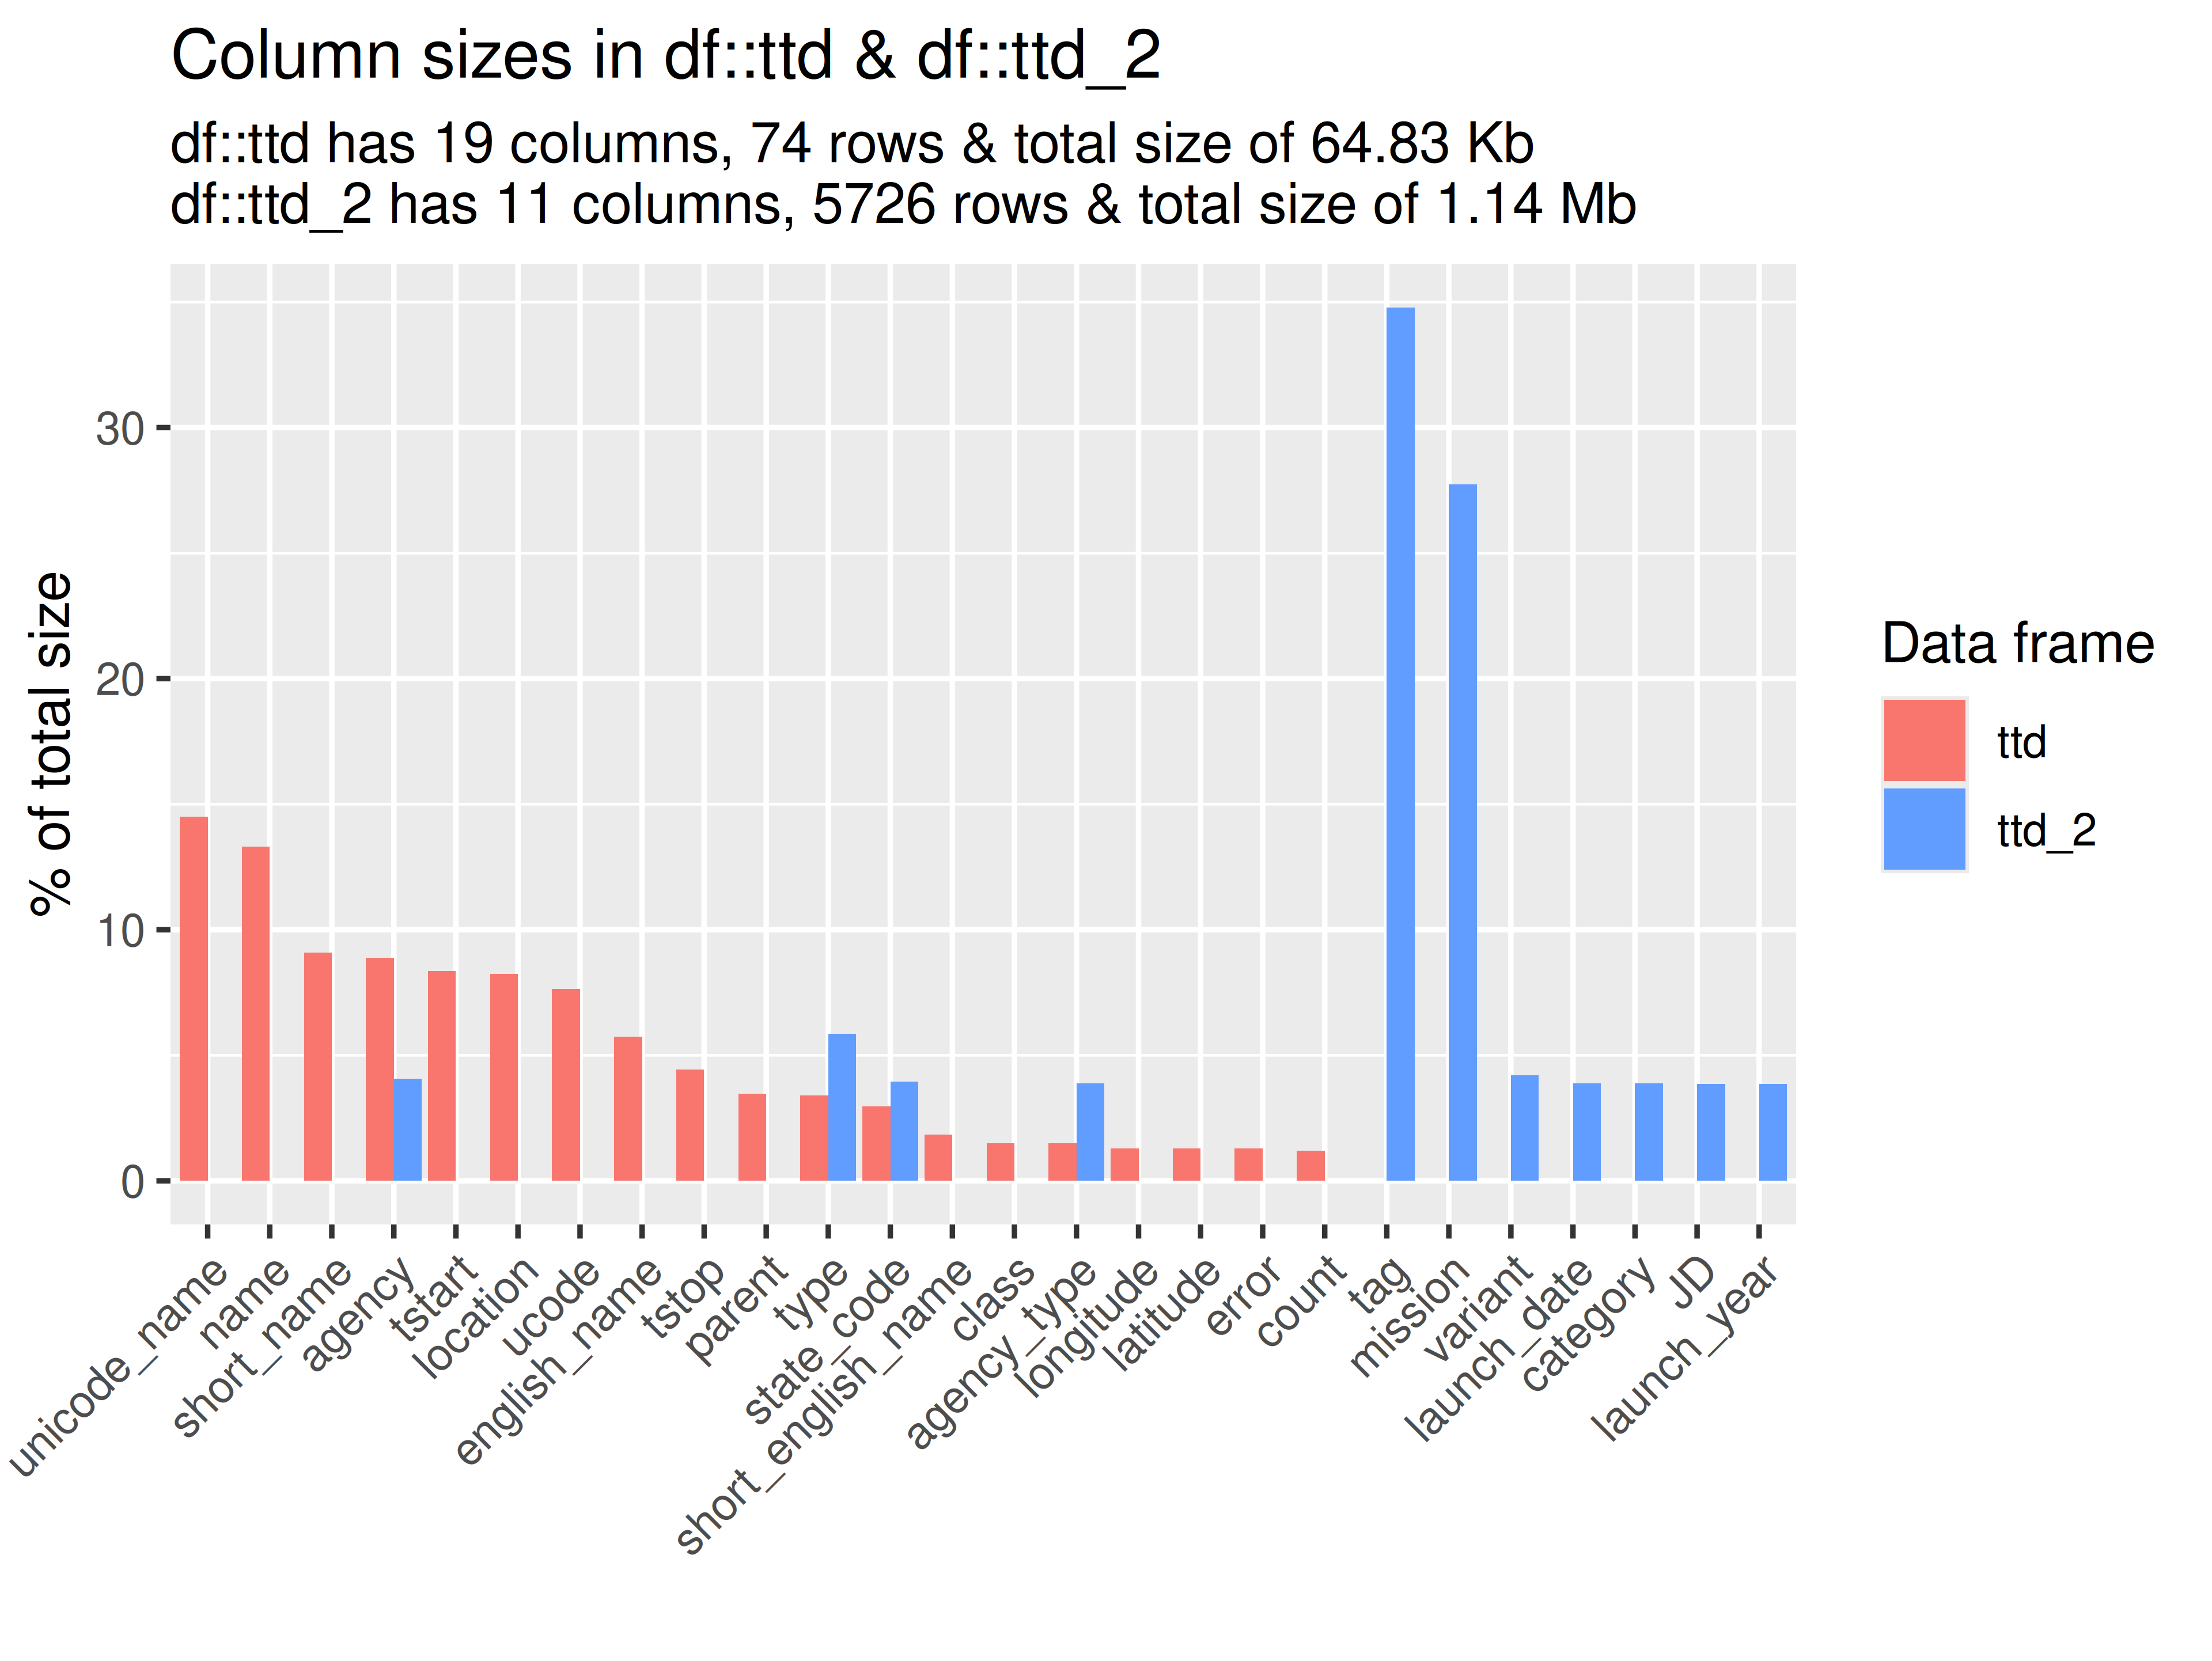
#> SUCCESS [2026-05-28 13:46:22] Completed plot type 'mem'
#> SUCCESS [2026-05-28 13:46:22] inspect_plot(): all requested plots finished
#> NULL
if (length(ttd) >= 3)
If more than two datasets in ttd:
inspectdf::inspect_mem(
  df1 = ttd3[[1]],
  df2 = NULL
) |>
  inspectdf::show_plot(text_labels = TRUE)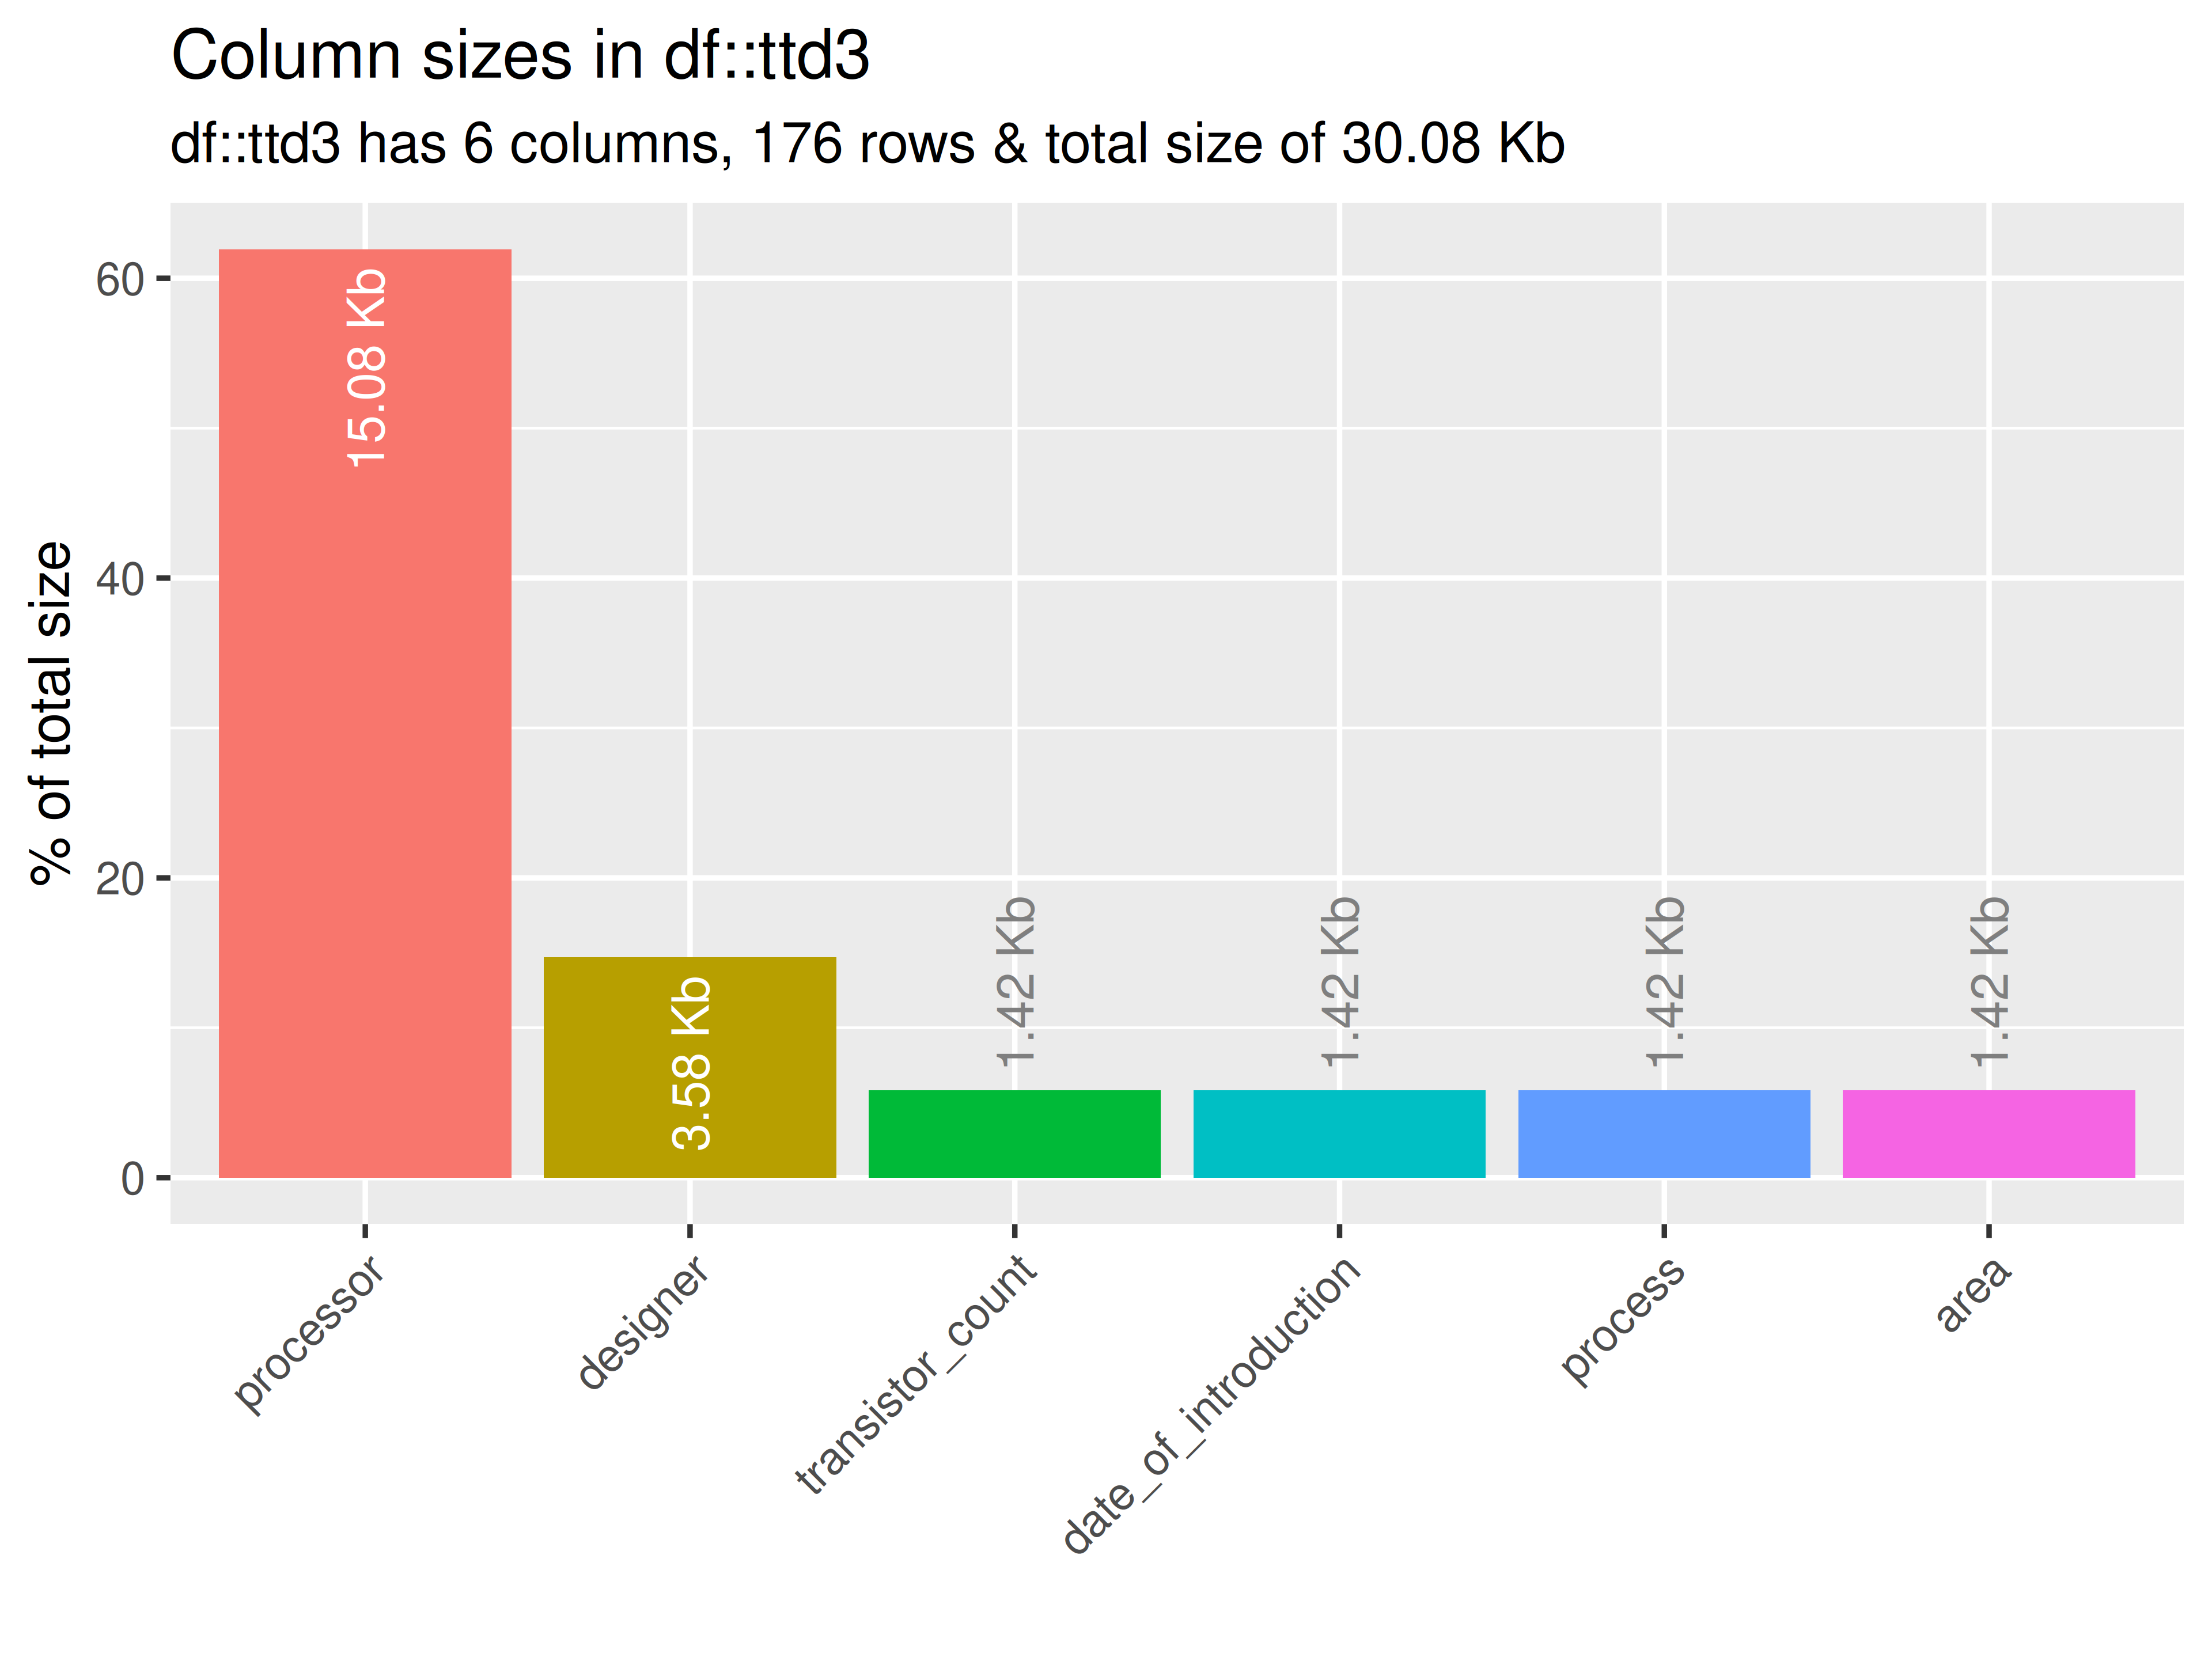
inspect_plot(
  ttd = list("cpu.csv" = ttd3[[1]]),
  plots = "mem"
  )
#> INFO [2026-05-28 13:46:24] inspect_plot(): starting analysis
#> INFO [2026-05-28 13:46:24] Beginning plot type 'mem'
#> SUCCESS [2026-05-28 13:46:24] Completed plot type 'mem'
#> SUCCESS [2026-05-28 13:46:24] inspect_plot(): all requested plots finished
#> NULL
inspectdf::inspect_mem(
  df1 = ttd3[[2]],
  df2 = NULL
) |>
  inspectdf::show_plot(text_labels = TRUE)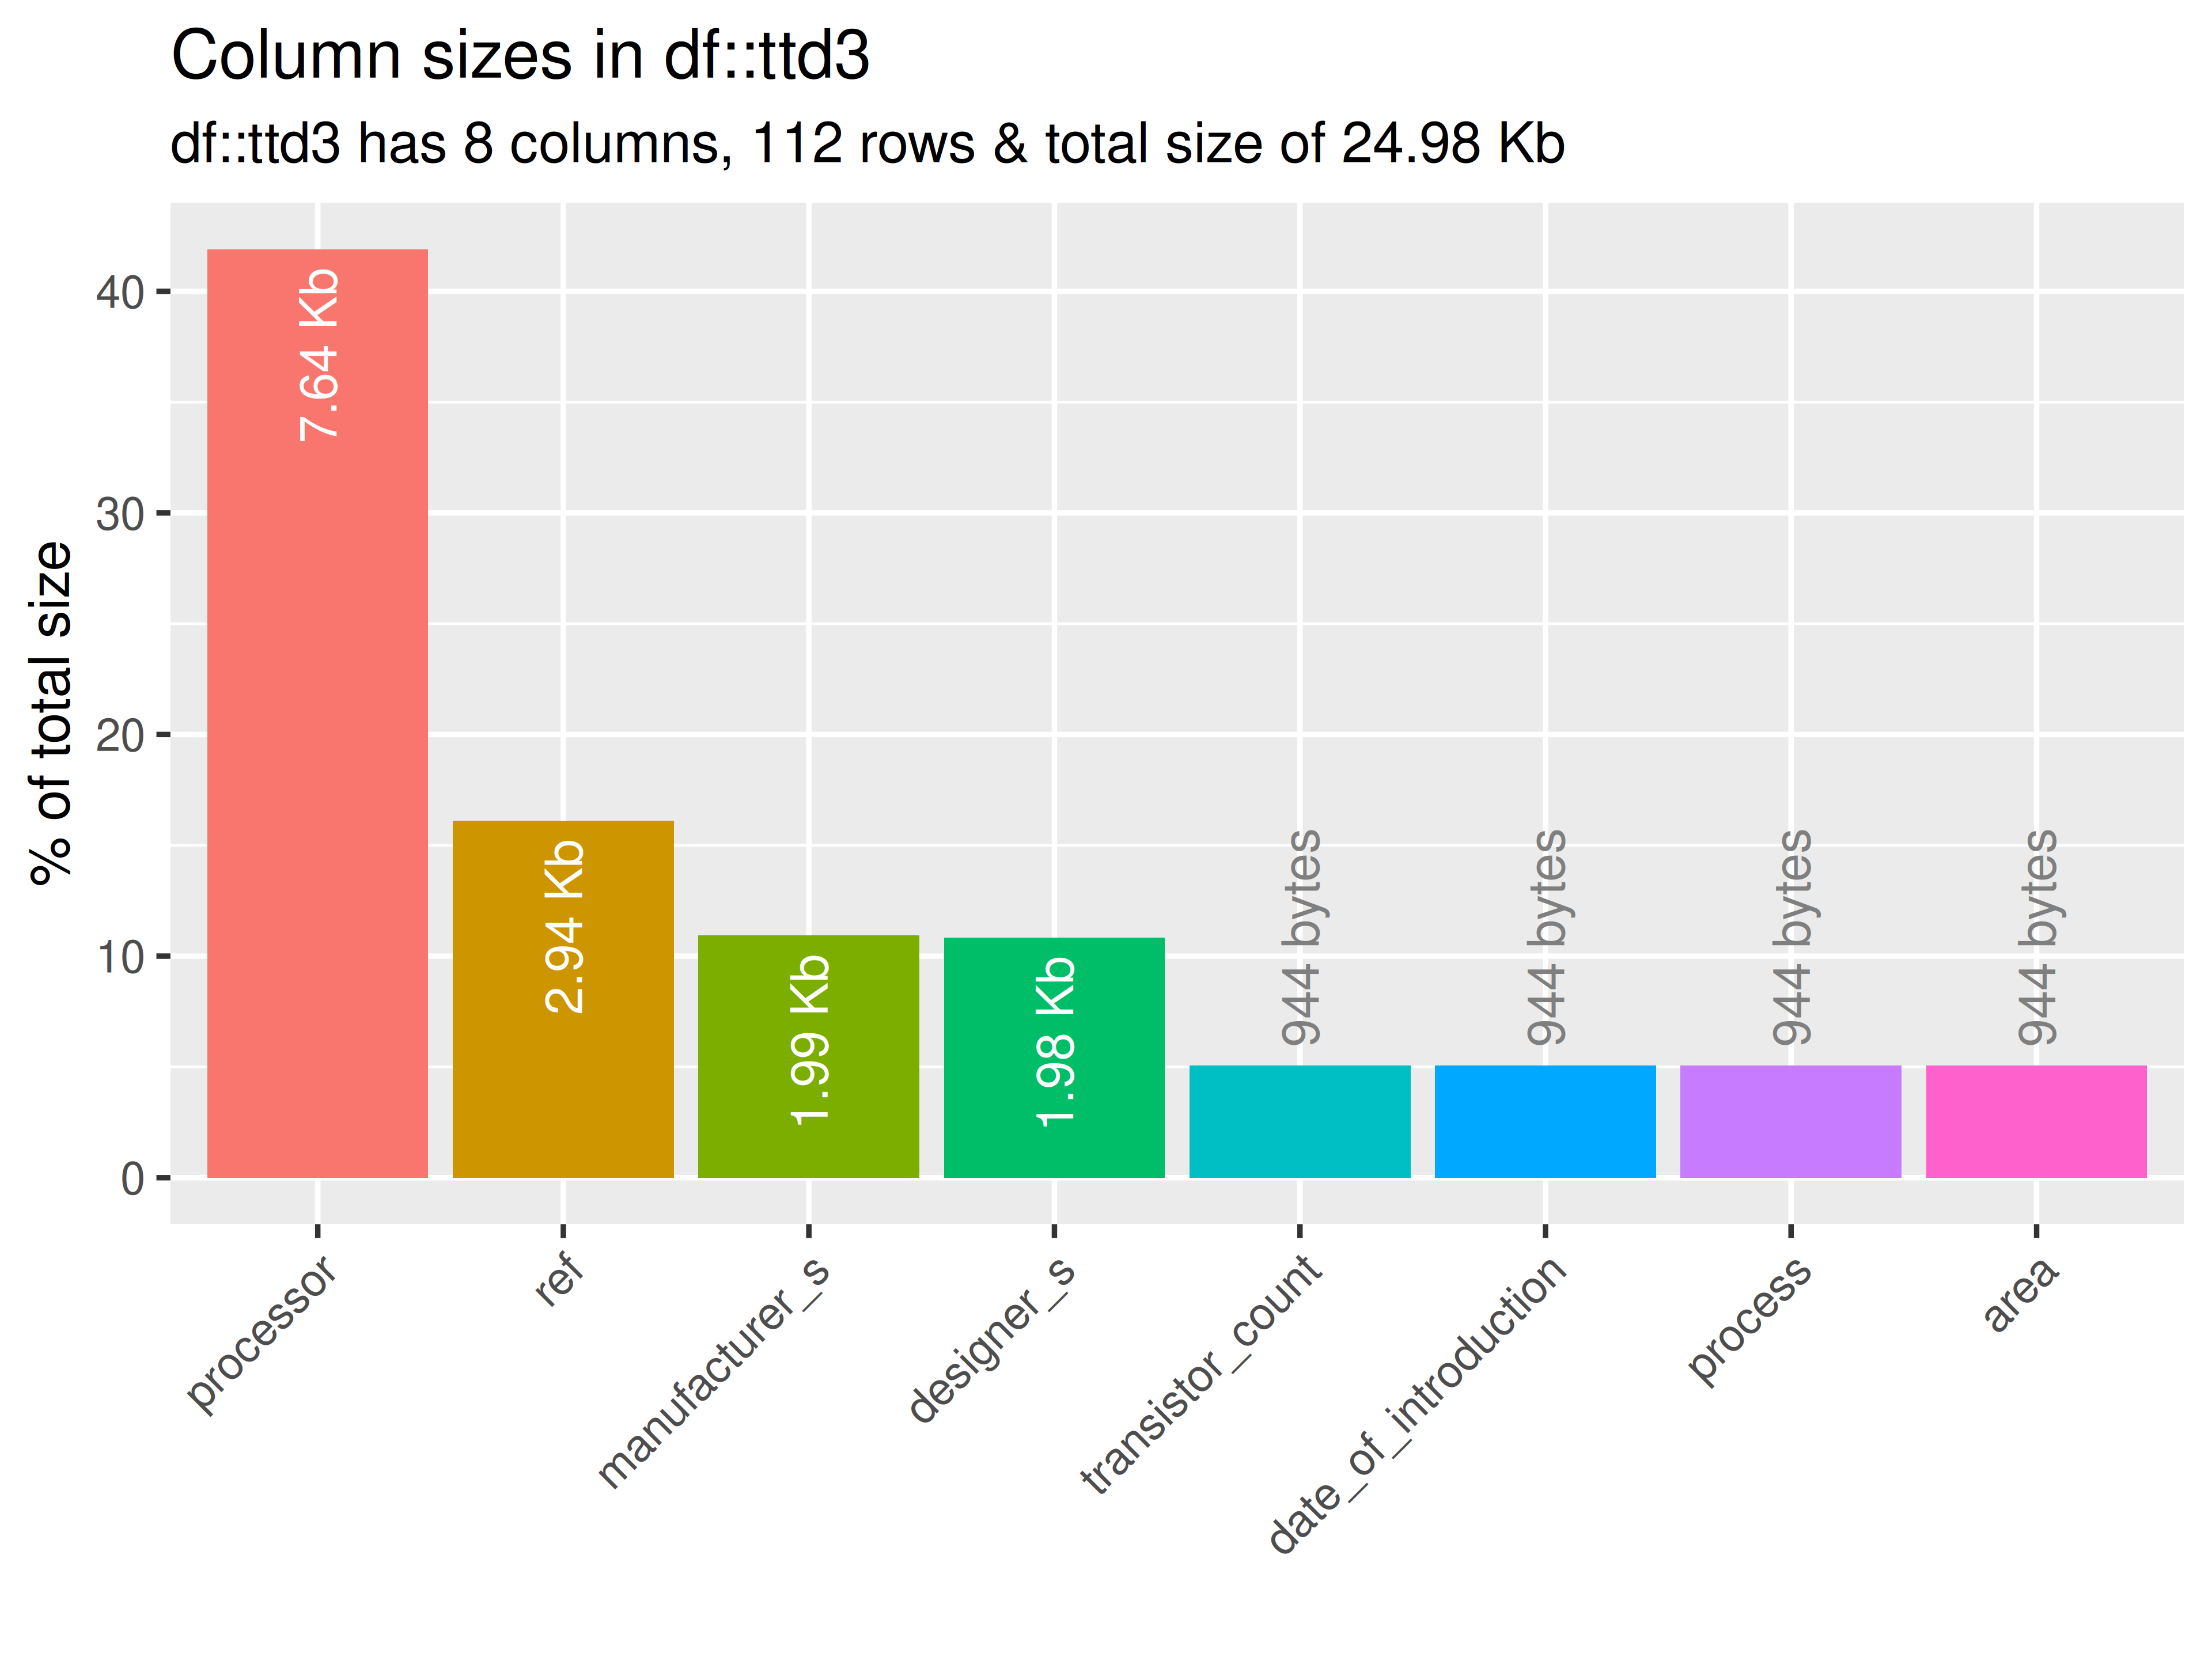
inspect_plot(
  ttd = list("gpu.csv" = ttd3[[2]]),
  plots = "mem"
  )
#> INFO [2026-05-28 13:46:26] inspect_plot(): starting analysis
#> INFO [2026-05-28 13:46:26] Beginning plot type 'mem'
#> SUCCESS [2026-05-28 13:46:26] Completed plot type 'mem'
#> SUCCESS [2026-05-28 13:46:26] inspect_plot(): all requested plots finished
#> NULL
inspectdf::inspect_mem(
  df1 = ttd3[[3]],
  df2 = NULL
) |>
  inspectdf::show_plot(text_labels = TRUE)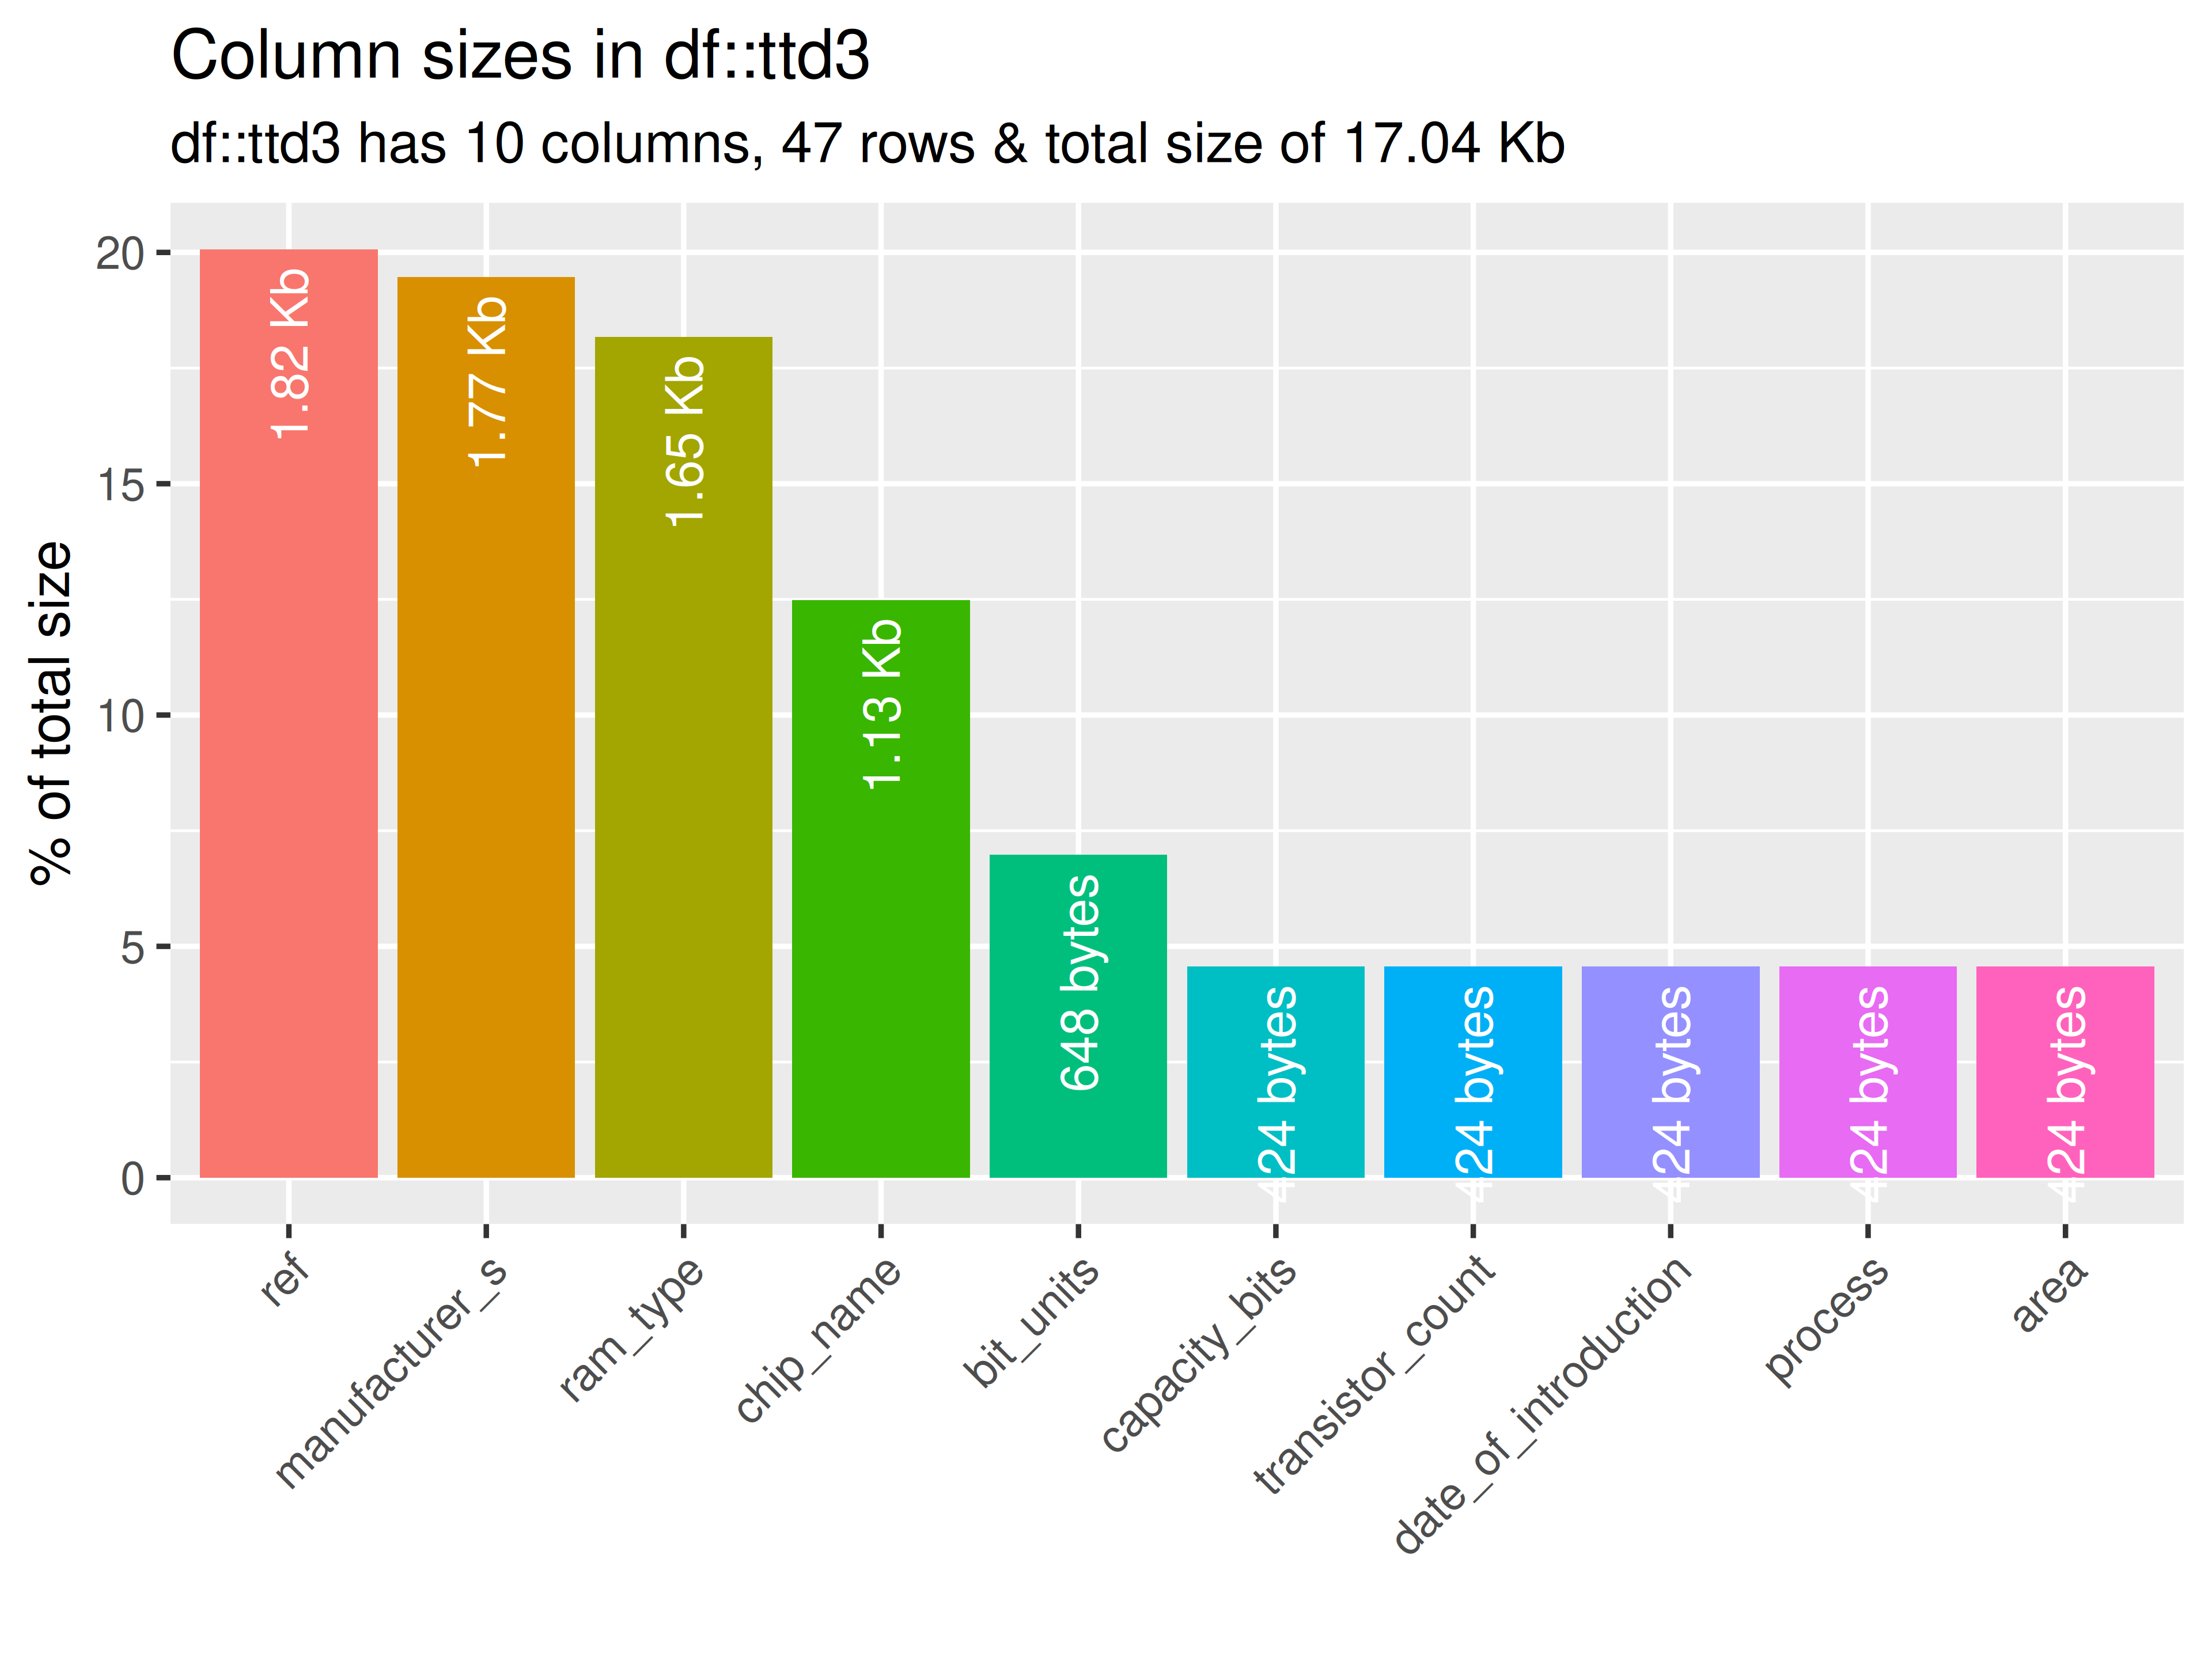
# ... for all datasets in ttd list
inspect_plot(
  ttd = list("ram.csv" = ttd3[[3]]),
  plots = "mem"
  )
#> INFO [2026-05-28 13:46:28] inspect_plot(): starting analysis
#> INFO [2026-05-28 13:46:28] Beginning plot type 'mem'
#> SUCCESS [2026-05-28 13:46:28] Completed plot type 'mem'
#> SUCCESS [2026-05-28 13:46:28] inspect_plot(): all requested plots finished
#> NULL
inspect_cor()
if (length(ttd) == 1)
If one dataset in ttd:
- check if there are at least 2 numeric columns in the datasets in the
ttdlist- Plot the dataset with at least two numeric columns
if (ttd_length(ttd2) == 2) { # check for two datasets
  # check for two numerical columns in ttd[[1]]
  if (length(check_ttd_num_cols(ttd = ttd2)[[1]]) == 2) {
    # plot first dataset
    inspectdf::inspect_cor(
      df1 = ttd2[[1]],
      df2 = NULL,
      method = "pearson",
      with_col = NULL,
      alpha = 0.05
    ) |>
      inspectdf::show_plot(text_labels = TRUE)
    # check for two numerical columns in ttd[[2]]
  } else if (length(check_ttd_num_cols(ttd = ttd2)[[2]]) >= 2) {
    # plot second dataset
    inspectdf::inspect_cor(
      df1 = ttd2[[2]],
      df2 = NULL,
      method = "pearson",
      with_col = NULL,
      alpha = 0.05
    ) |>
      inspectdf::show_plot(text_labels = TRUE)
  } else {
    logr_msg("Error", level = "INFO")
  }
}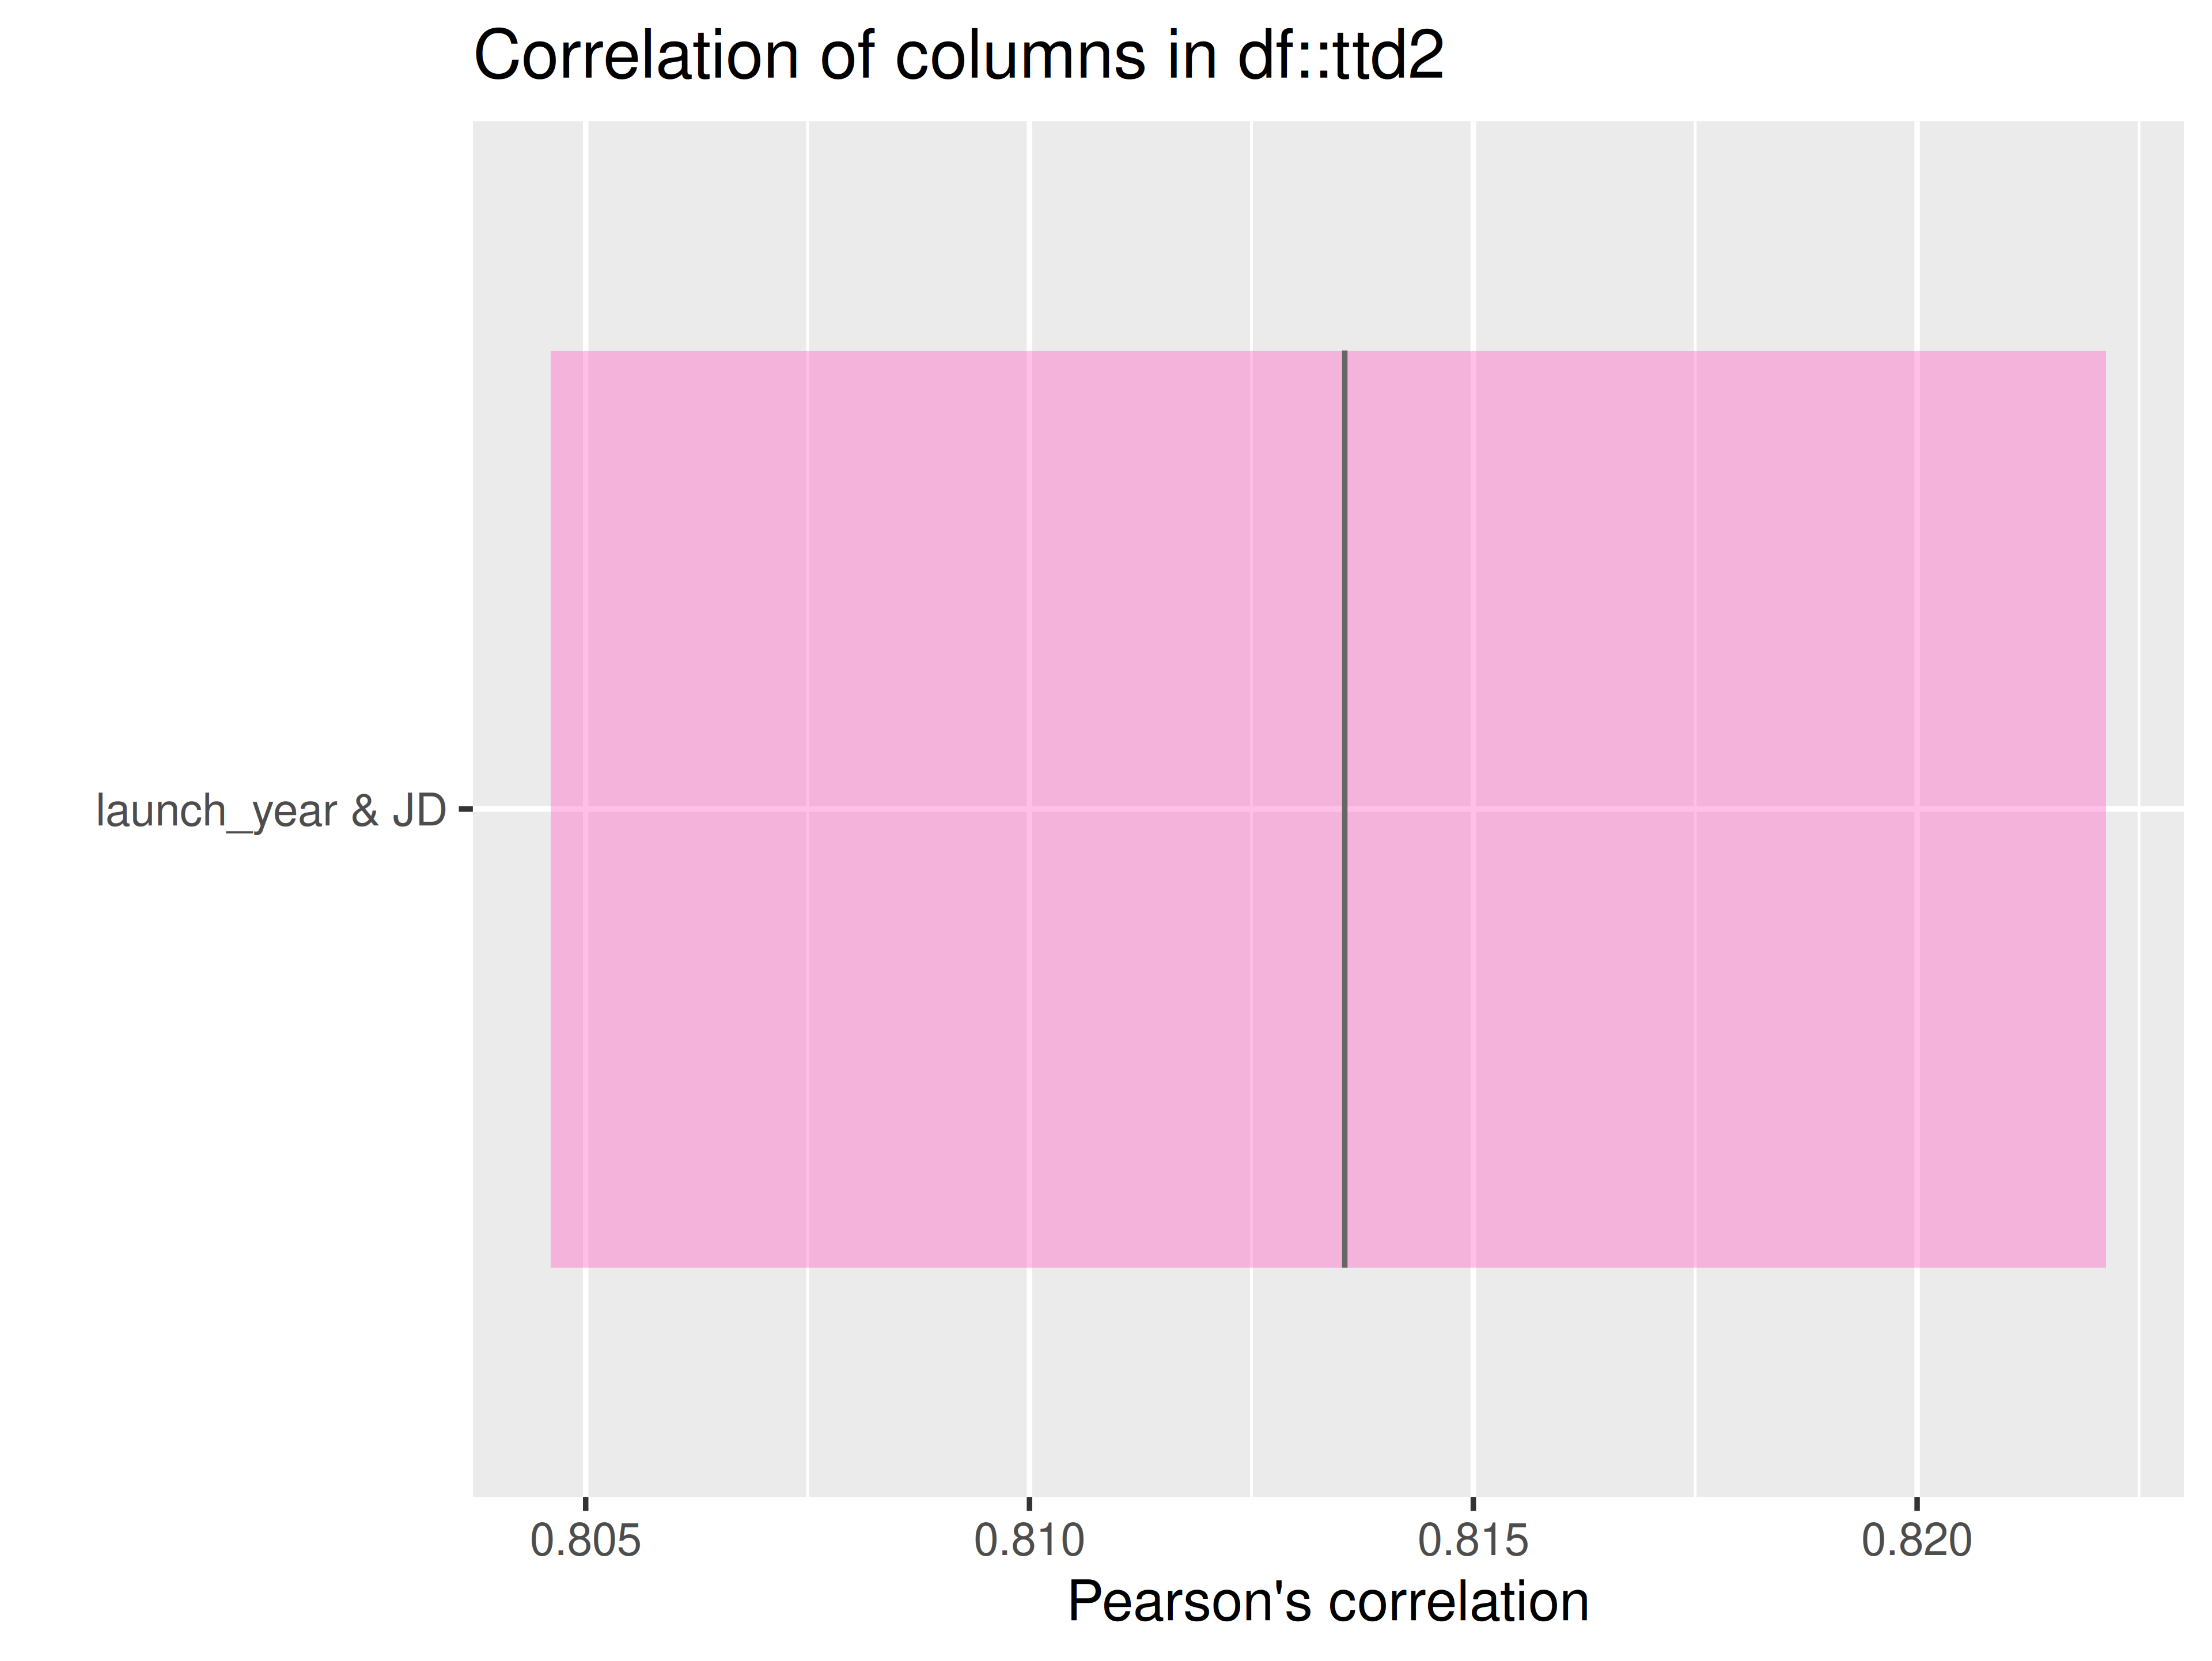
inspect_plot(
  ttd = list(
    "launches.csv" = ttd2[[2]]
    ),
  plots = "cor"
  )
#> INFO [2026-05-28 13:46:30] inspect_plot(): starting analysis
#> INFO [2026-05-28 13:46:30] Beginning plot type 'cor'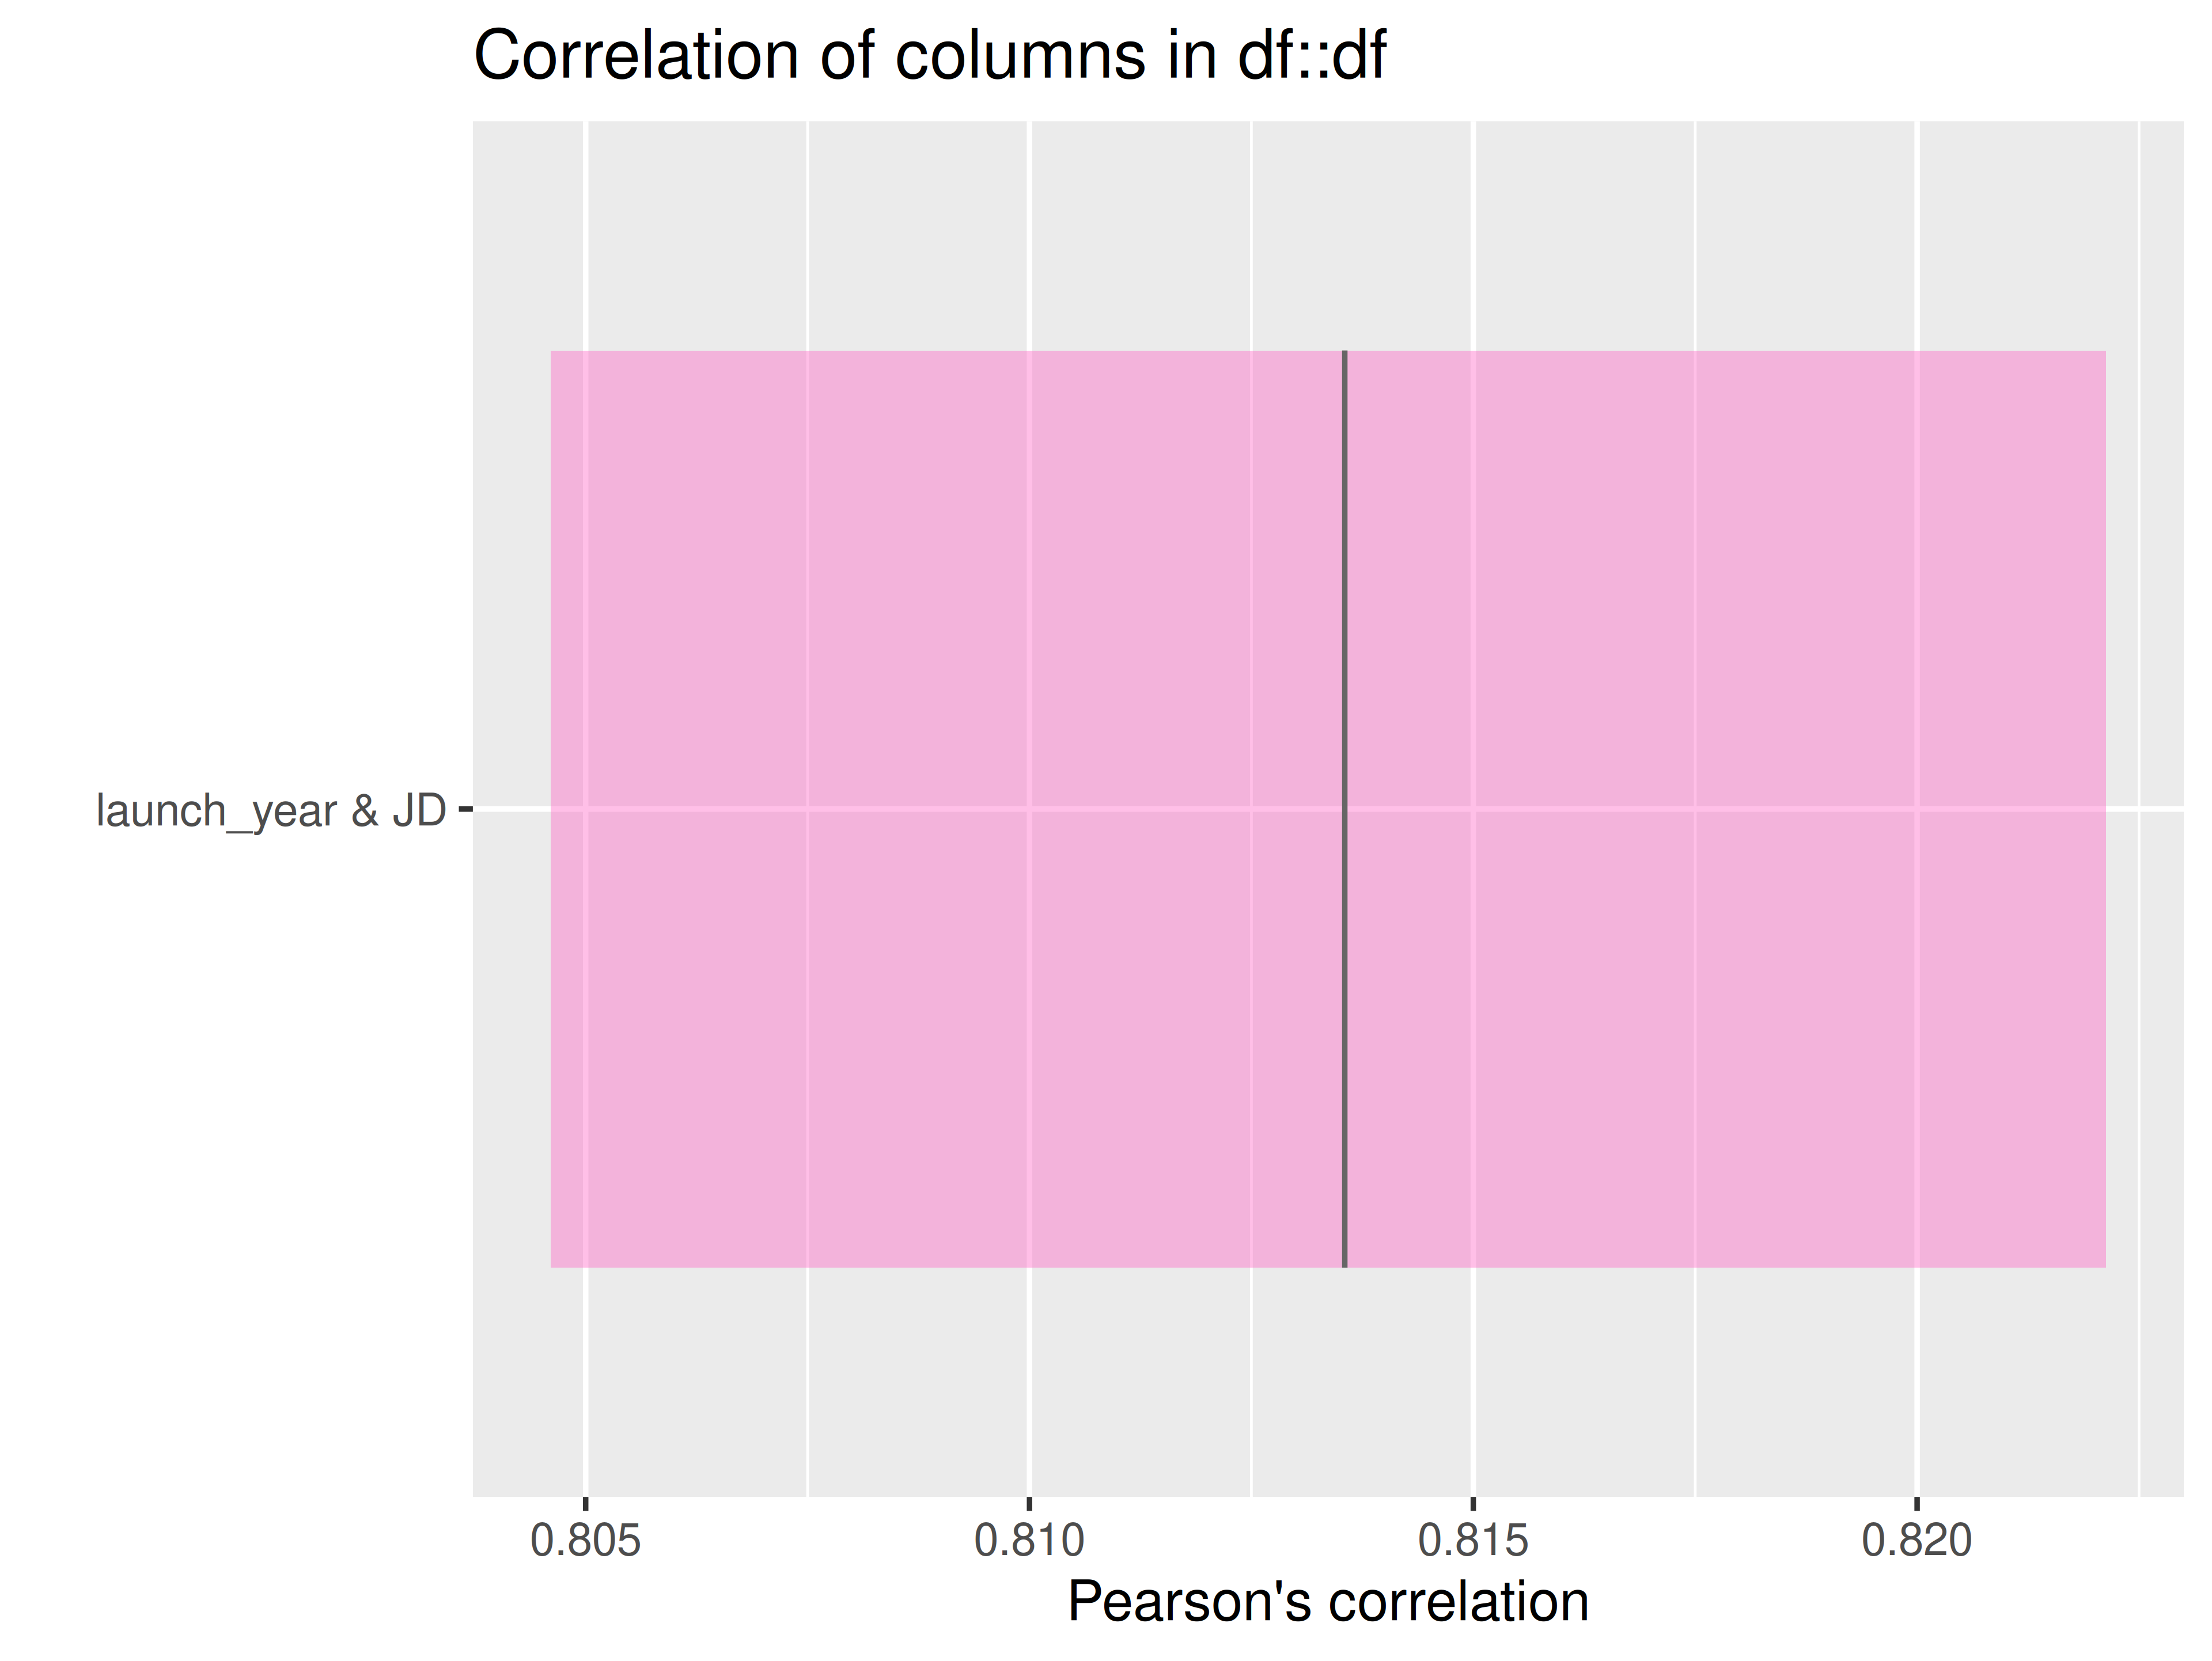
#> SUCCESS [2026-05-28 13:46:30] Completed plot type 'cor'
#> SUCCESS [2026-05-28 13:46:30] inspect_plot(): all requested plots finished
#> NULL
if (length(ttd) == 2)
If two datasets in ttd:
- check if there is at least 1 numeric column in each dataset from the
ttdlist
check_col_types(ttd2, type = "num")
#> $agencies.csv
#> [1] "count"
#>
#> $launches.csv
#> [1] "JD"          "launch_year"
check_col_types(ttd3, type = "num")
#> $cpu.csv
#> [1] "transistor_count"     "date_of_introduction" "process"
#> [4] "area"
#>
#> $gpu.csv
#> [1] "transistor_count"     "date_of_introduction" "process"
#> [4] "area"
#>
#> $ram.csv
#> [1] "capacity_bits"        "transistor_count"     "date_of_introduction"
#> [4] "process" "area"- Run
inspectdf::inspect_cor()if at least one numerical column is in each dataset:
inspectdf::inspect_cor(
  df1 = ttd3[[1]],
  df2 = ttd3[[2]],
  method = "pearson",
  with_col = NULL,
  alpha = 0.05
) |>
  inspectdf::show_plot(text_labels = TRUE)
inspect_plot(
  ttd = list(
    "cpu.csv" = ttd3[[1]],
    "gpu.csv" = ttd3[[2]]
  ),
  plots = "cor"
  )
#> INFO [2026-05-28 13:46:32] inspect_plot(): starting analysis
#> INFO [2026-05-28 13:46:32] Beginning plot type 'cor'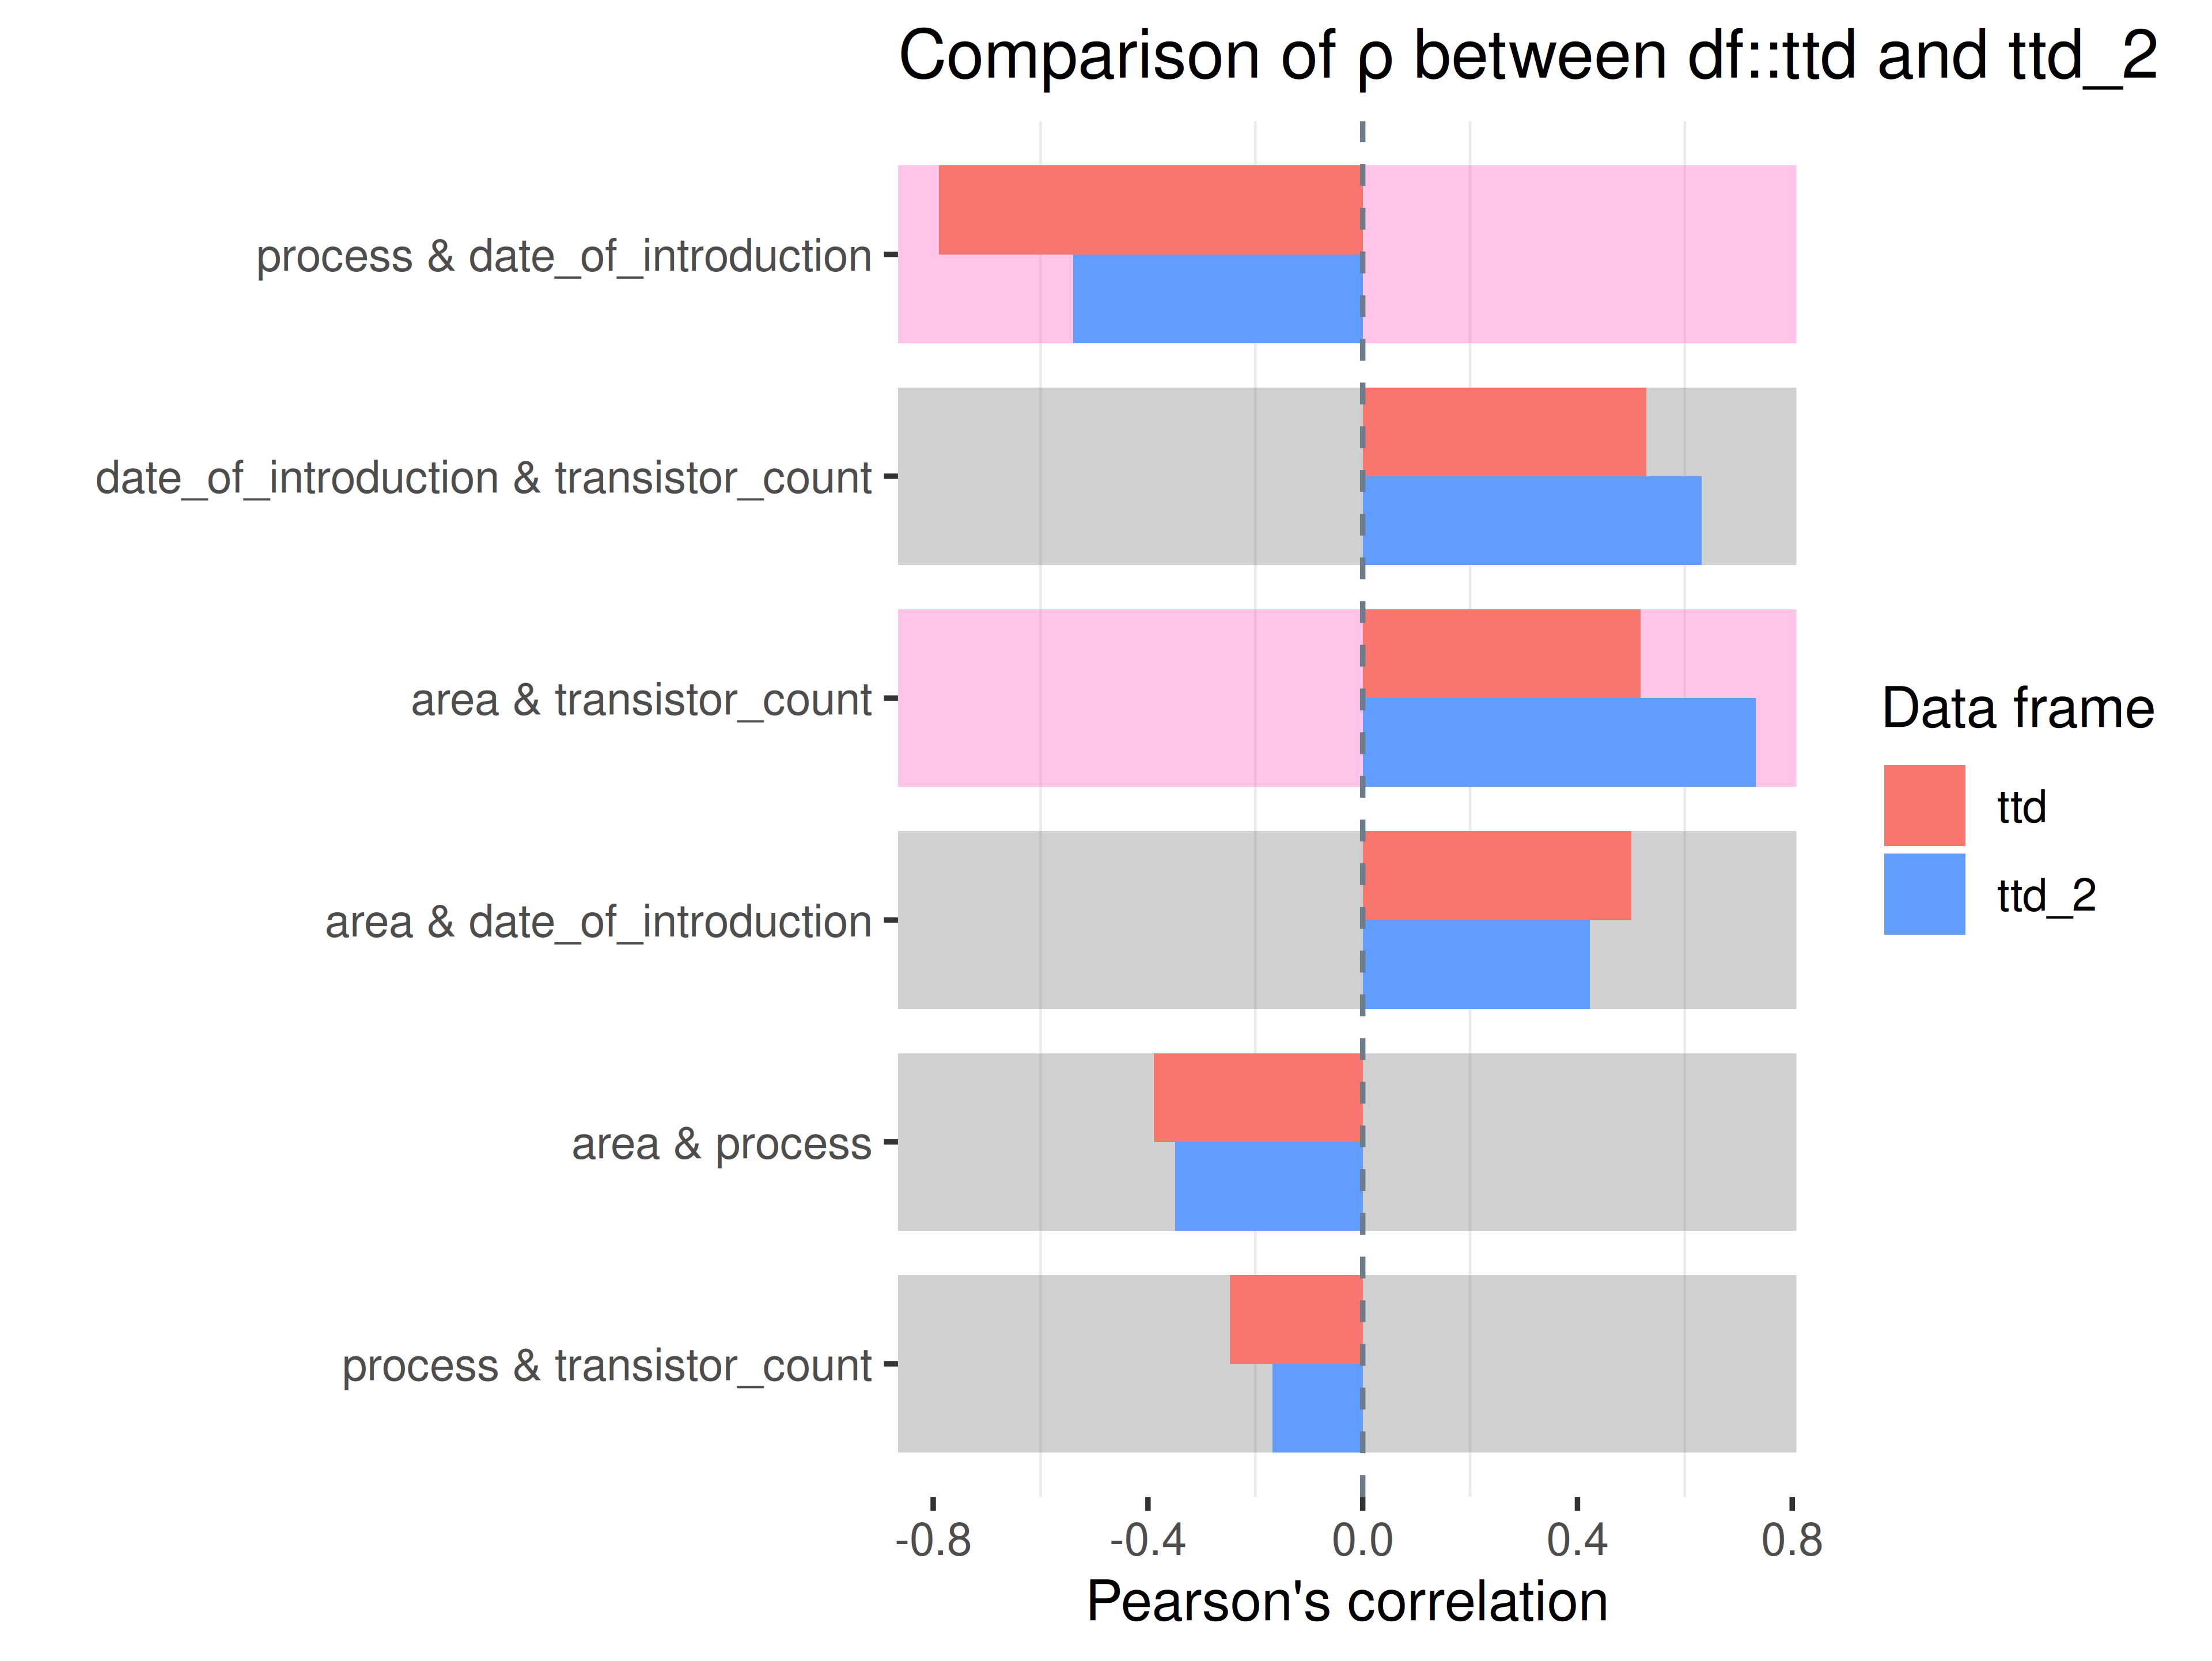
#> SUCCESS [2026-05-28 13:46:32] Completed plot type 'cor'
#> SUCCESS [2026-05-28 13:46:32] inspect_plot(): all requested plots finished
#> NULL
if (length(ttd) >= 3)
If more than two datasets in ttd:
- check if there is at least 1 numeric column in each of the datasets
from the
ttdlist:
check_col_types(ttd3, type = "num")
#> $cpu.csv
#> [1] "transistor_count"     "date_of_introduction" "process"
#> [4] "area"
#>
#> $gpu.csv
#> [1] "transistor_count"     "date_of_introduction" "process"
#> [4] "area"
#>
#> $ram.csv
#> [1] "capacity_bits"        "transistor_count"     "date_of_introduction"
#> [4] "process" "area"- Run the following on all datasets with at least two numerical columns.
inspectdf::inspect_cor(
  df1 = ttd3[[1]],
  df2 = NULL,
  method = "pearson",
  with_col = NULL,
  alpha = 0.05
) |>
  inspectdf::show_plot(text_labels = TRUE)
inspect_plot(
  ttd = list("cpu.csv" = ttd3[[1]]),
  plots = "cor")
#> INFO [2026-05-28 13:46:34] inspect_plot(): starting analysis
#> INFO [2026-05-28 13:46:34] Beginning plot type 'cor'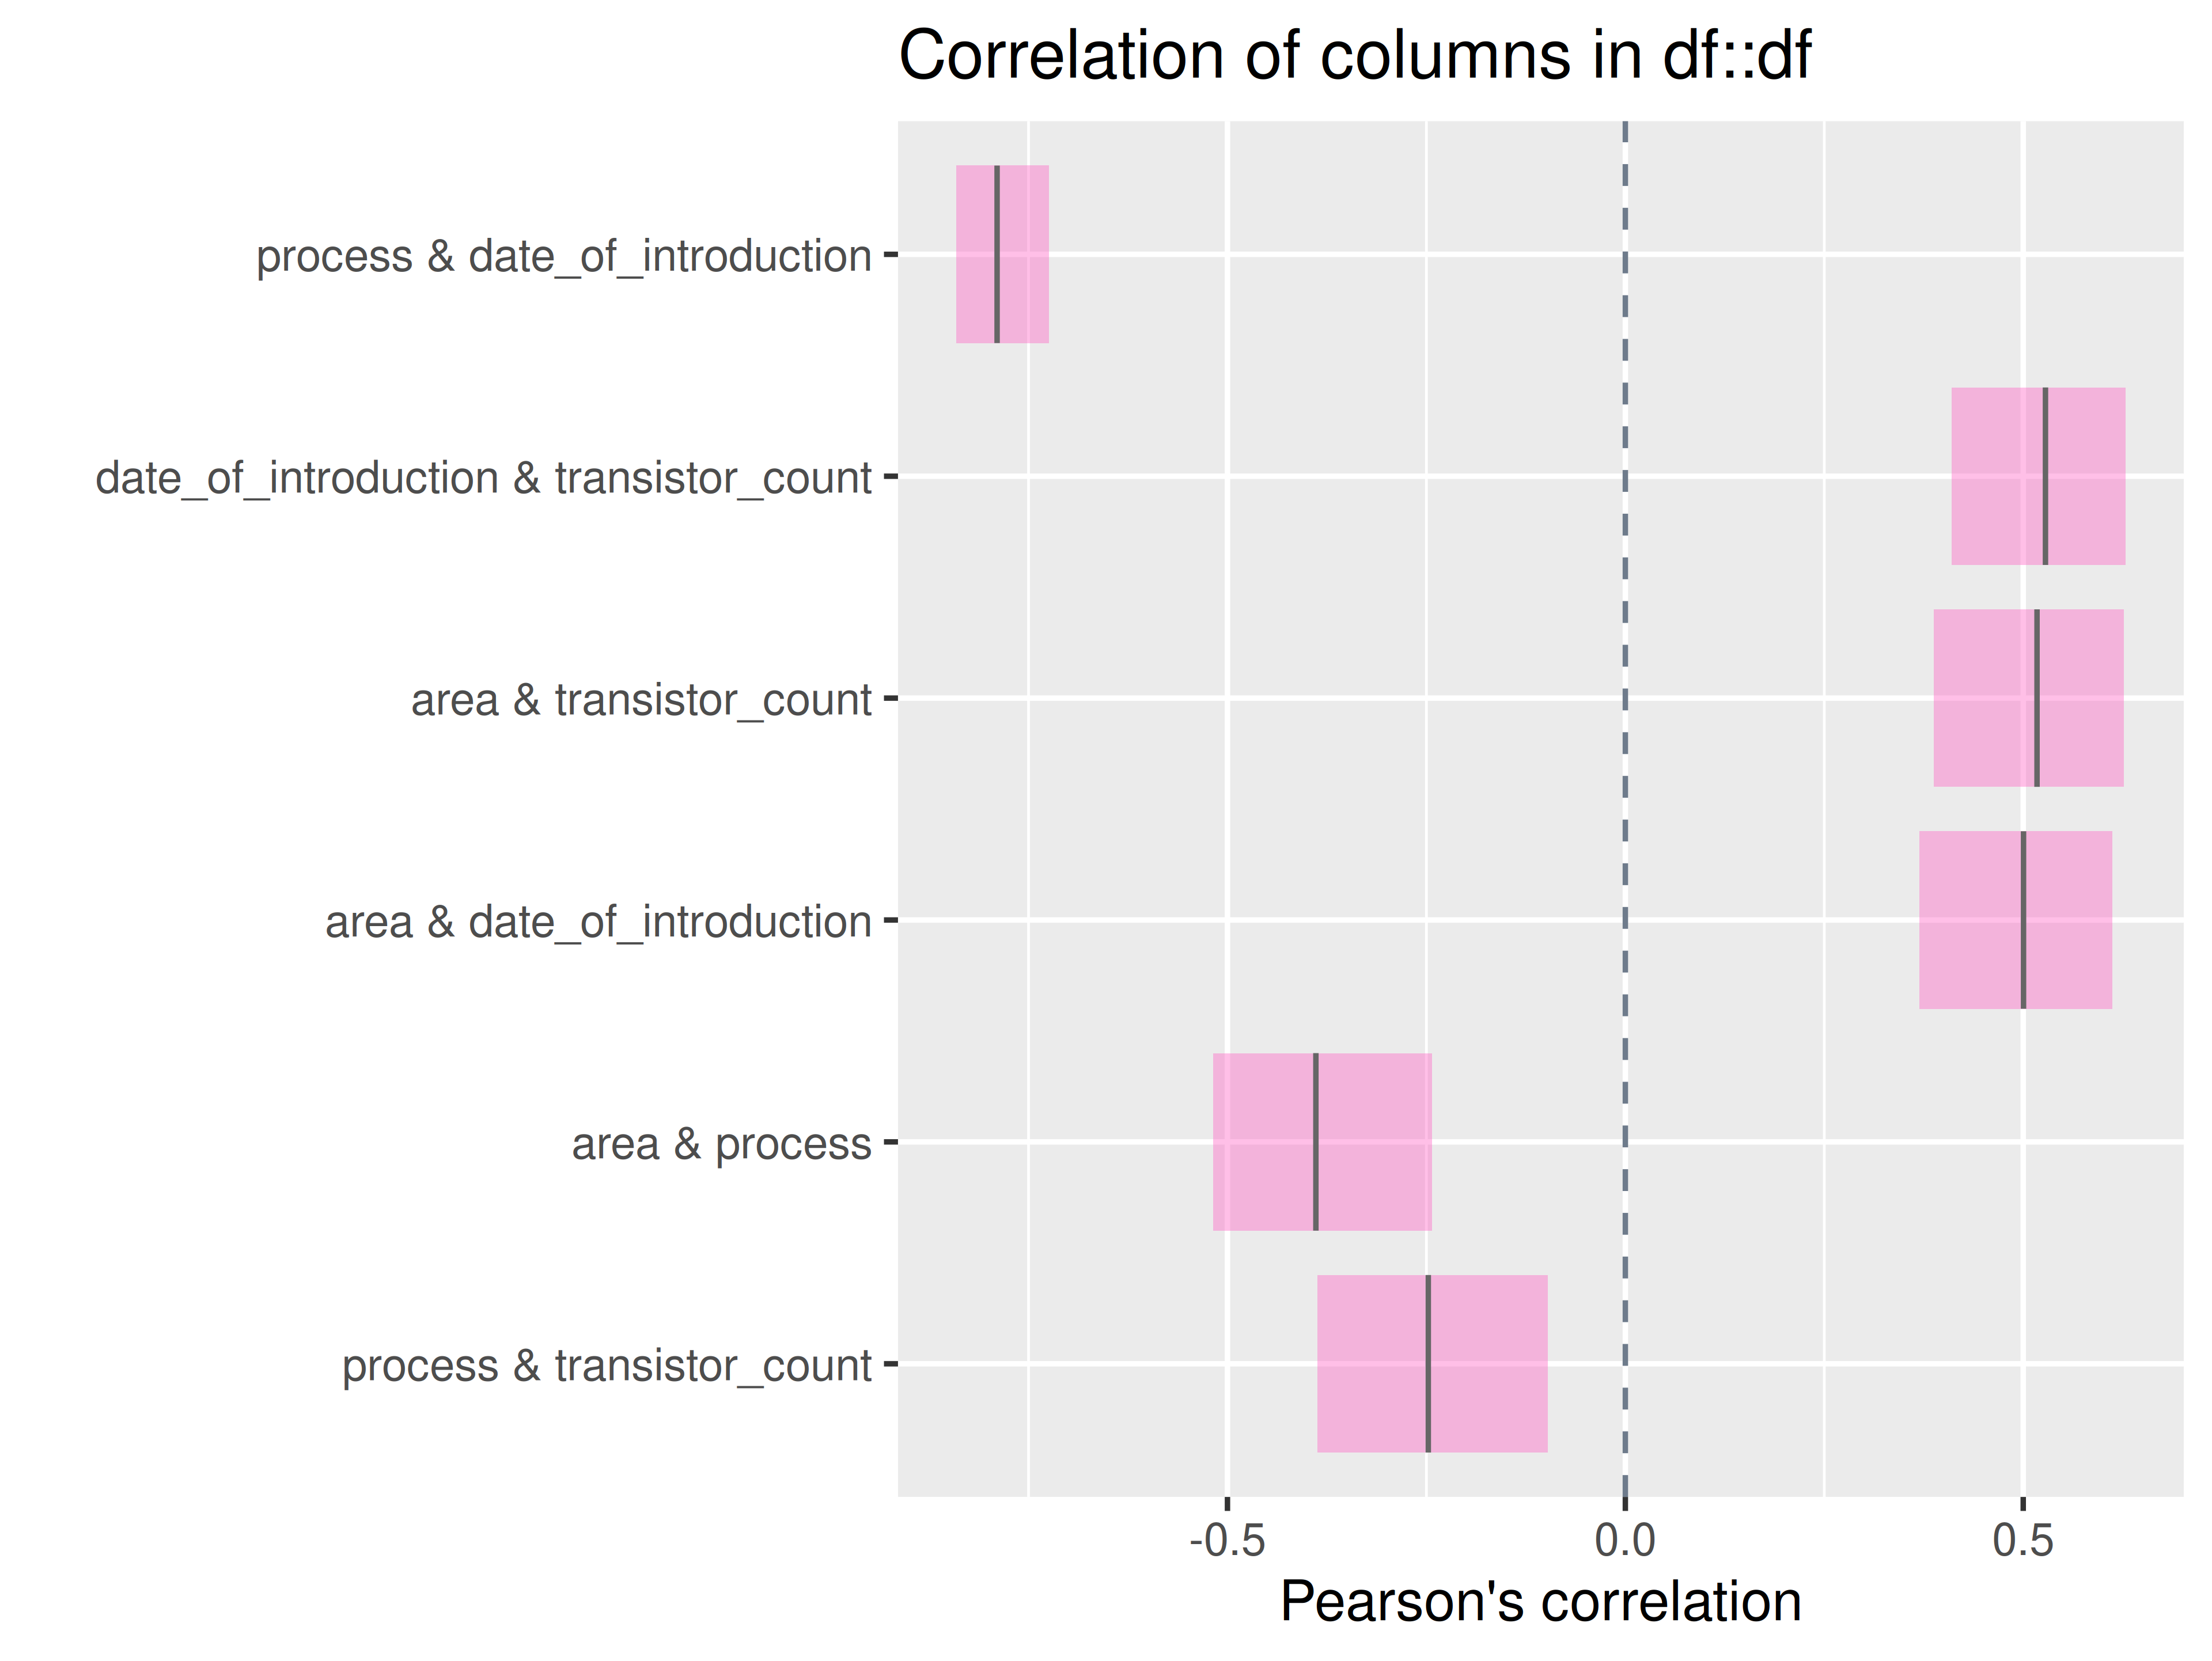
#> SUCCESS [2026-05-28 13:46:34] Completed plot type 'cor'
#> SUCCESS [2026-05-28 13:46:34] inspect_plot(): all requested plots finished
#> NULL
inspectdf::inspect_cor(
  df1 = ttd3[[2]],
  df2 = NULL,
  method = "pearson",
  with_col = NULL,
  alpha = 0.05
) |>
  inspectdf::show_plot(text_labels = TRUE)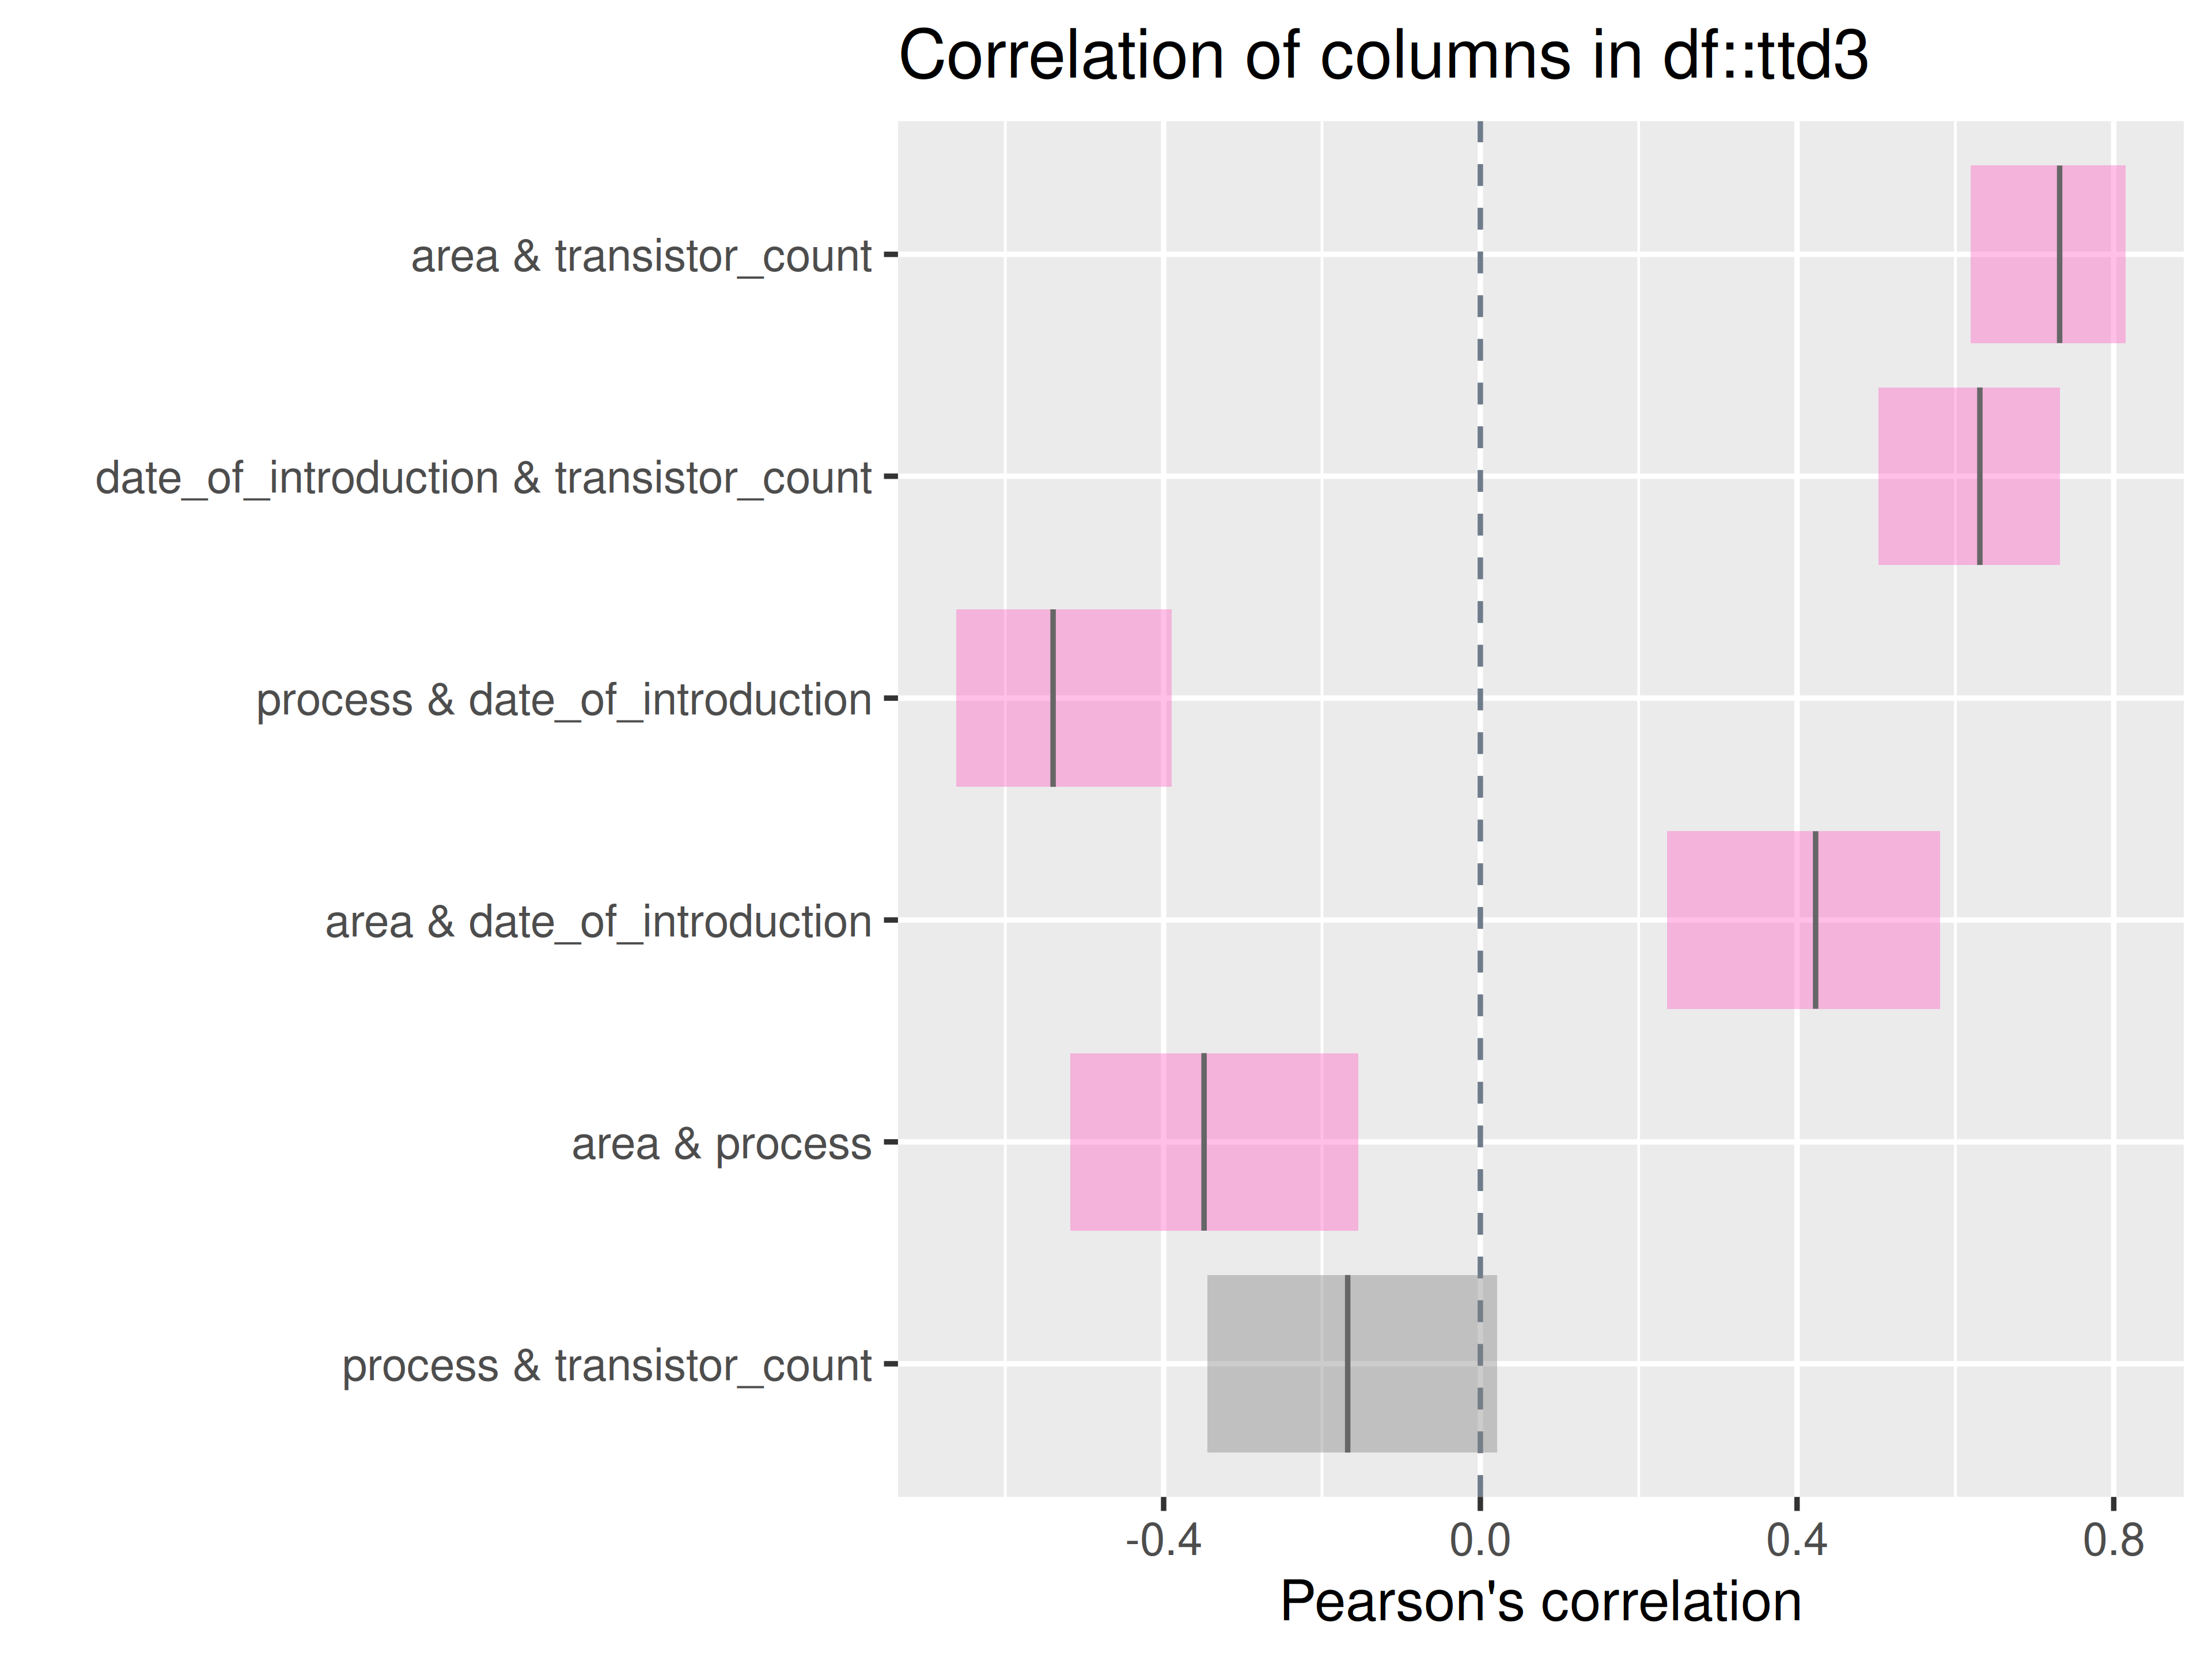
inspect_plot(
  ttd = list("gpu.csv" = ttd3[[2]]),
  plots = "cor")
#> INFO [2026-05-28 13:46:36] inspect_plot(): starting analysis
#> INFO [2026-05-28 13:46:36] Beginning plot type 'cor'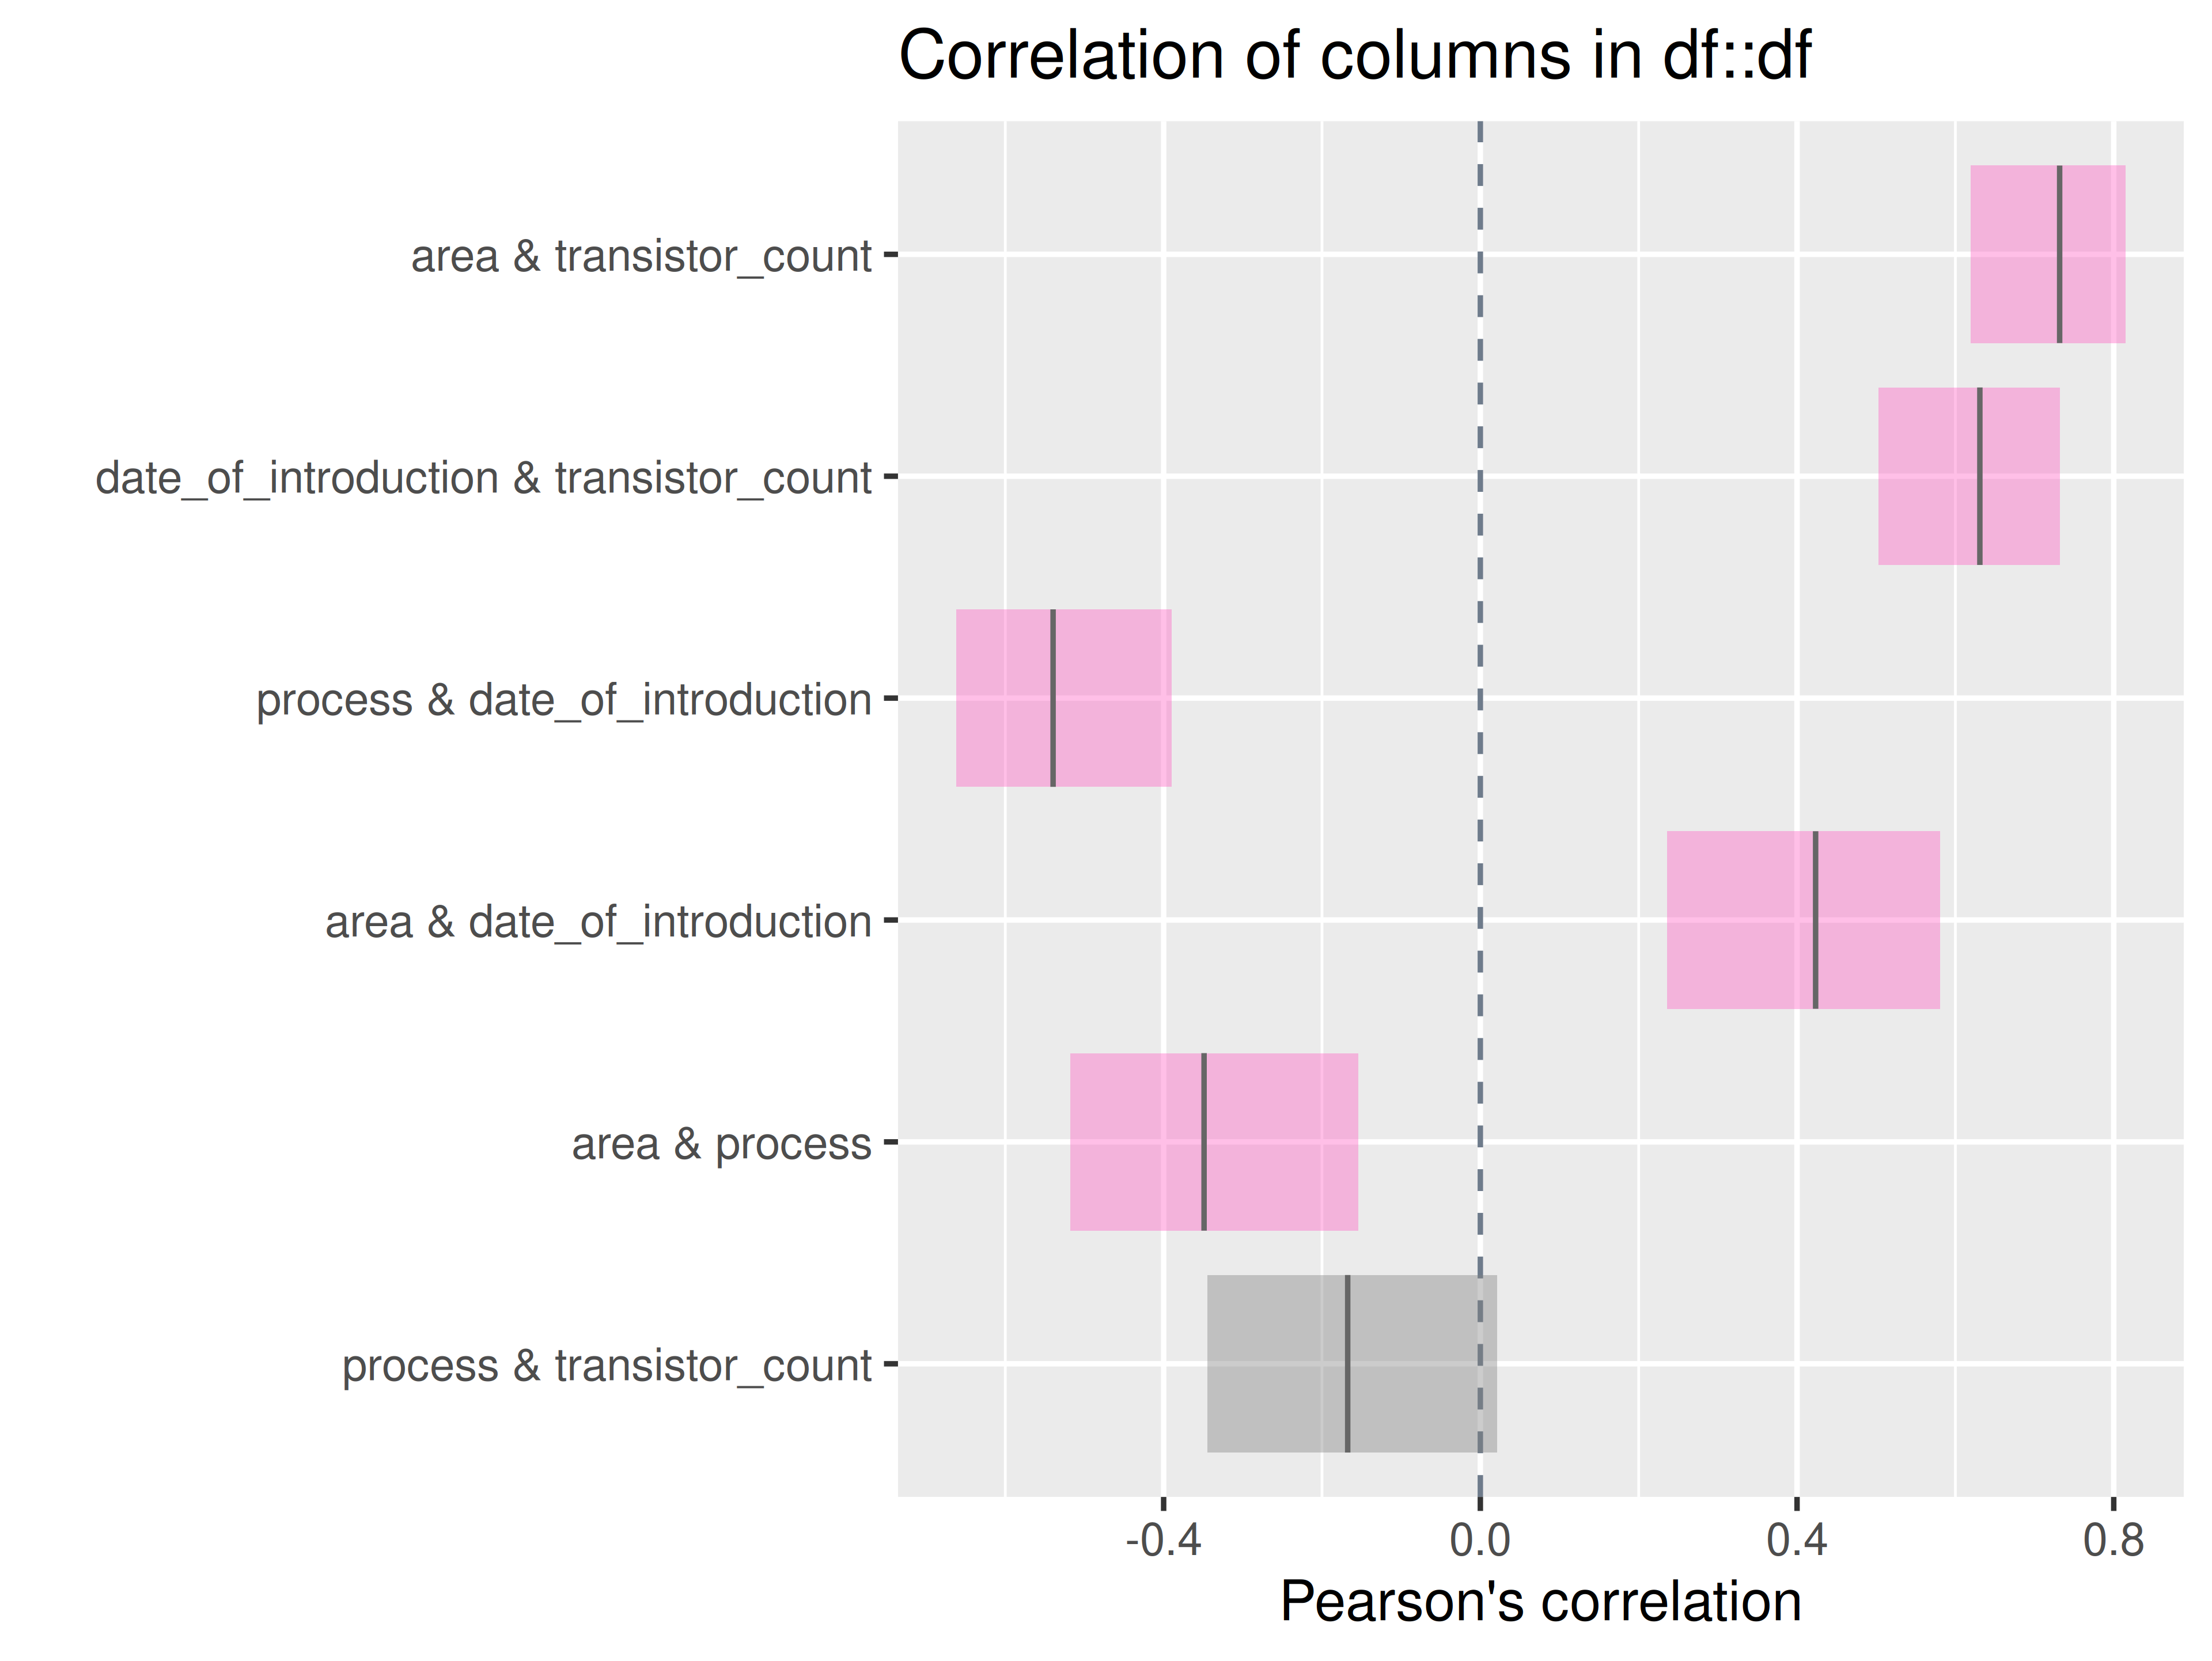
#> SUCCESS [2026-05-28 13:46:36] Completed plot type 'cor'
#> SUCCESS [2026-05-28 13:46:36] inspect_plot(): all requested plots finished
#> NULL
inspectdf::inspect_cor(
  df1 = ttd3[[3]],
  df2 = NULL,
  method = "pearson",
  with_col = NULL,
  alpha = 0.05
) |>
  inspectdf::show_plot(text_labels = TRUE)
inspect_plot(
  ttd = list("ram.csv" = ttd3[[3]]),
  plots = "cor")
#> INFO [2026-05-28 13:46:37] inspect_plot(): starting analysis
#> INFO [2026-05-28 13:46:37] Beginning plot type 'cor'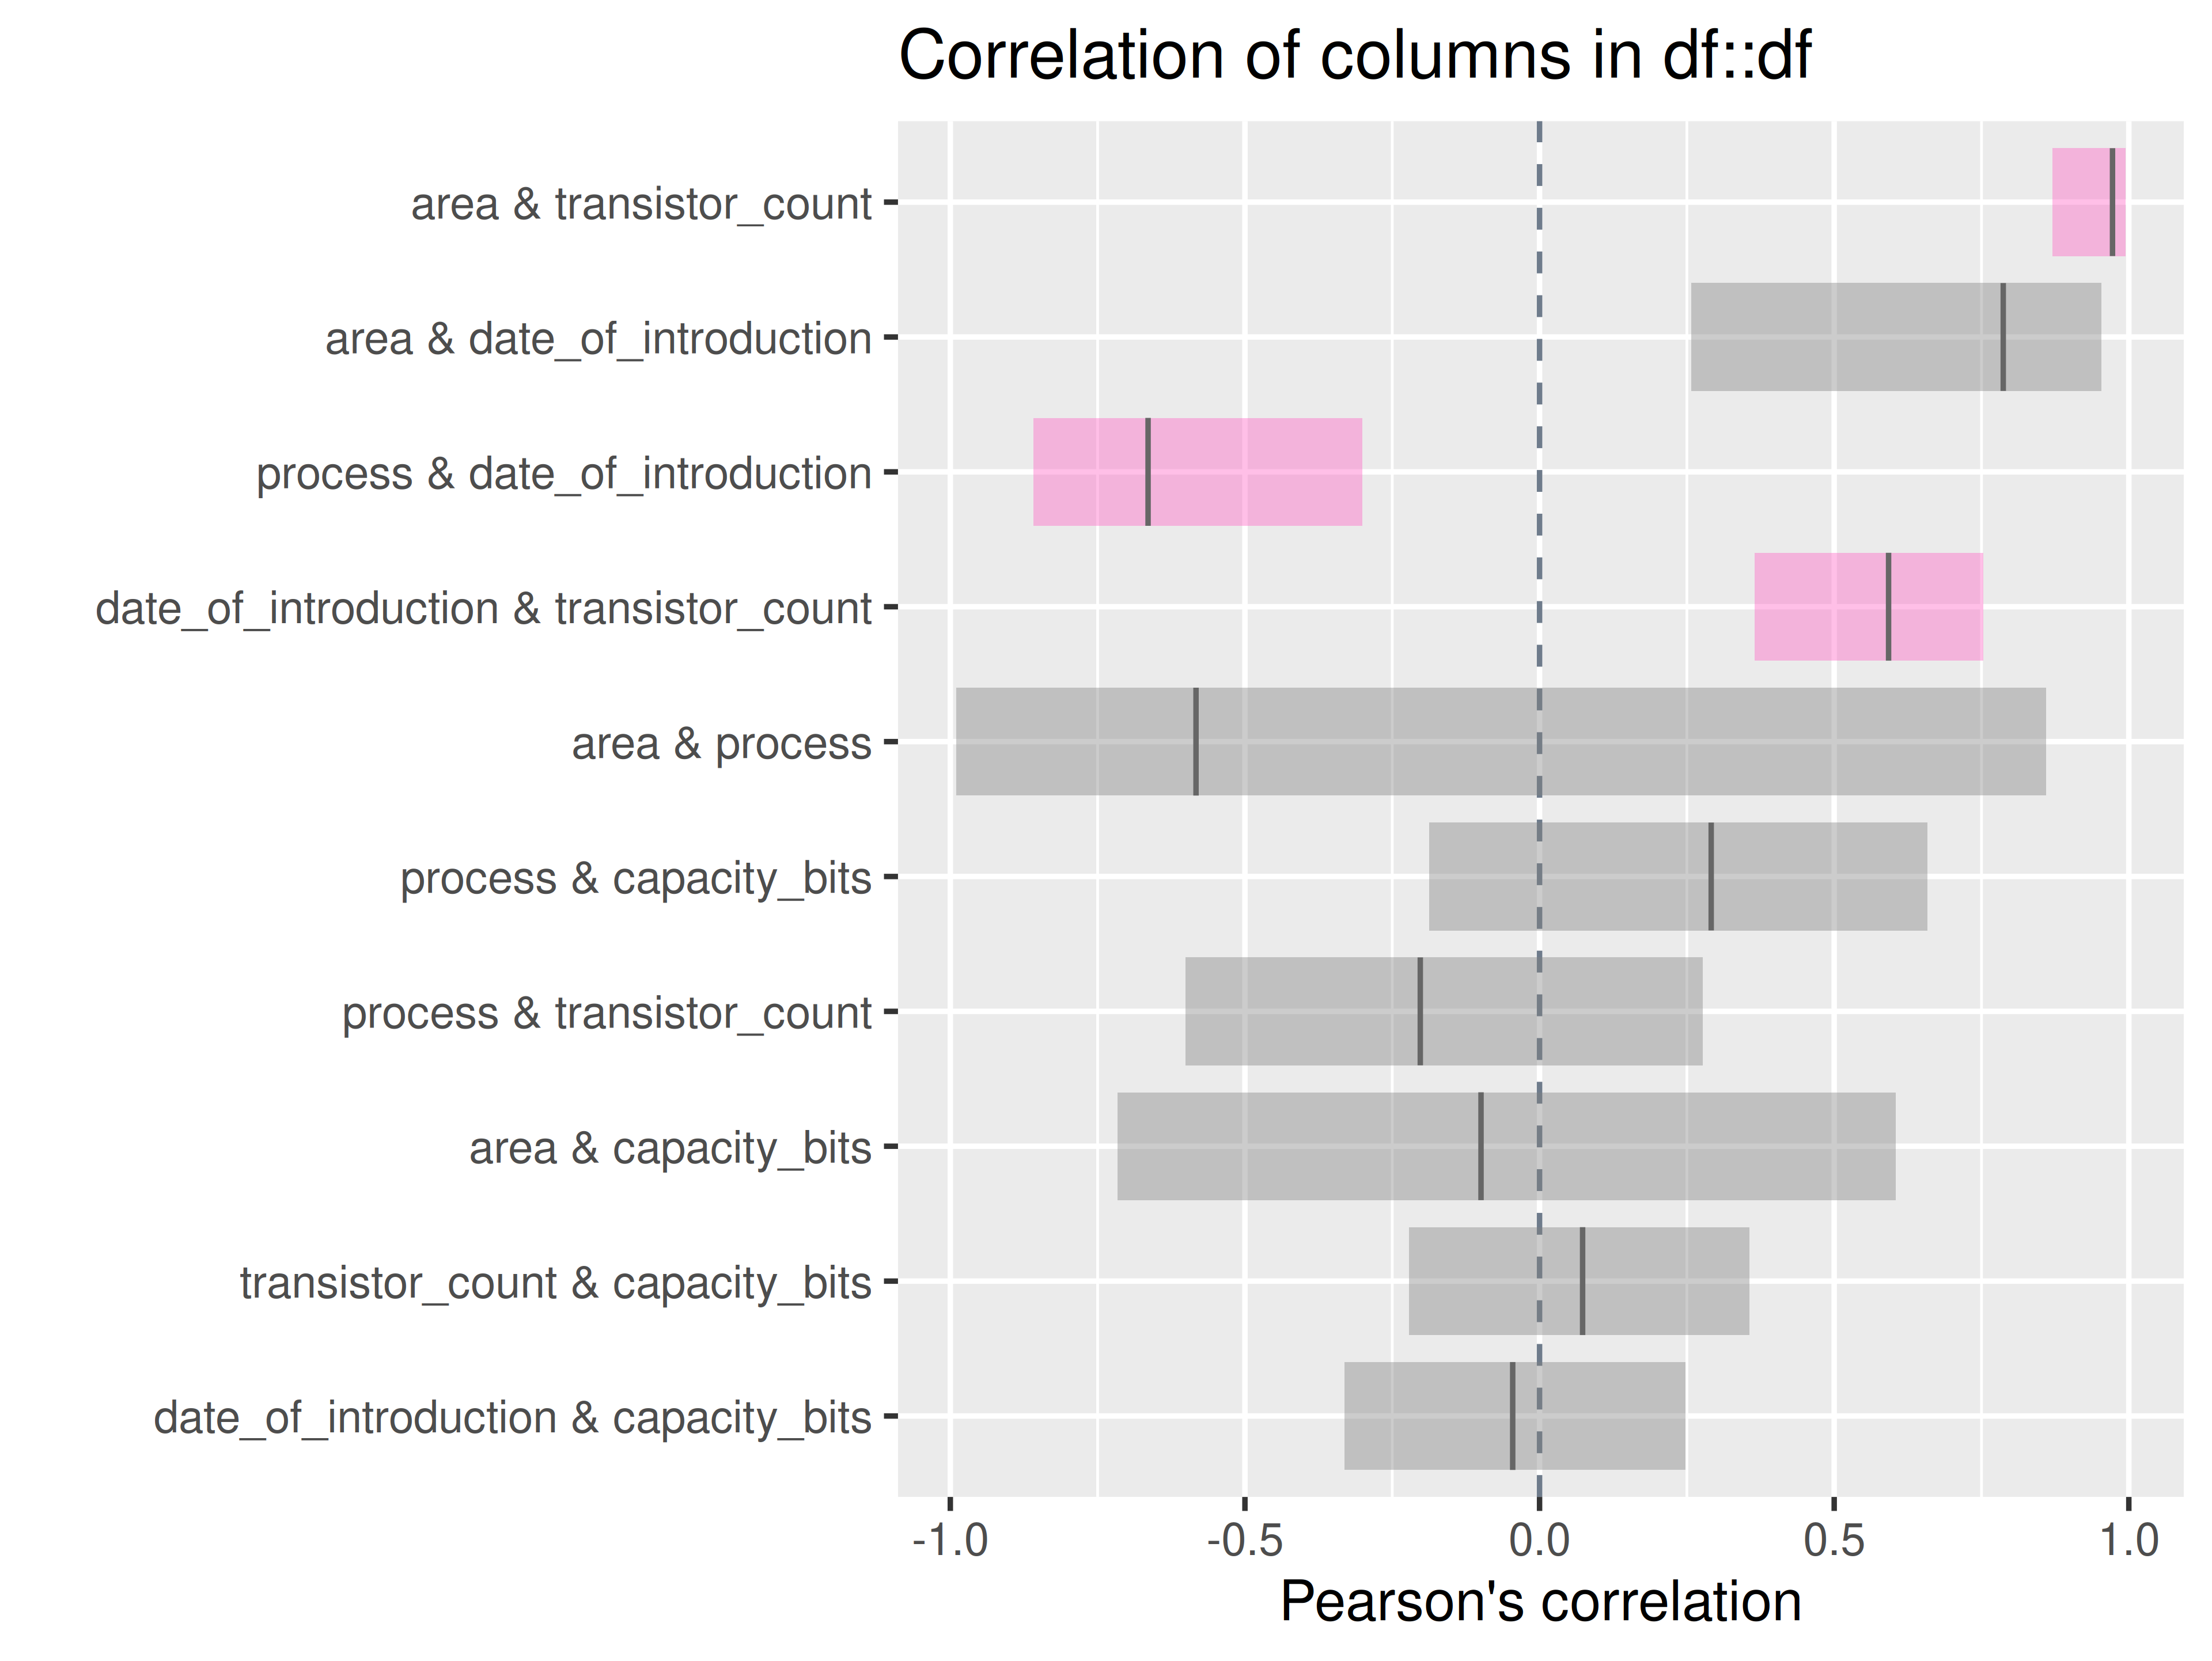
#> SUCCESS [2026-05-28 13:46:38] Completed plot type 'cor'
#> SUCCESS [2026-05-28 13:46:38] inspect_plot(): all requested plots finished
#> NULL
# for all other dataset in the list
inspect_imb()
if (length(ttd) == 1)
If one dataset in ttd:
inspectdf::inspect_imb(
  df1 = ttd[[1]],
  df2 = NULL,
  include_na = FALSE
) |>
  inspectdf::show_plot(text_labels = TRUE)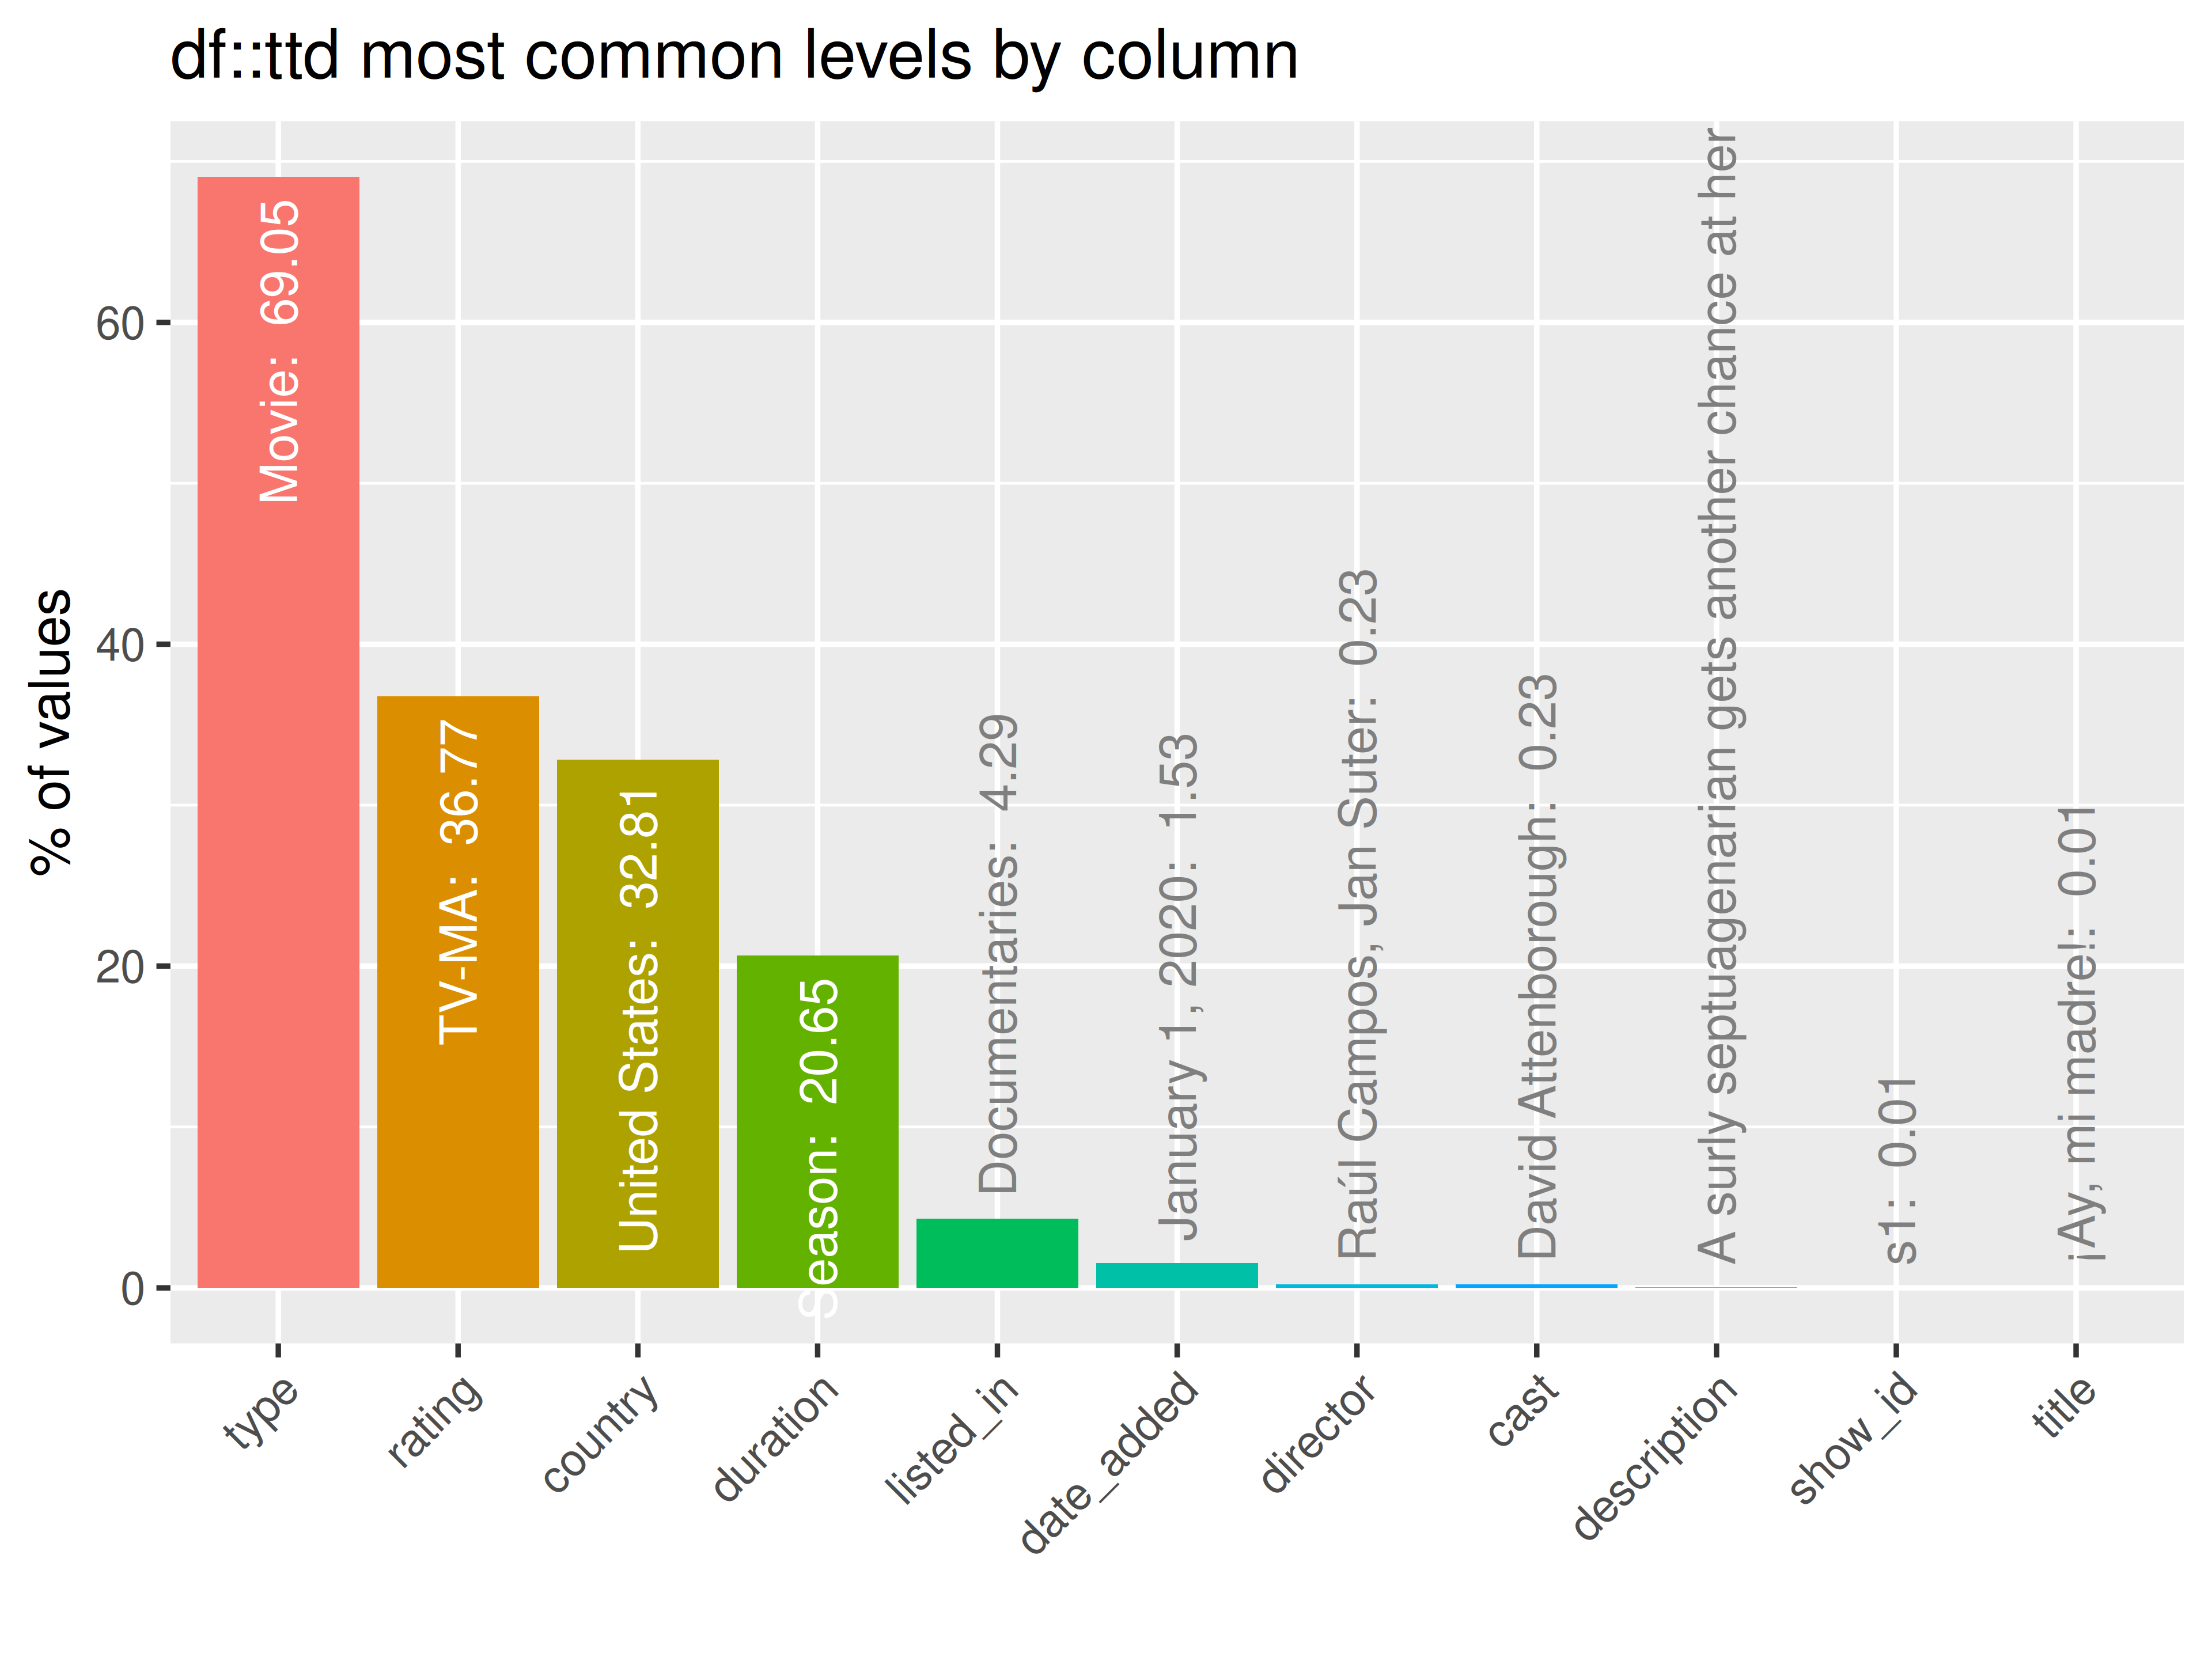
inspect_plot(
  ttd = list("netflix_titles.csv" = ttd[[1]]),
  plots = "imb")
#> INFO [2026-05-28 13:46:40] inspect_plot(): starting analysis
#> INFO [2026-05-28 13:46:40] Beginning plot type 'imb'
#> SUCCESS [2026-05-28 13:46:40] Completed plot type 'imb'
#> SUCCESS [2026-05-28 13:46:40] inspect_plot(): all requested plots finished
#> NULL
if (length(ttd) == 2)
If two datasets in ttd:
inspectdf::inspect_imb(
  df1 = ttd2[[1]],
  df2 = ttd2[[2]],
  include_na = FALSE
) |>
  inspectdf::show_plot(text_labels = TRUE)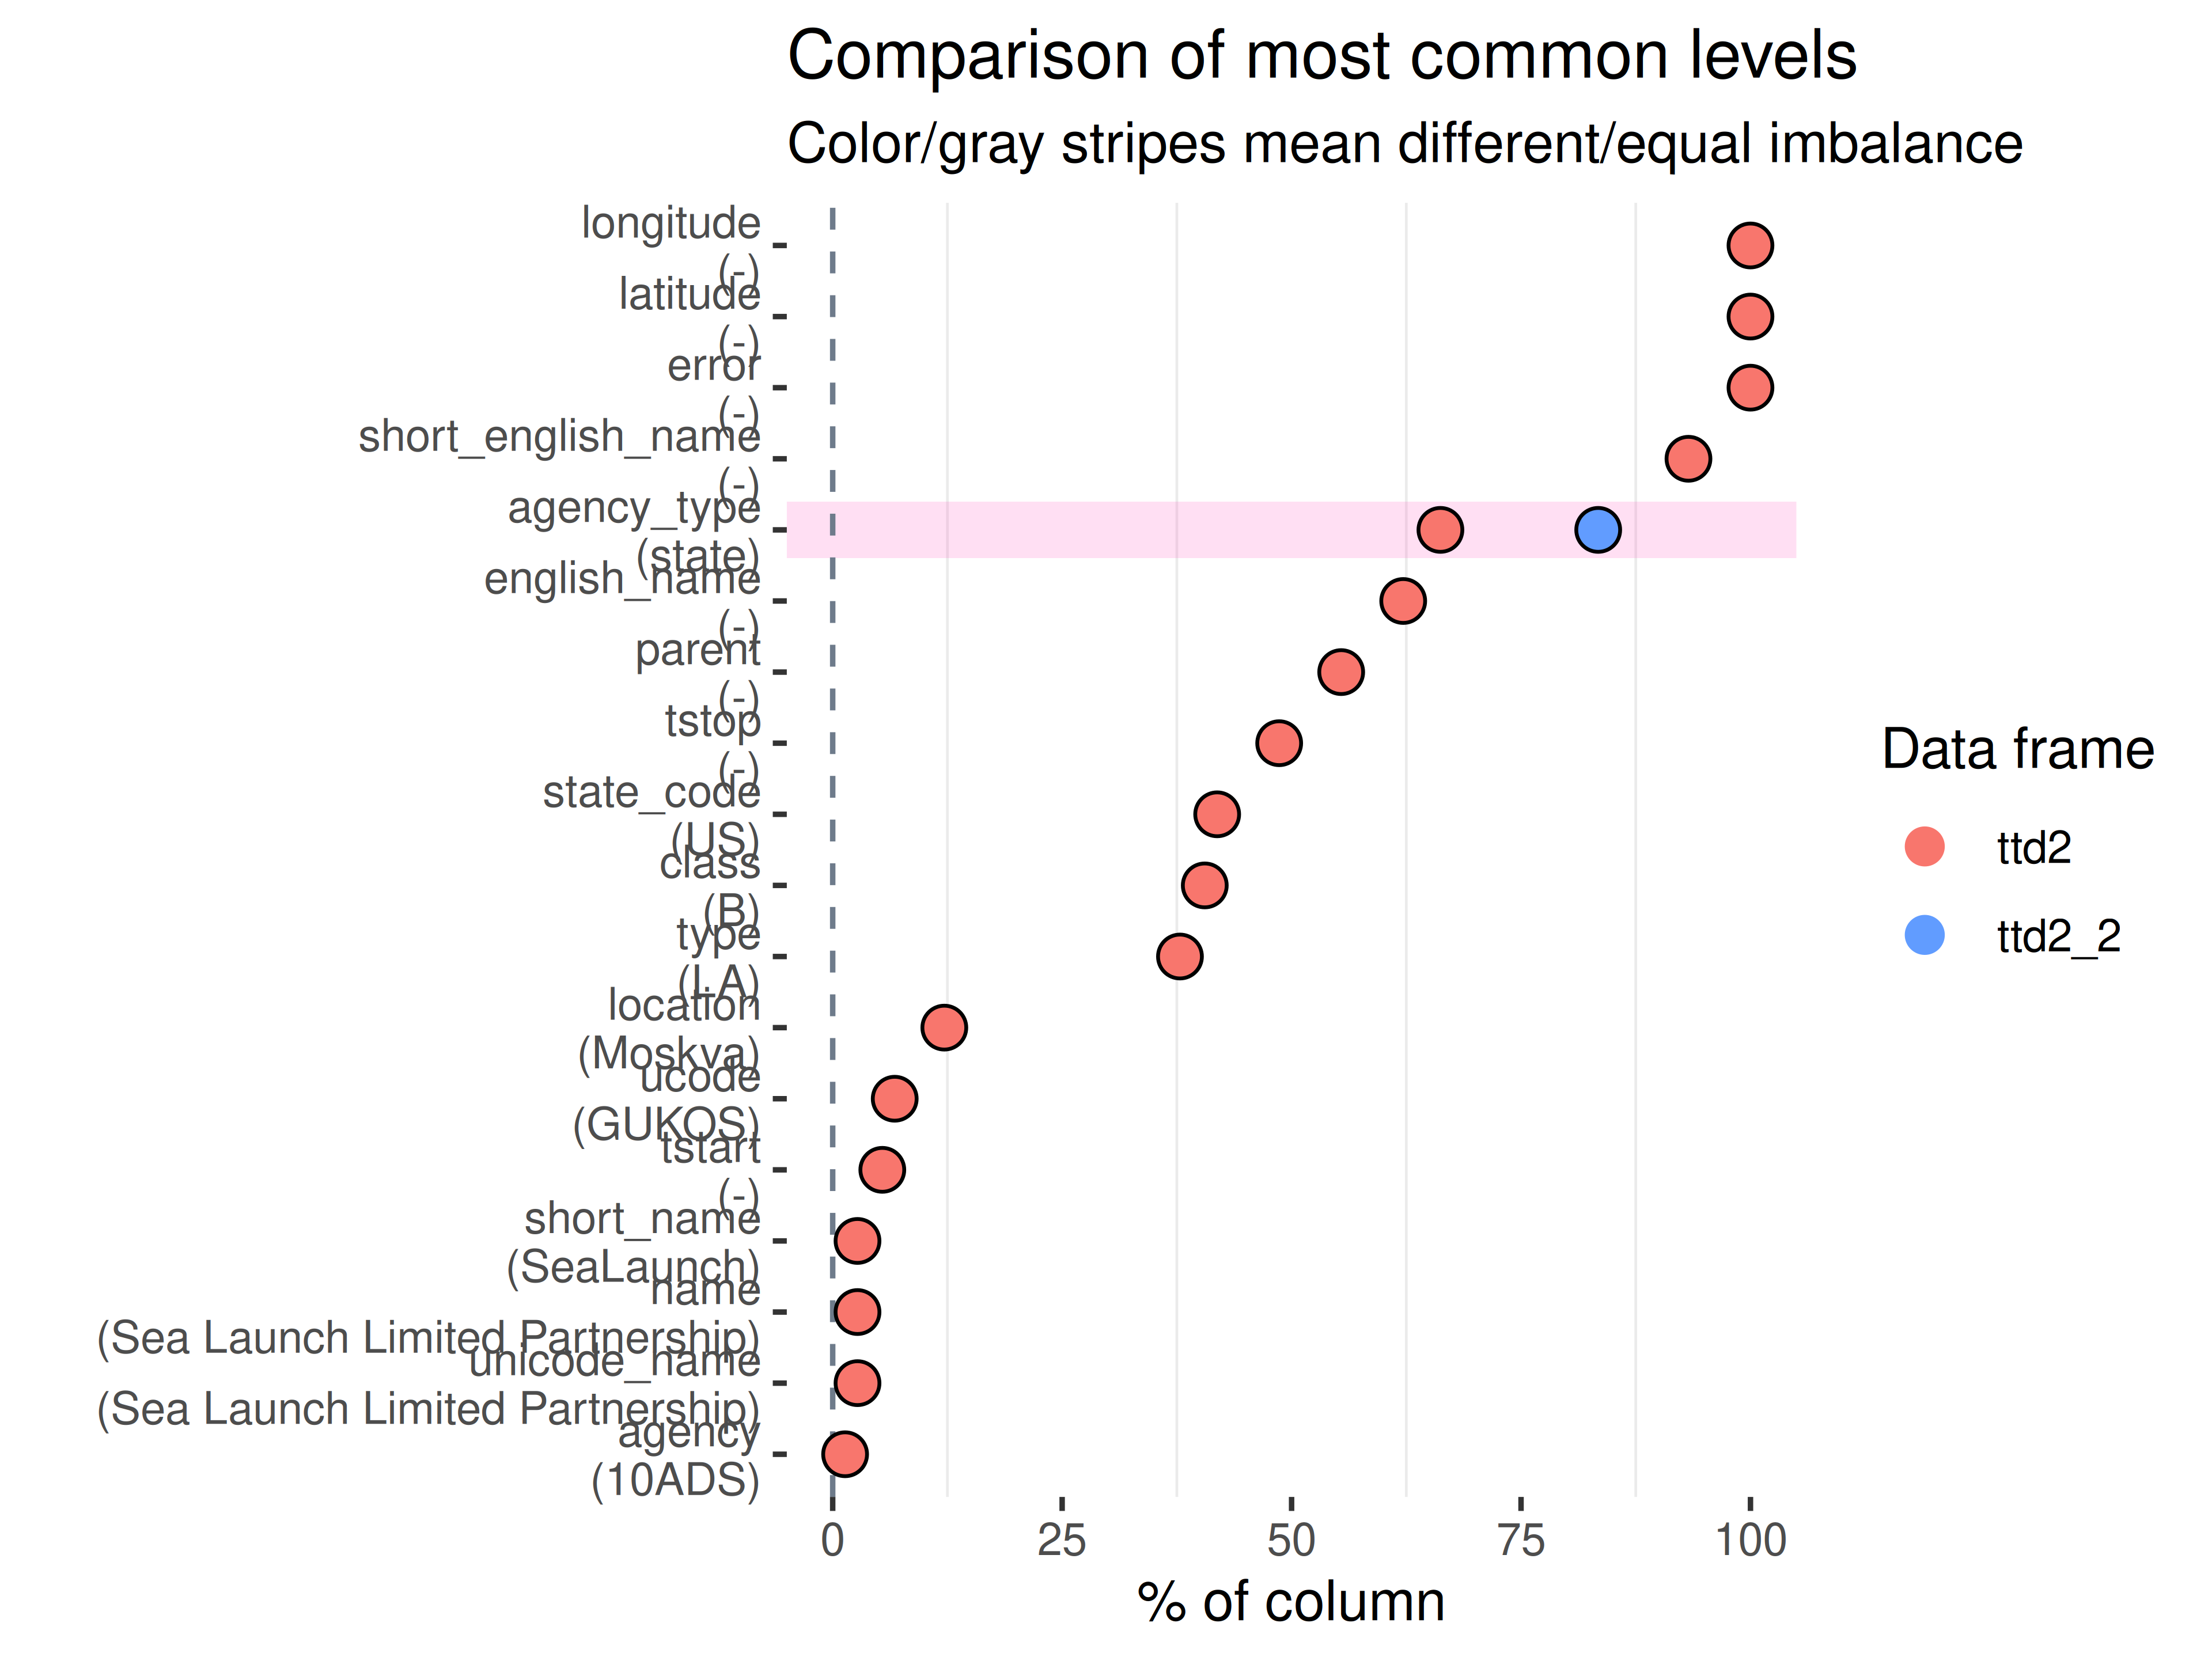
inspect_plot(
  ttd = list(
    "agencies.csv" = ttd2[[1]],
    "launches.csv" = ttd2[[2]]
    ),
  plots = "imb")
#> INFO [2026-05-28 13:46:42] inspect_plot(): starting analysis
#> INFO [2026-05-28 13:46:42] Beginning plot type 'imb'
#> SUCCESS [2026-05-28 13:46:42] Completed plot type 'imb'
#> SUCCESS [2026-05-28 13:46:42] inspect_plot(): all requested plots finished
#> NULL
if (length(ttd) >= 3)
If more than two datasets in ttd:
inspectdf::inspect_imb(
  df1 = ttd3[[1]],
  df2 = NULL,
  include_na = FALSE
) |>
  inspectdf::show_plot(text_labels = TRUE)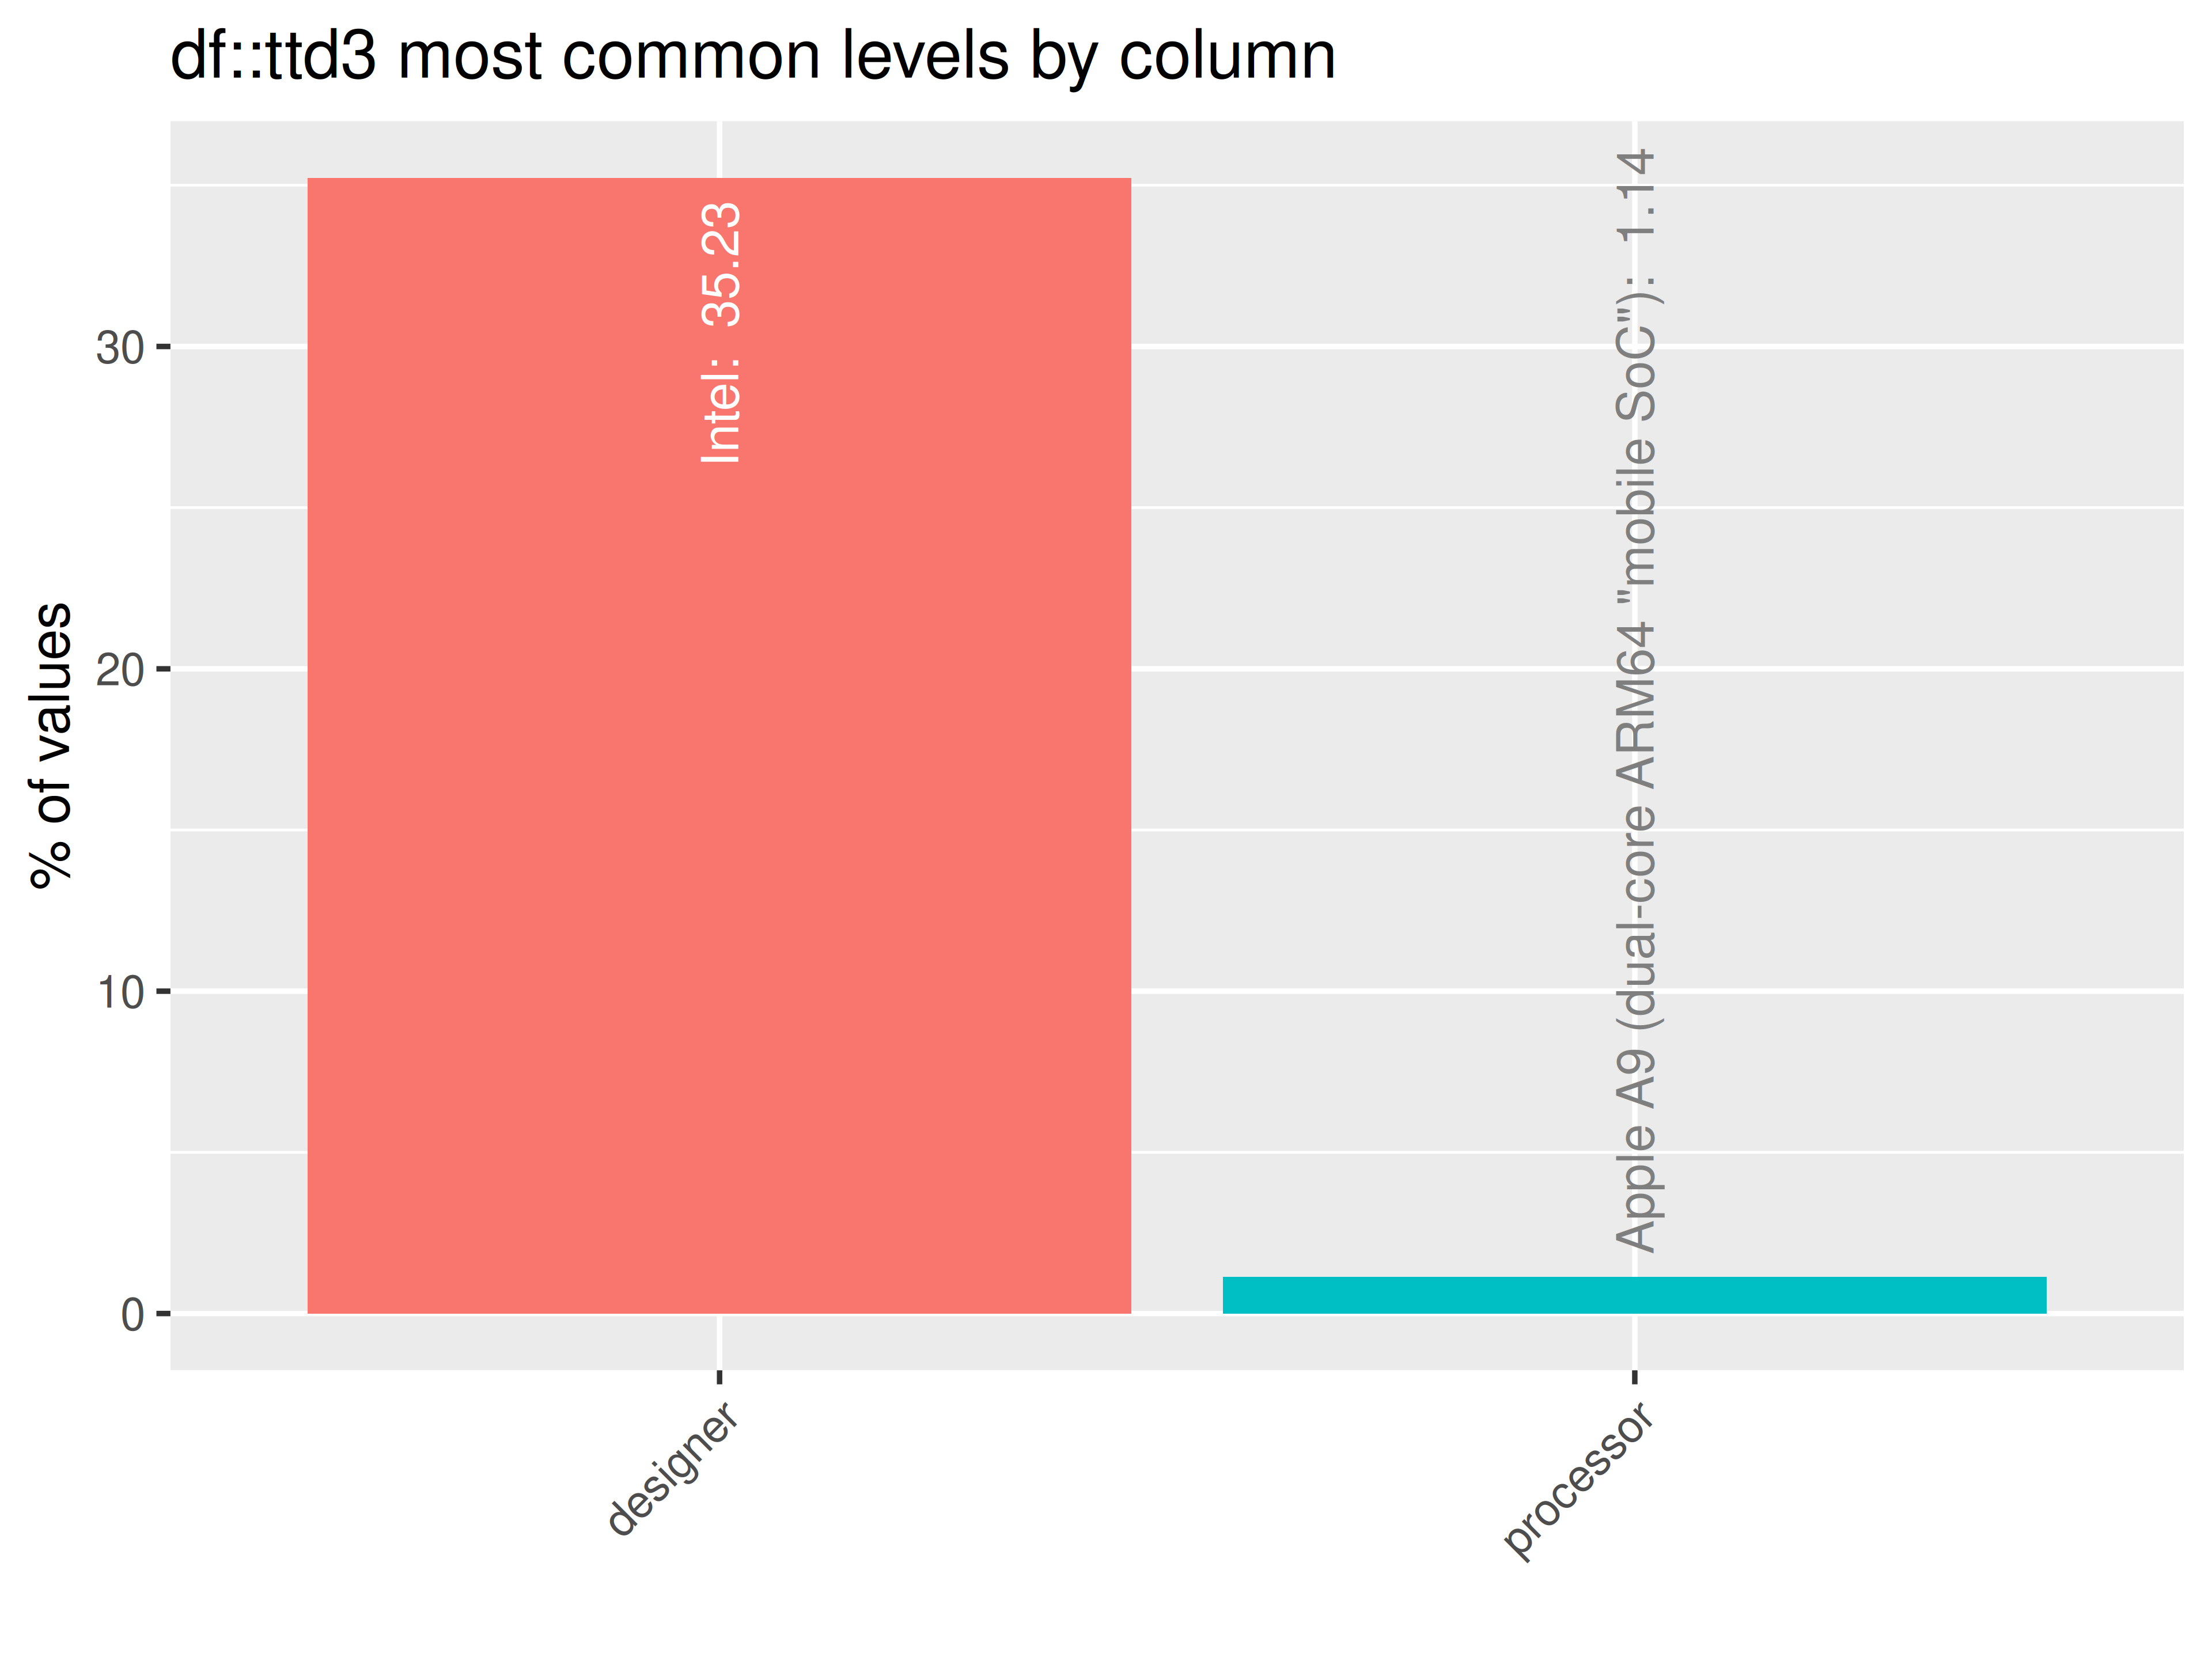
inspect_plot(
  ttd = list("cpu.csv" = ttd3[[1]]),
  plots = "imb")
#> INFO [2026-05-28 13:46:44] inspect_plot(): starting analysis
#> INFO [2026-05-28 13:46:44] Beginning plot type 'imb'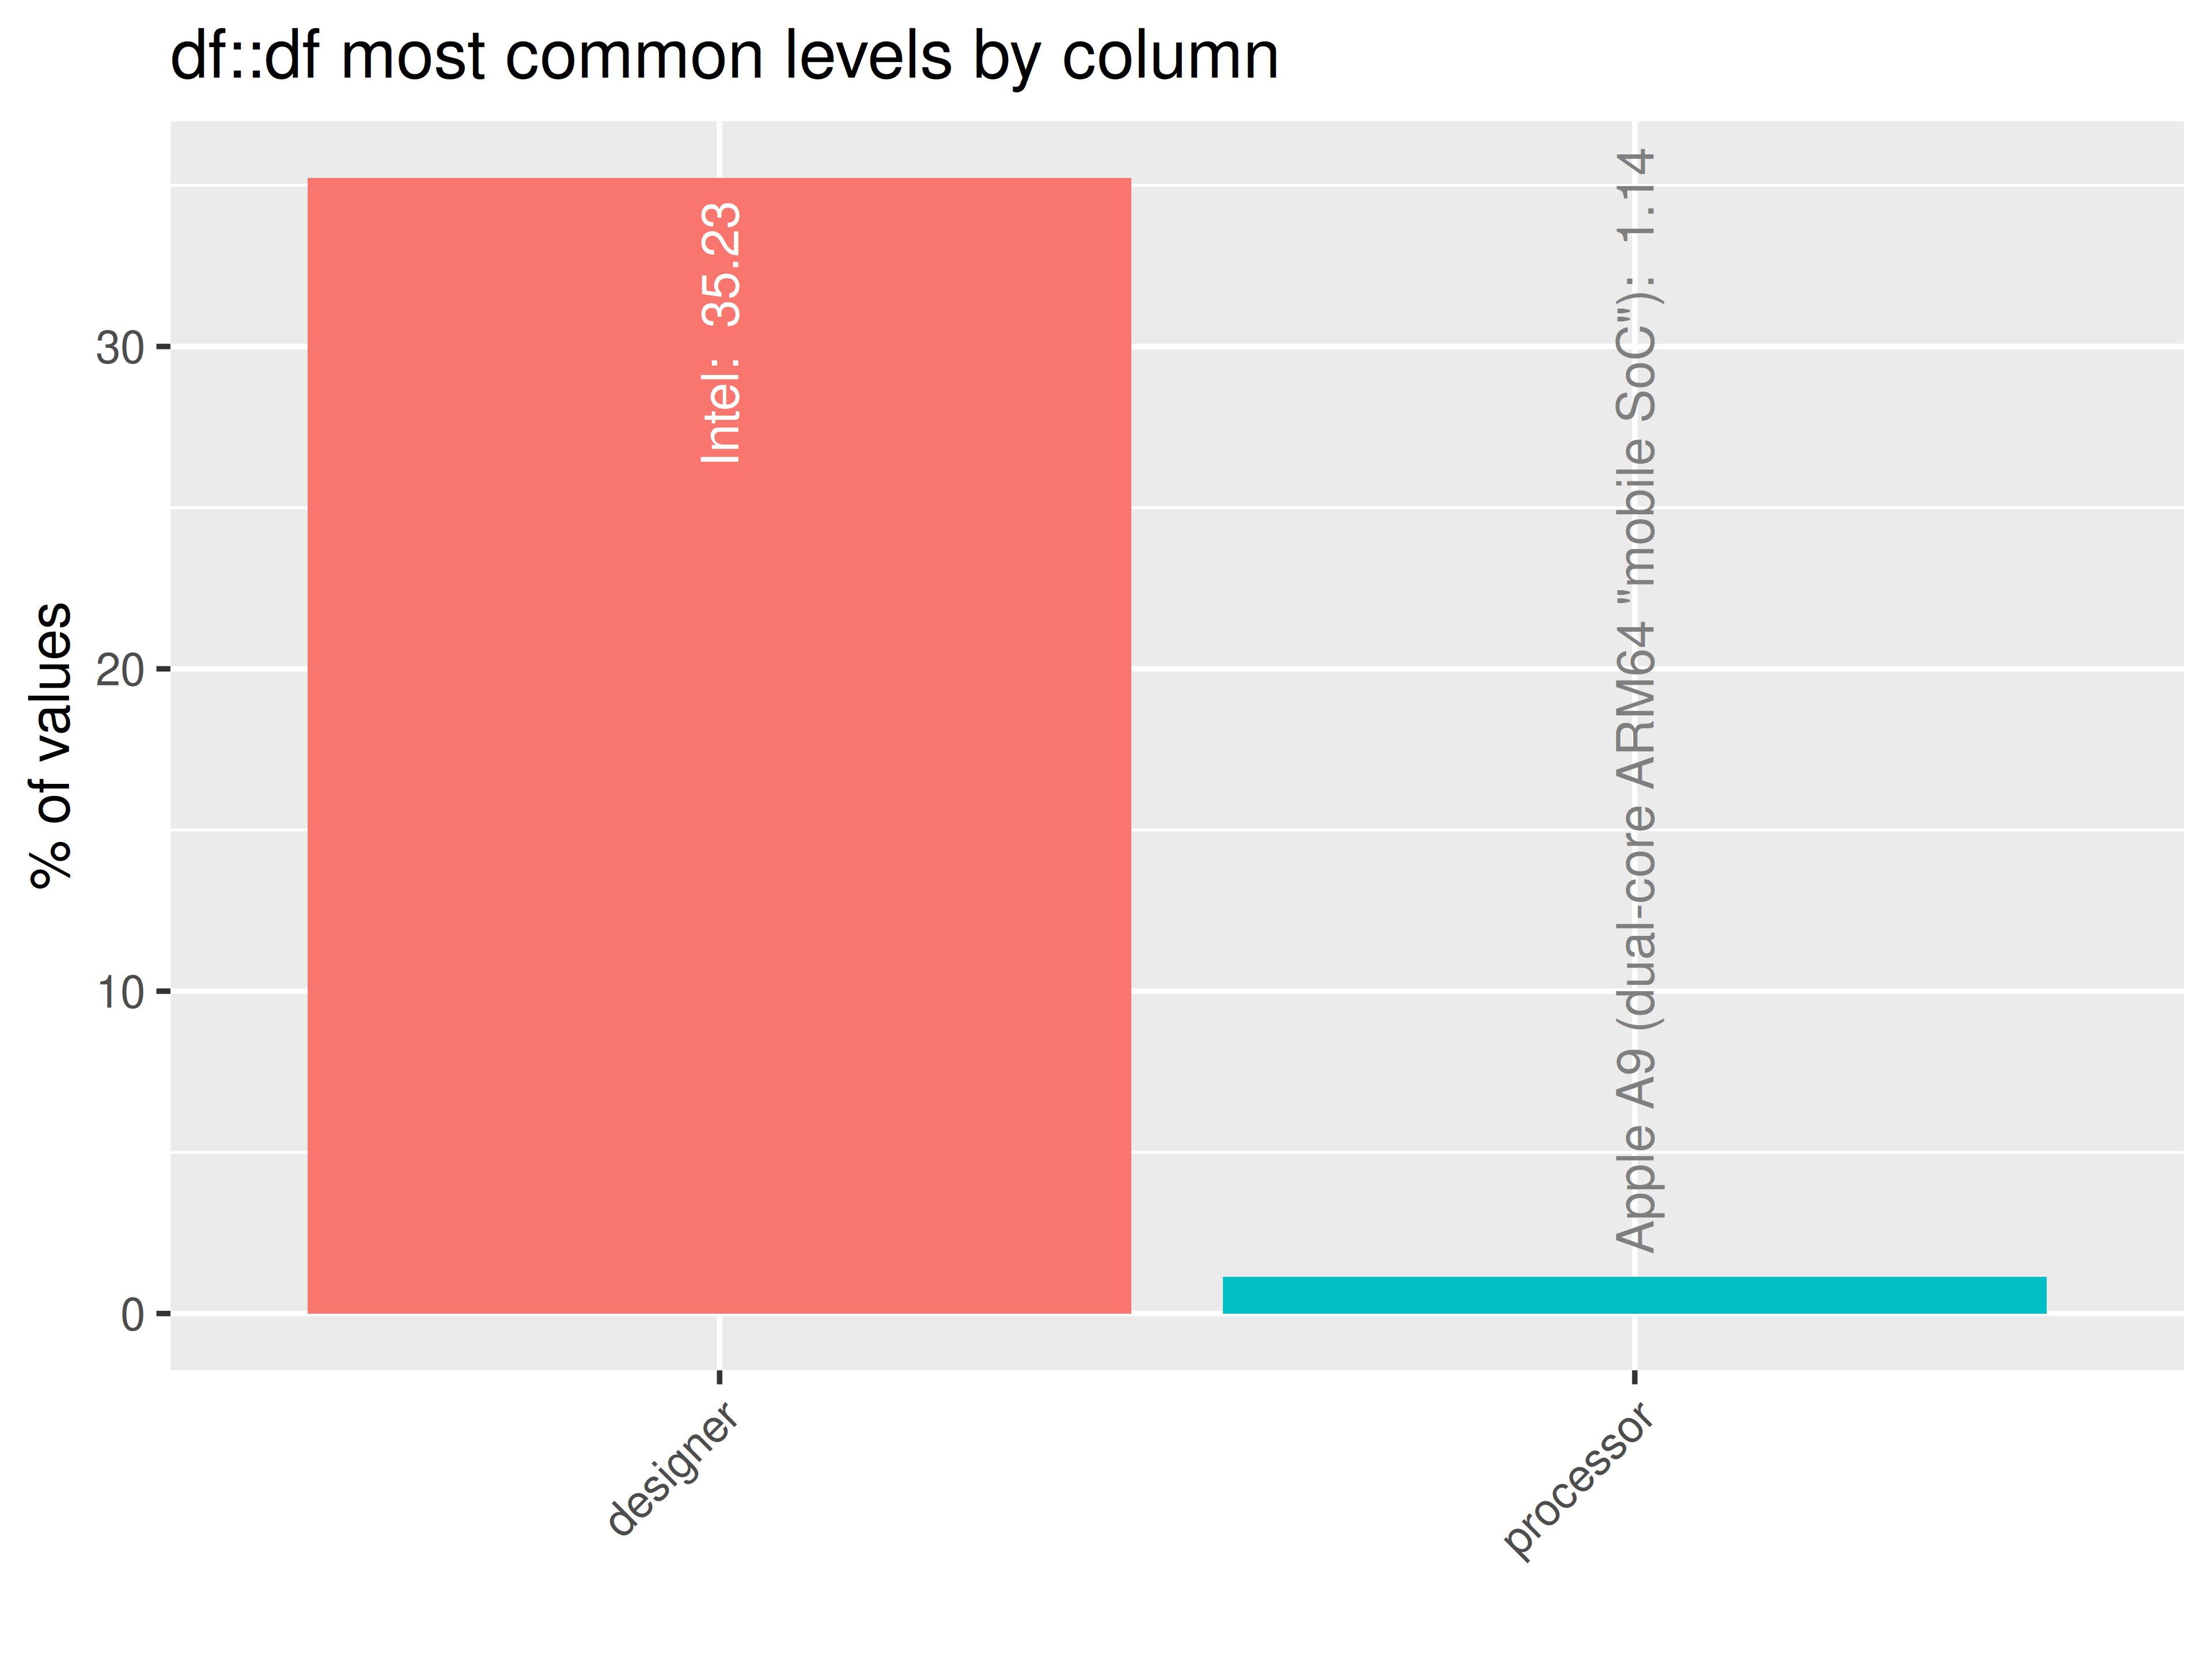
#> SUCCESS [2026-05-28 13:46:44] Completed plot type 'imb'
#> SUCCESS [2026-05-28 13:46:44] inspect_plot(): all requested plots finished
#> NULL
inspectdf::inspect_imb(
  df1 = ttd3[[2]],
  df2 = NULL,
  include_na = FALSE
) |>
  inspectdf::show_plot(text_labels = TRUE)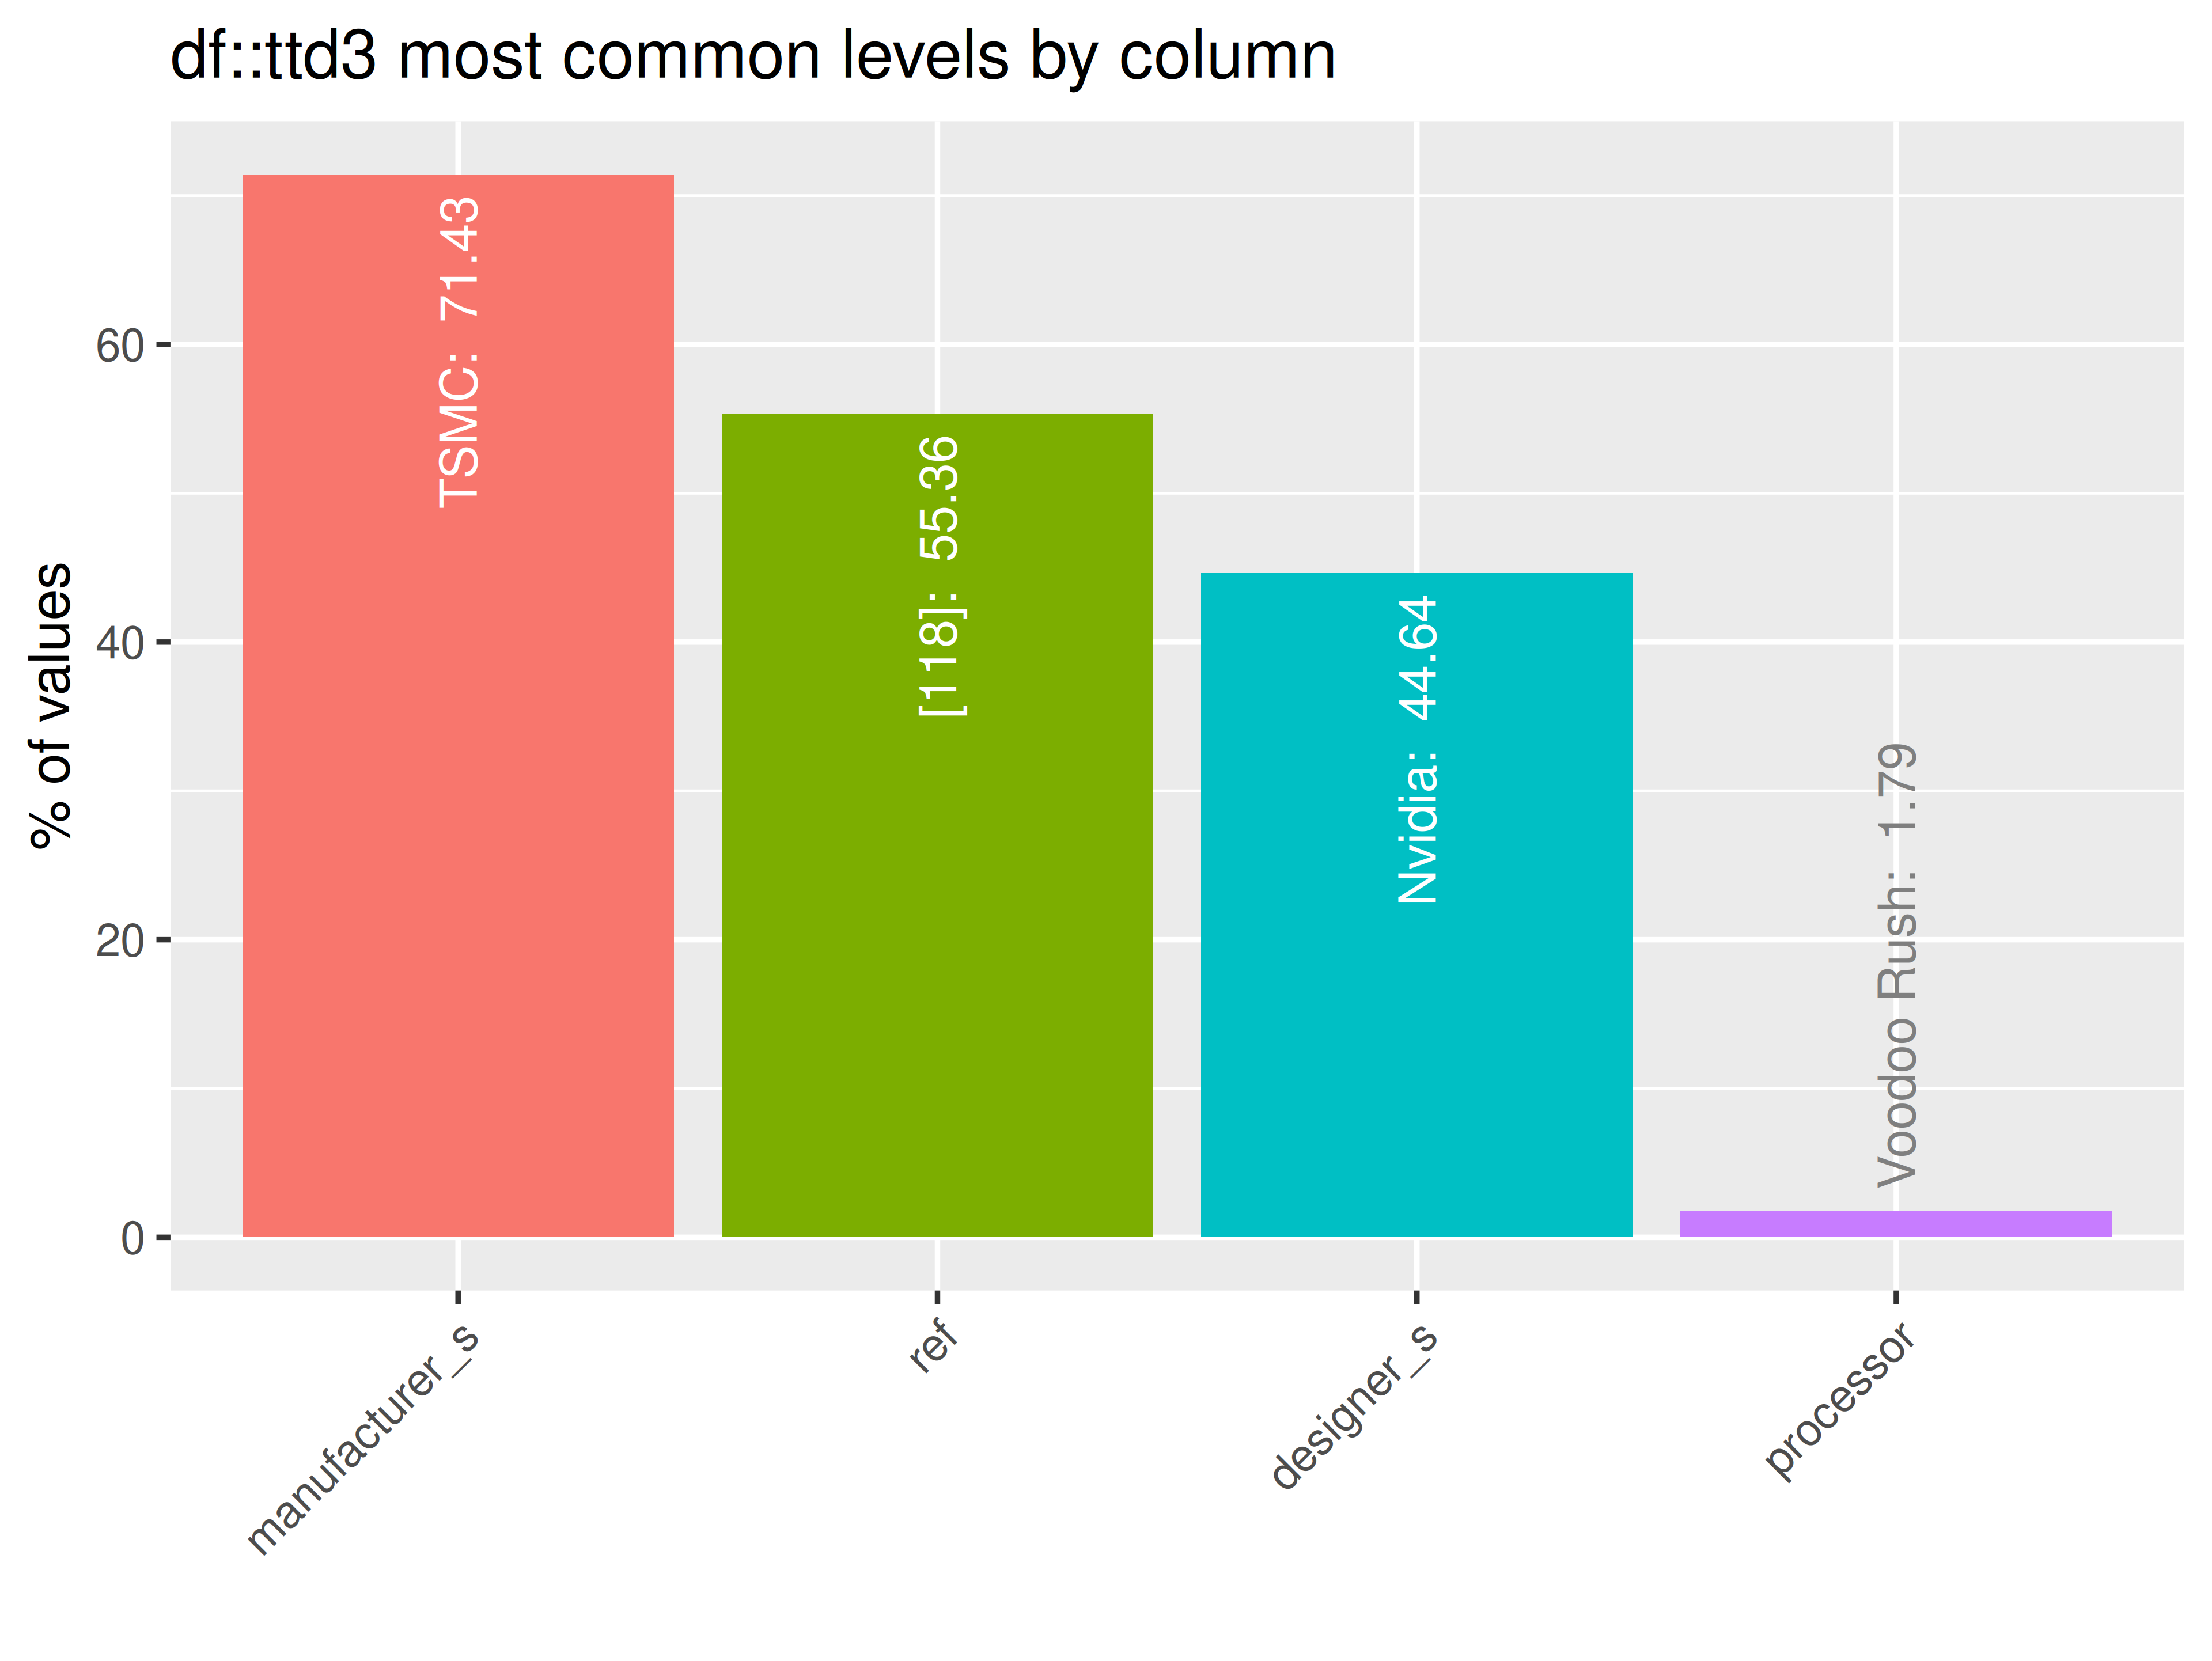
inspect_plot(
  ttd = list("gpu.csv" = ttd3[[2]]),
  plots = "imb")
#> INFO [2026-05-28 13:46:46] inspect_plot(): starting analysis
#> INFO [2026-05-28 13:46:46] Beginning plot type 'imb'
#> SUCCESS [2026-05-28 13:46:46] Completed plot type 'imb'
#> SUCCESS [2026-05-28 13:46:46] inspect_plot(): all requested plots finished
#> NULL
inspectdf::inspect_imb(
  df1 = ttd3[[3]],
  df2 = NULL,
  include_na = FALSE
) |>
  inspectdf::show_plot(text_labels = TRUE)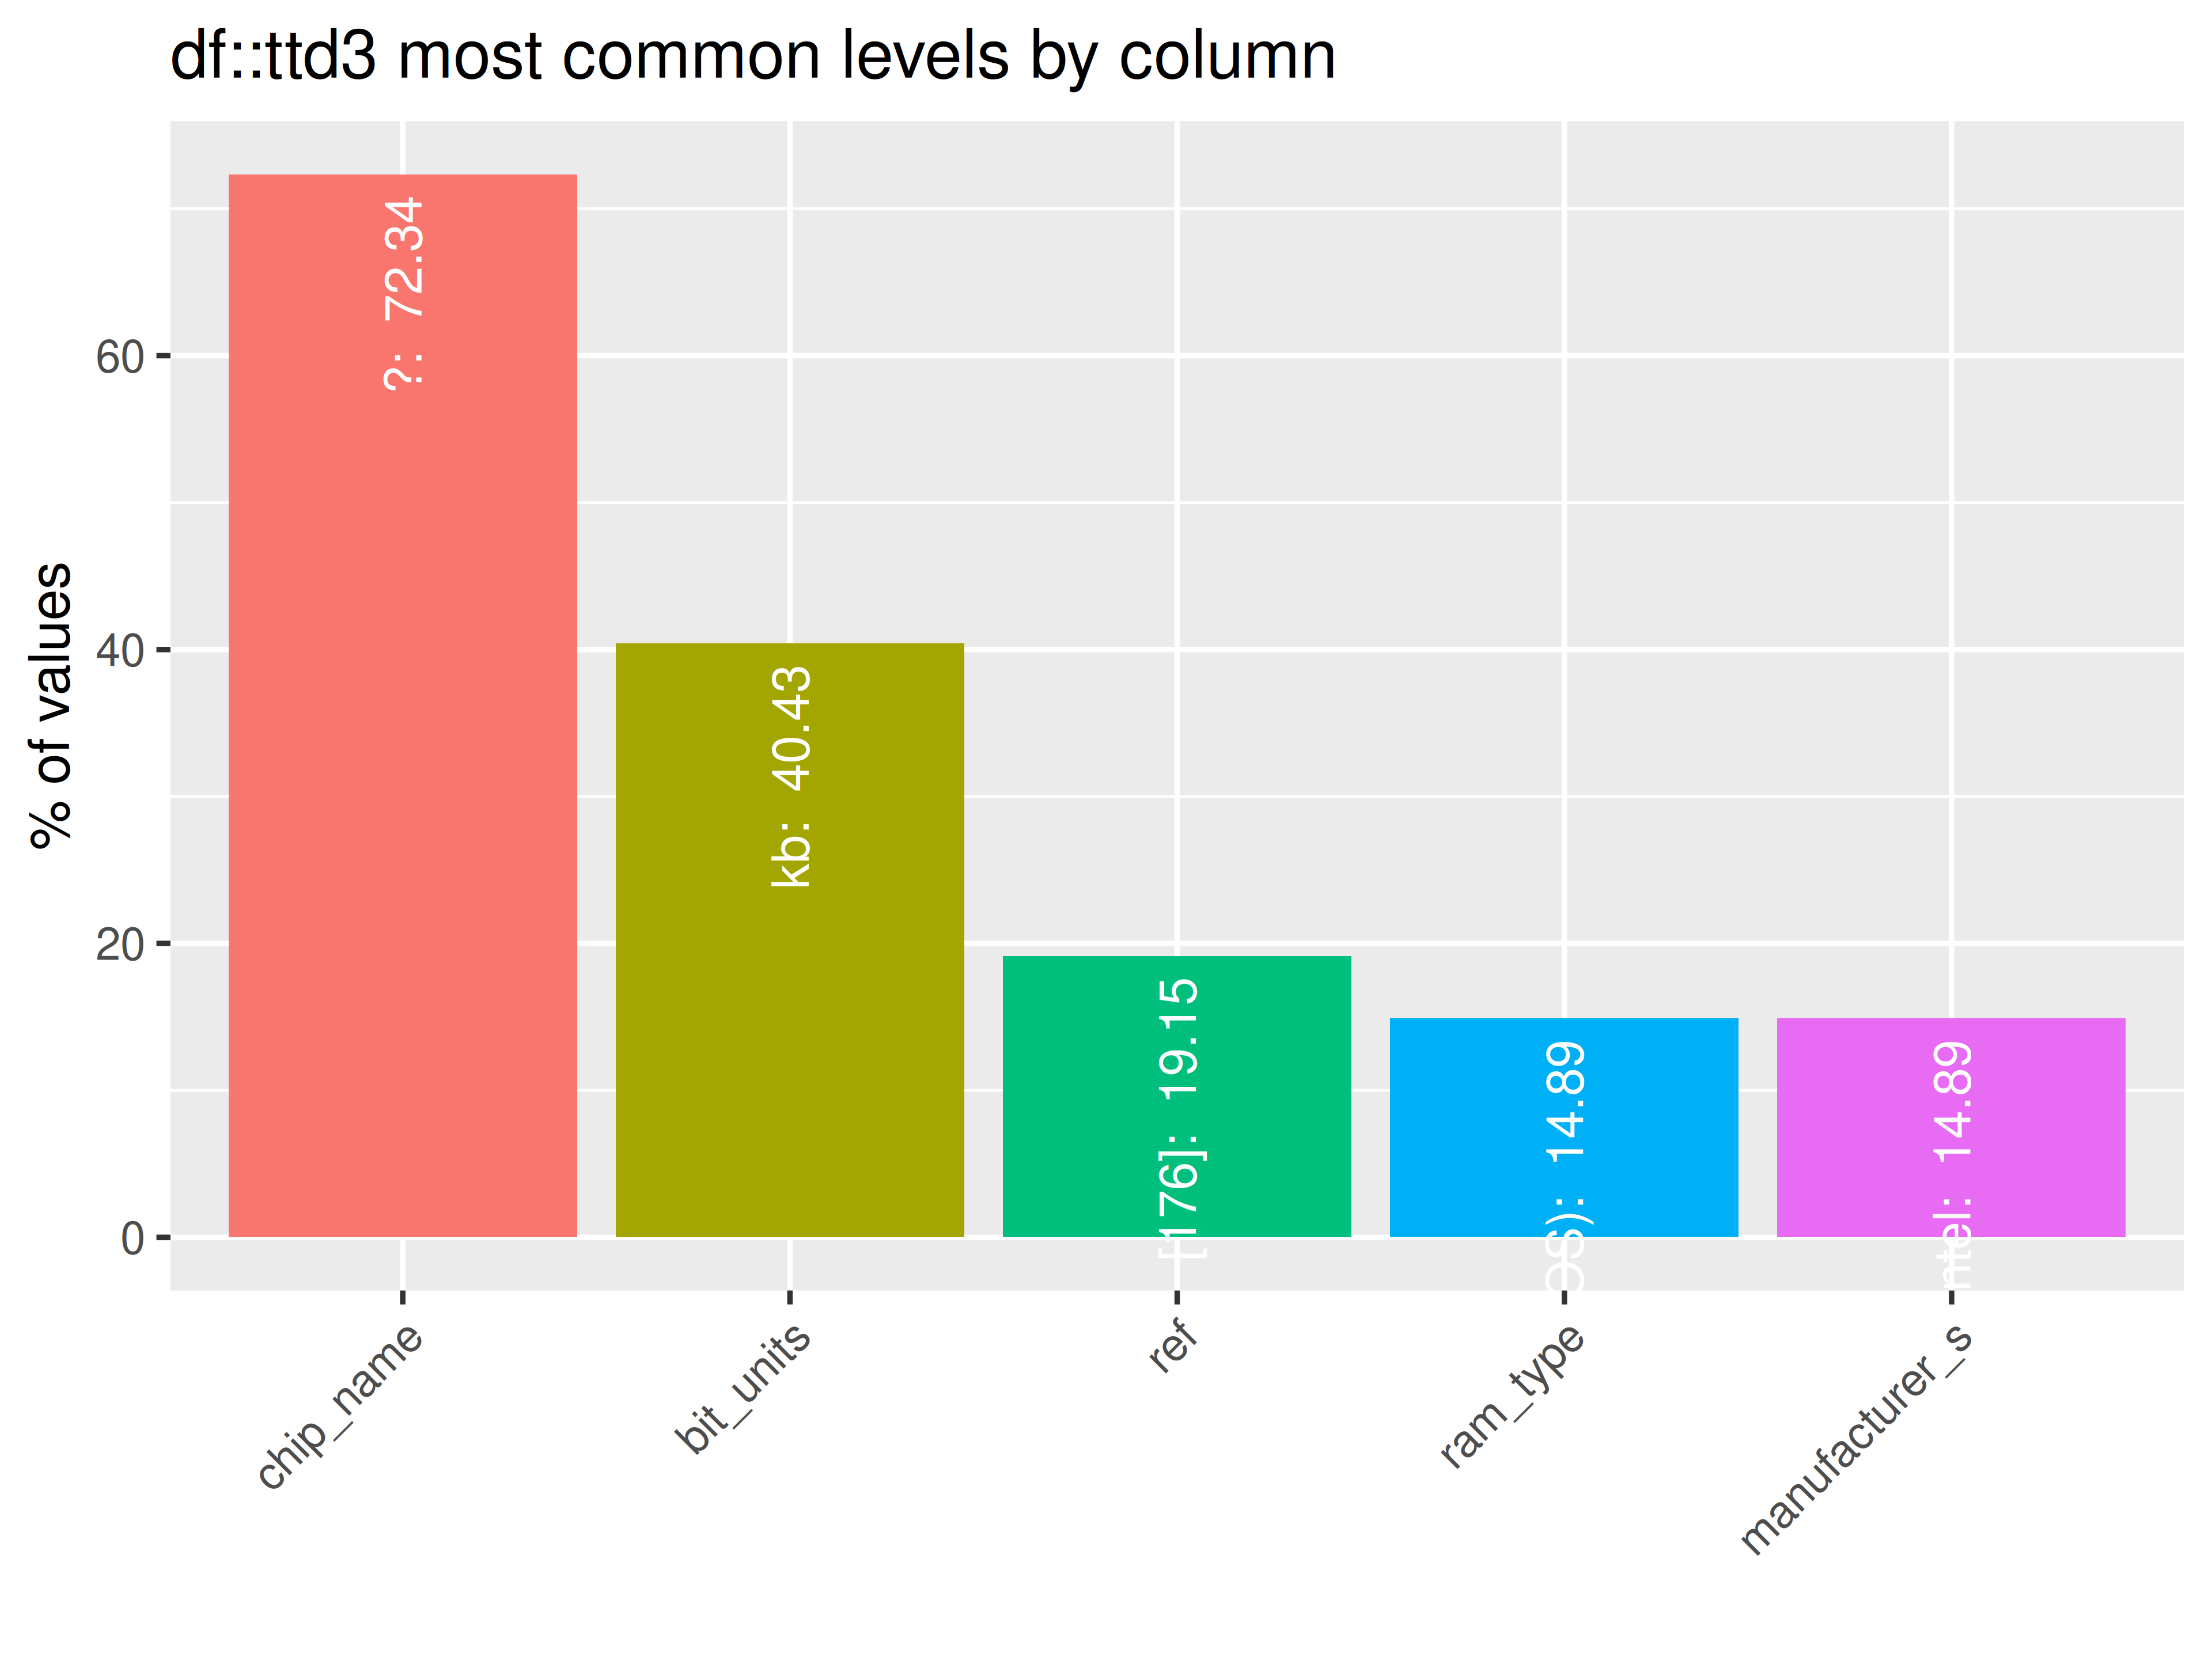
inspect_plot(
  ttd = list("ram.csv" = ttd3[[3]]),
  plots = "imb")
#> INFO [2026-05-28 13:46:48] inspect_plot(): starting analysis
#> INFO [2026-05-28 13:46:48] Beginning plot type 'imb'
#> SUCCESS [2026-05-28 13:46:48] Completed plot type 'imb'
#> SUCCESS [2026-05-28 13:46:48] inspect_plot(): all requested plots finished
#> NULL
# ... for all datasets in ttd list
inspect_num()
if (length(ttd) == 1)
If one dataset in ttd:
- check if there is at least 1 numeric column in the dataset in the
ttdlist
check_ttd_num_cols(ttd2)
#> $agencies.csv
#> [1] "count"
#>
#> $launches.csv
#> [1] "JD" "launch_year"- if so, run:
inspectdf::inspect_num(
  df1 = ttd2[[1]],
  df2 = NULL,
  breaks = 20,
  include_int = TRUE
) |>
  inspectdf::show_plot(text_labels = TRUE)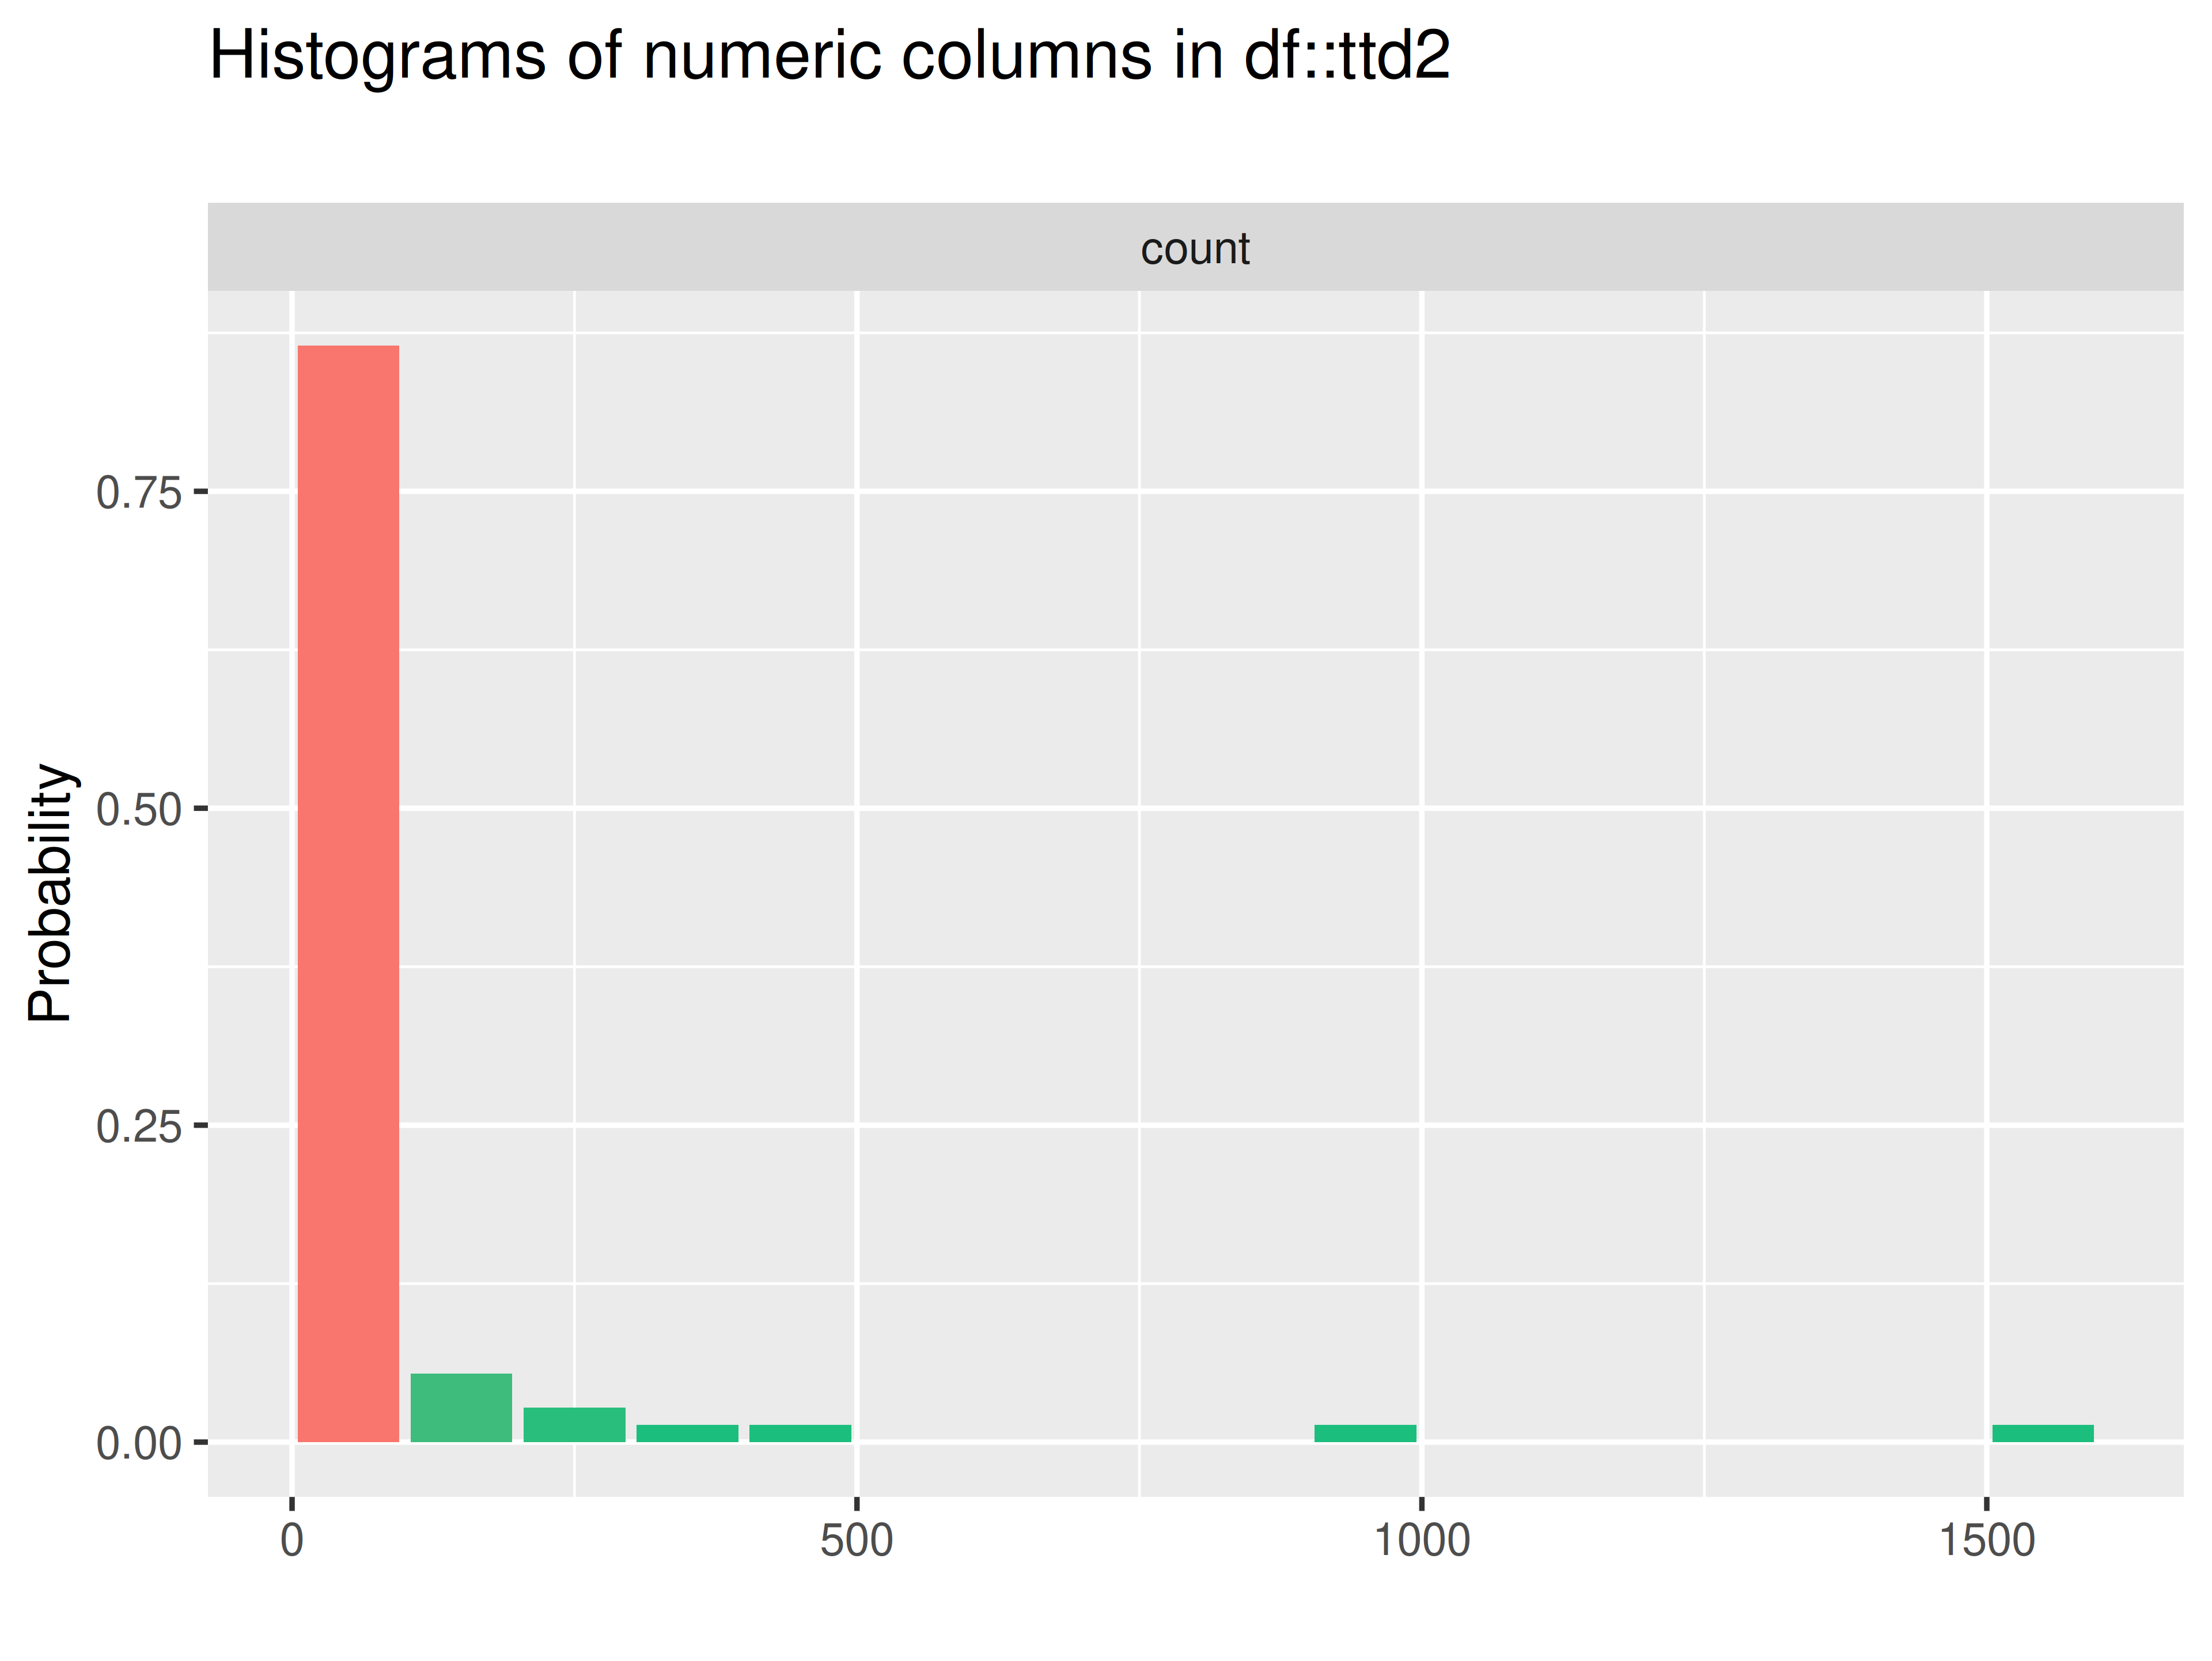
BUG: inspect_plot() doesn’t seem to
identify when a list has a dataset with single numerical column.
inspect_plot(
  ttd = list("agencies.csv" = ttd2[[1]]),
  plots = "num")
#> INFO [2026-05-28 13:46:49] inspect_plot(): starting analysis
#> INFO [2026-05-28 13:46:49] Beginning plot type 'num'
#> SUCCESS [2026-05-28 13:46:49] Completed plot type 'num'
#> SUCCESS [2026-05-28 13:46:49] inspect_plot(): all requested plots finished
#> NULL
If will work if the list has two numeric columns:
inspect_plot(
  ttd = list("launches.csv" = ttd2[[2]]),
  plots = "num")
#> INFO [2026-05-28 13:46:49] inspect_plot(): starting analysis
#> INFO [2026-05-28 13:46:49] Beginning plot type 'num'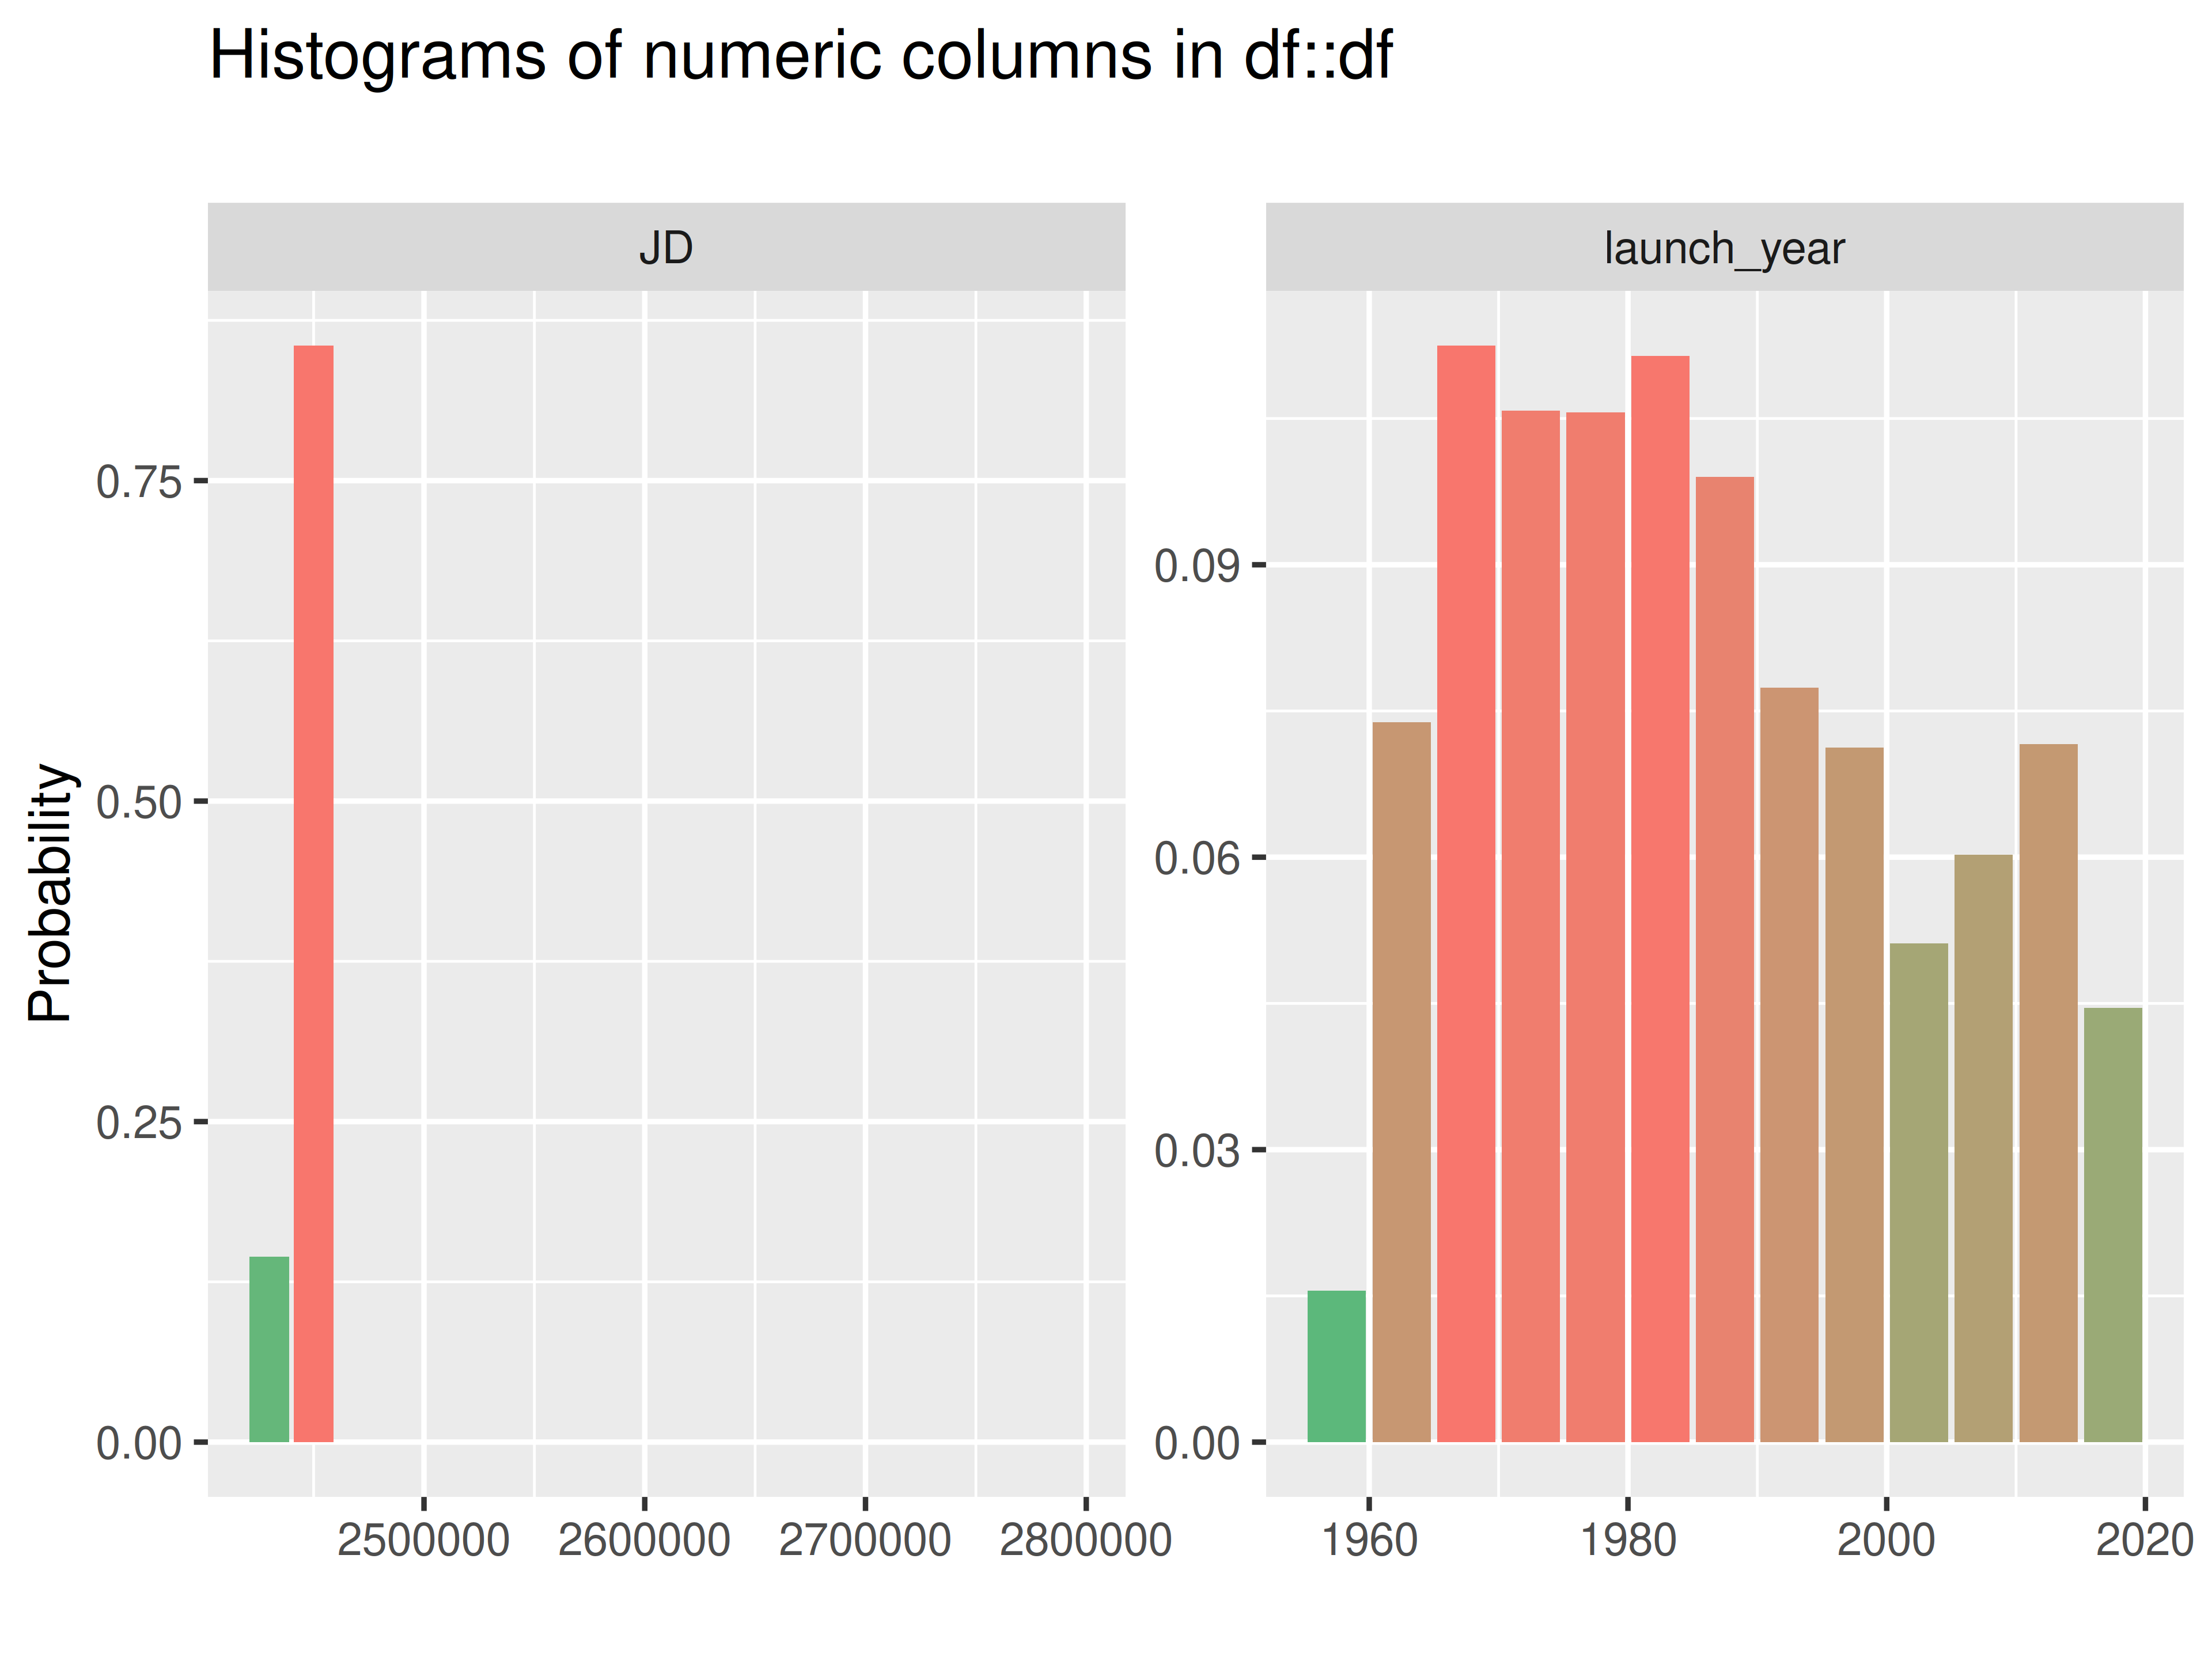
#> SUCCESS [2026-05-28 13:46:50] Completed plot type 'num'
#> SUCCESS [2026-05-28 13:46:50] inspect_plot(): all requested plots finished
#> NULL
if (length(ttd) == 2)
If two datasets in ttd:
-
check if there is at least 1 numeric column in each of the two datasets in the
ttdlist- if so, run:
inspectdf::inspect_num(
  df1 = ttd2[[1]],
  df2 = ttd2[[2]],
  breaks = 20,
  include_int = TRUE
) |>
  inspectdf::show_plot(text_labels = TRUE)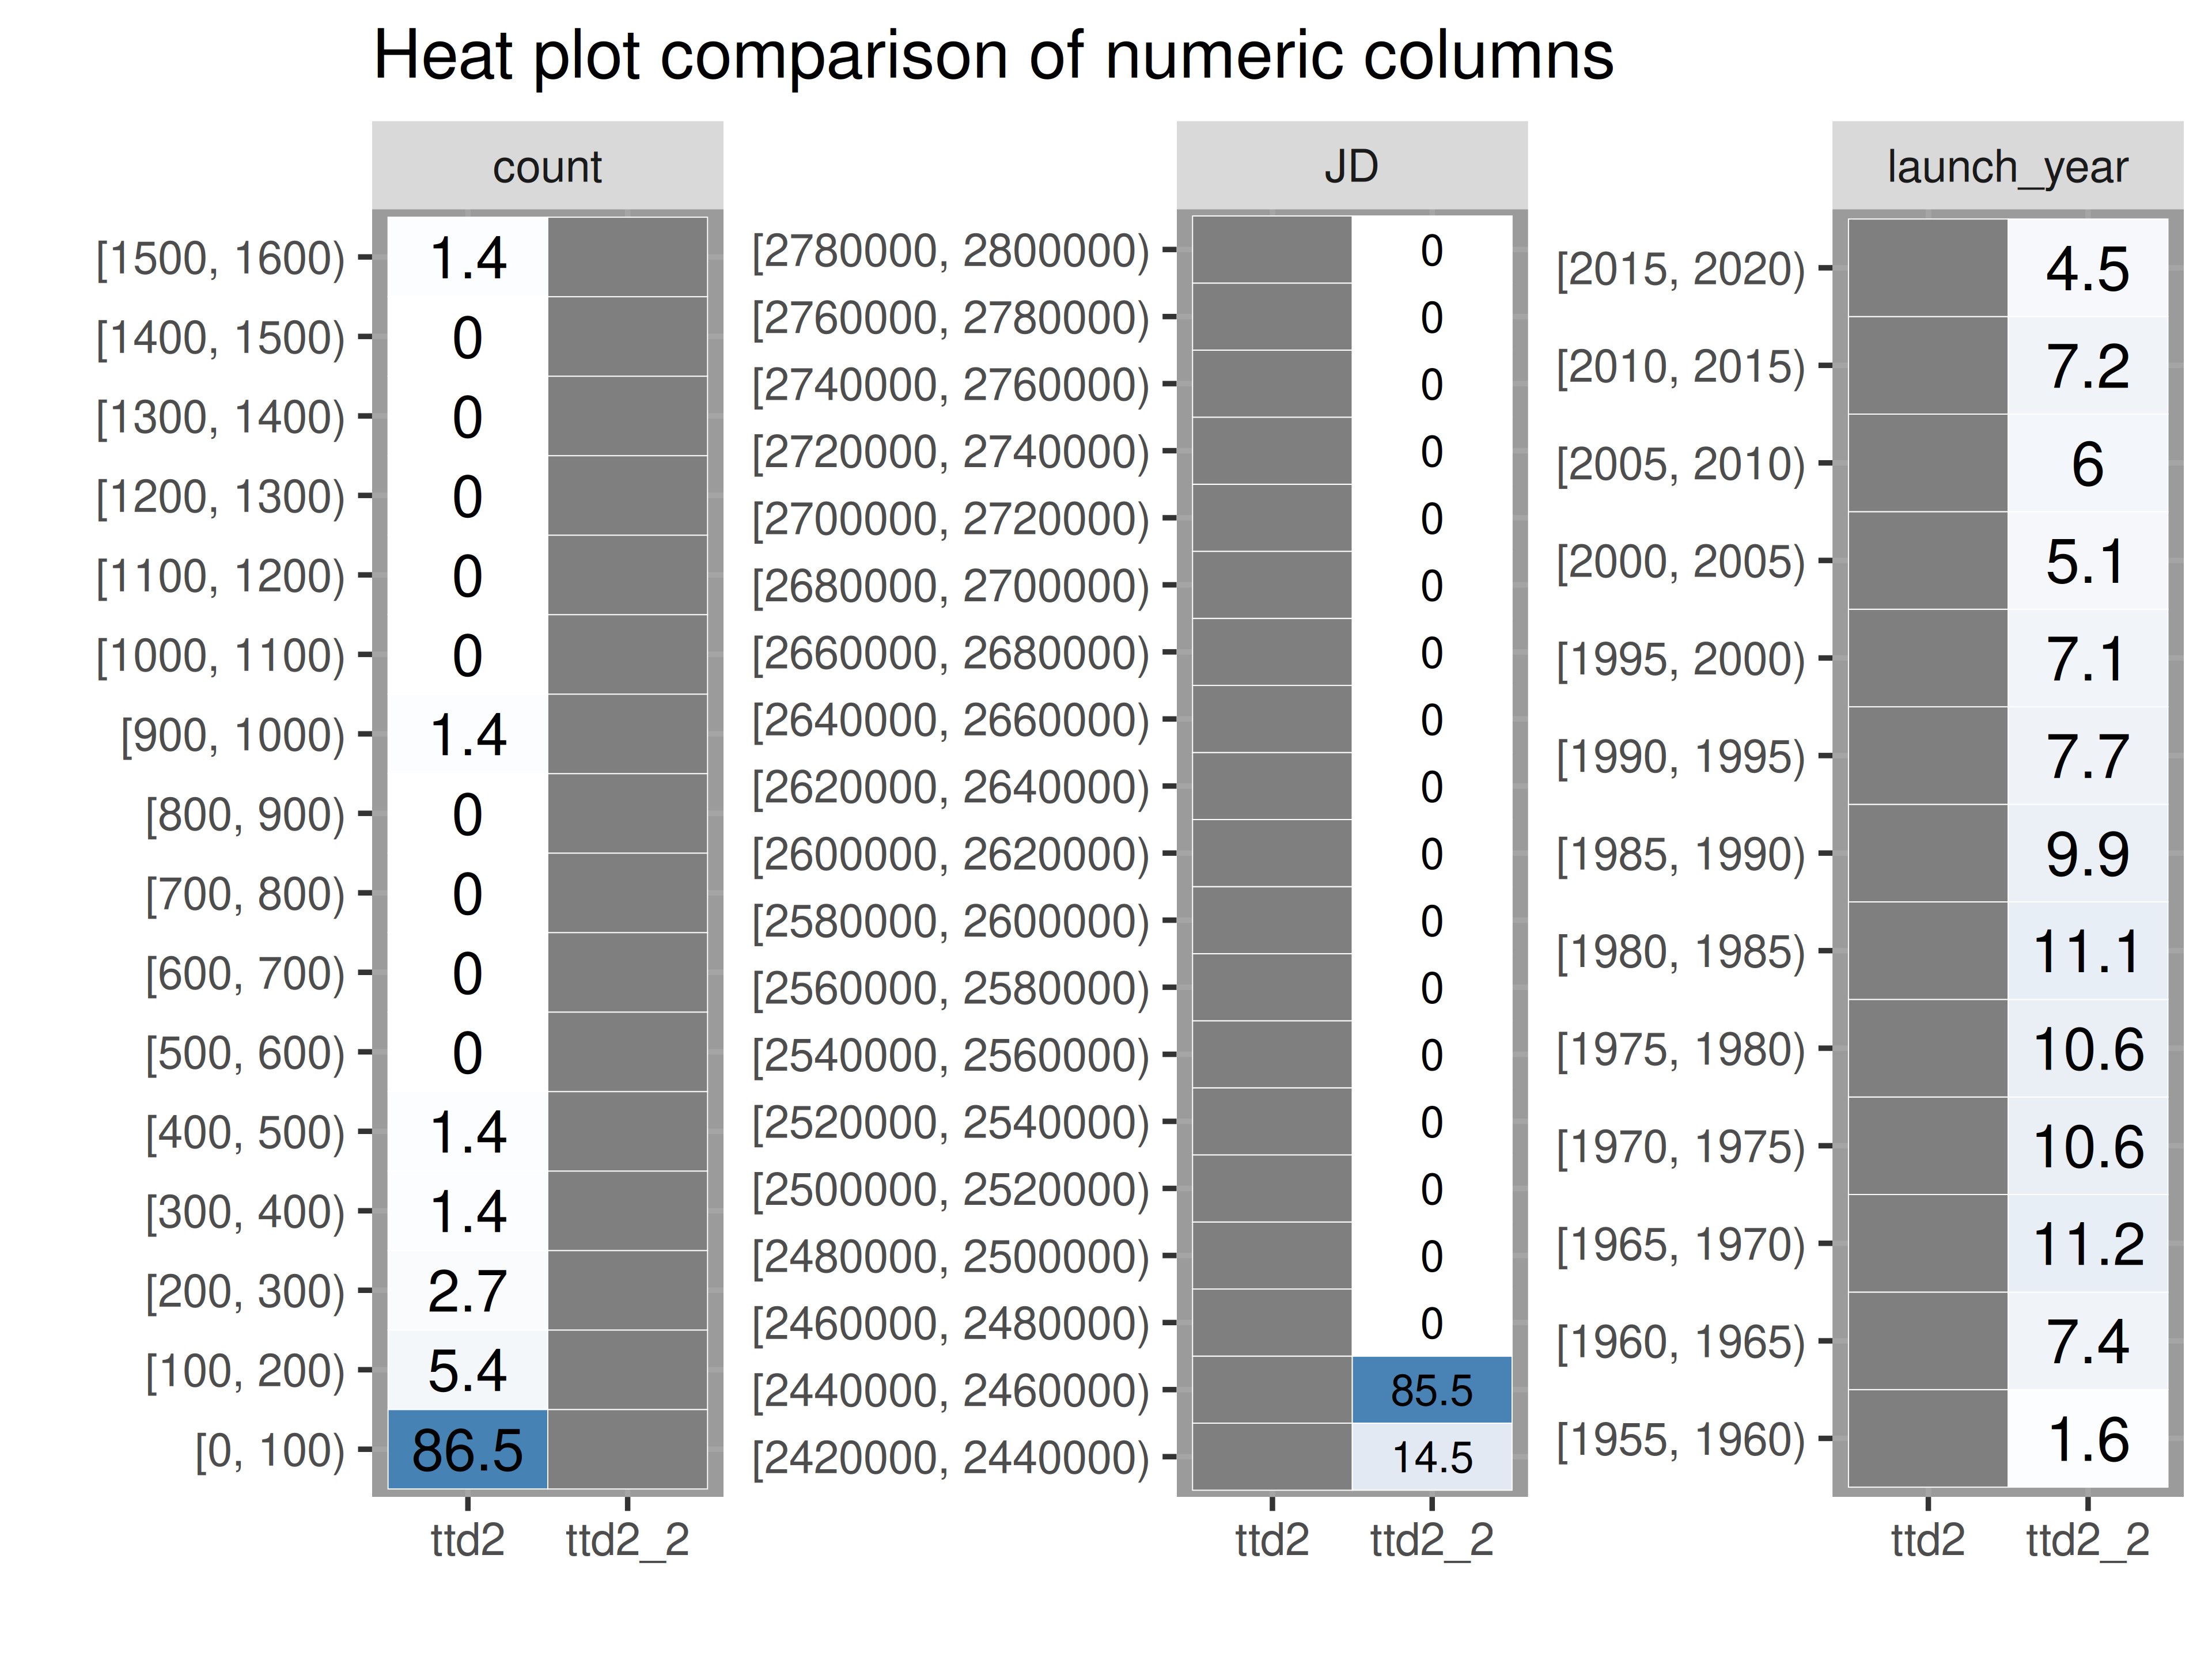
inspect_plot(
  ttd = list(
  "agencies.csv" = ttd2[[1]],
  "launches.csv" = ttd2[[2]]),
  plots = "num")
#> INFO [2026-05-28 13:46:52] inspect_plot(): starting analysis
#> INFO [2026-05-28 13:46:52] Beginning plot type 'num'
#> SUCCESS [2026-05-28 13:46:53] Completed plot type 'num'
#> SUCCESS [2026-05-28 13:46:53] inspect_plot(): all requested plots finished
#> NULL- if there is only one numeric column, run the code above on the dataset with the numeric column.
if (length(ttd) >= 3)
If more than two datasets in ttd:
inspectdf::inspect_num(
  df1 = ttd3[[1]],
  df2 = NULL,
  breaks = 20,
  include_int = TRUE
) |>
  inspectdf::show_plot(text_labels = TRUE)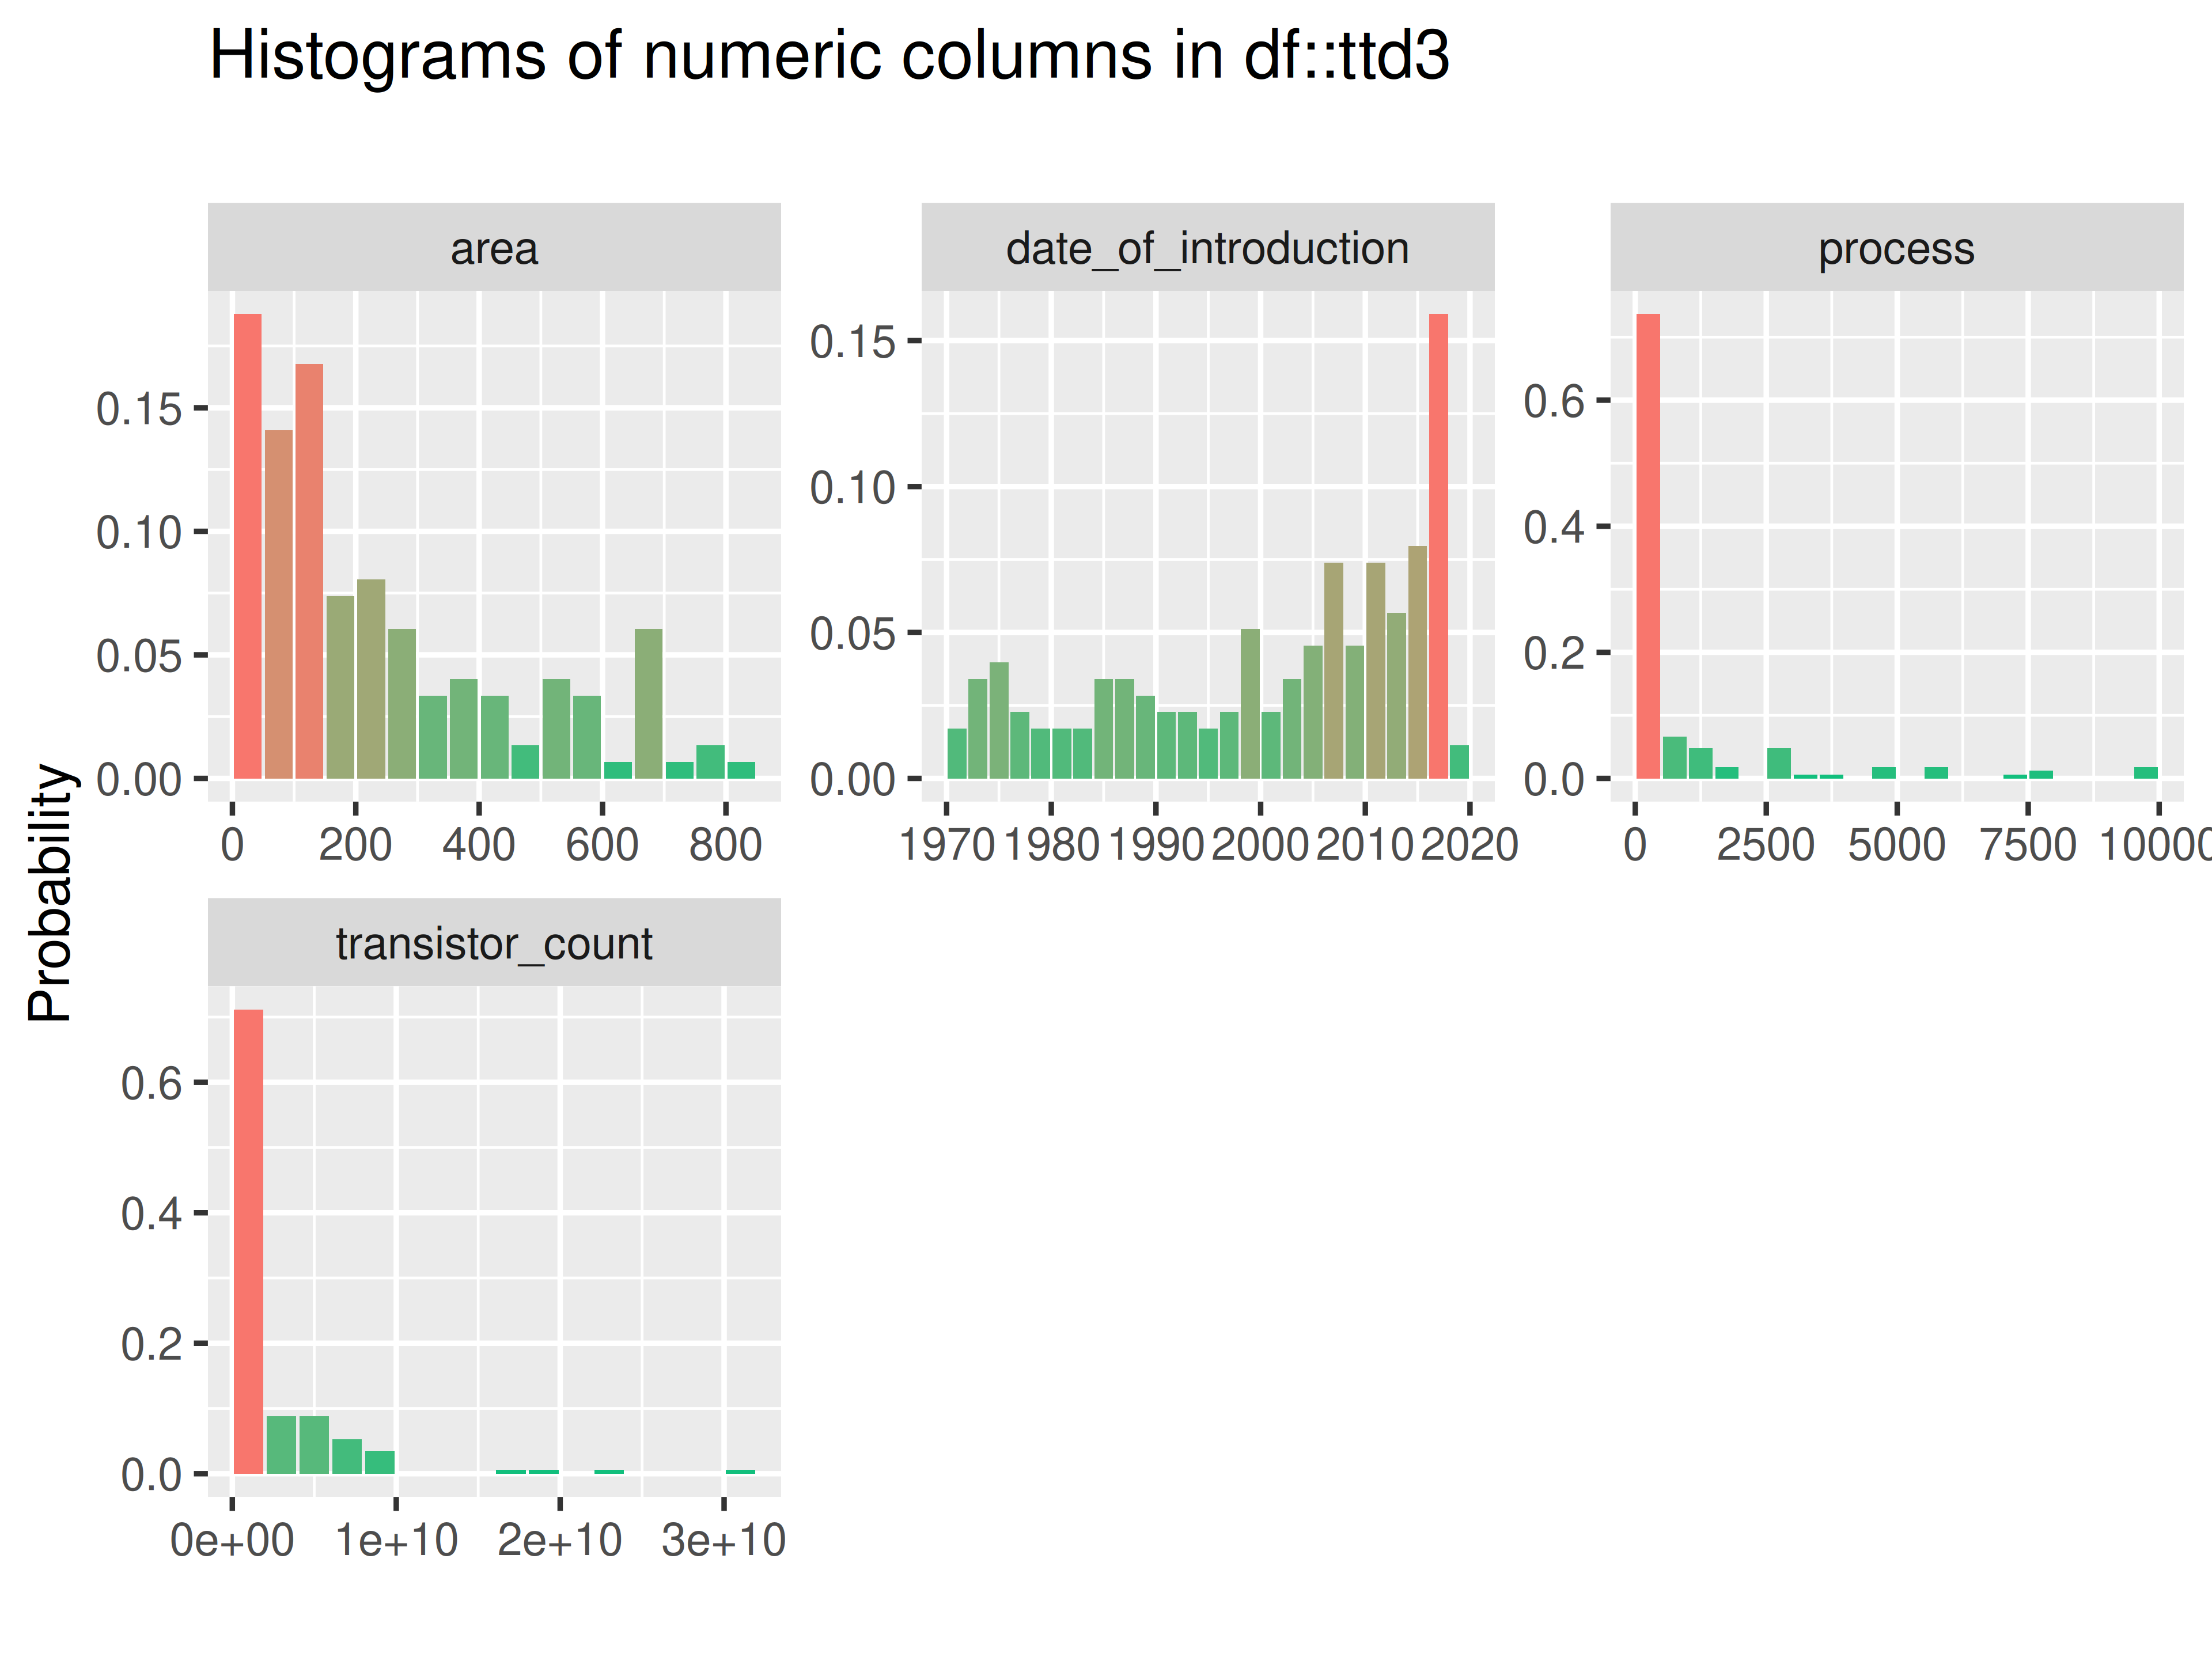
inspect_plot(
  ttd = list("cpu.csv" = ttd3[[1]]),
  plots = "num")
#> INFO [2026-05-28 13:46:55] inspect_plot(): starting analysis
#> INFO [2026-05-28 13:46:55] Beginning plot type 'num'
#> SUCCESS [2026-05-28 13:46:55] Completed plot type 'num'
#> SUCCESS [2026-05-28 13:46:55] inspect_plot(): all requested plots finished
#> NULL
inspectdf::inspect_num(
  df1 = ttd3[[2]],
  df2 = NULL,
  breaks = 20,
  include_int = TRUE
) |>
  inspectdf::show_plot(text_labels = TRUE)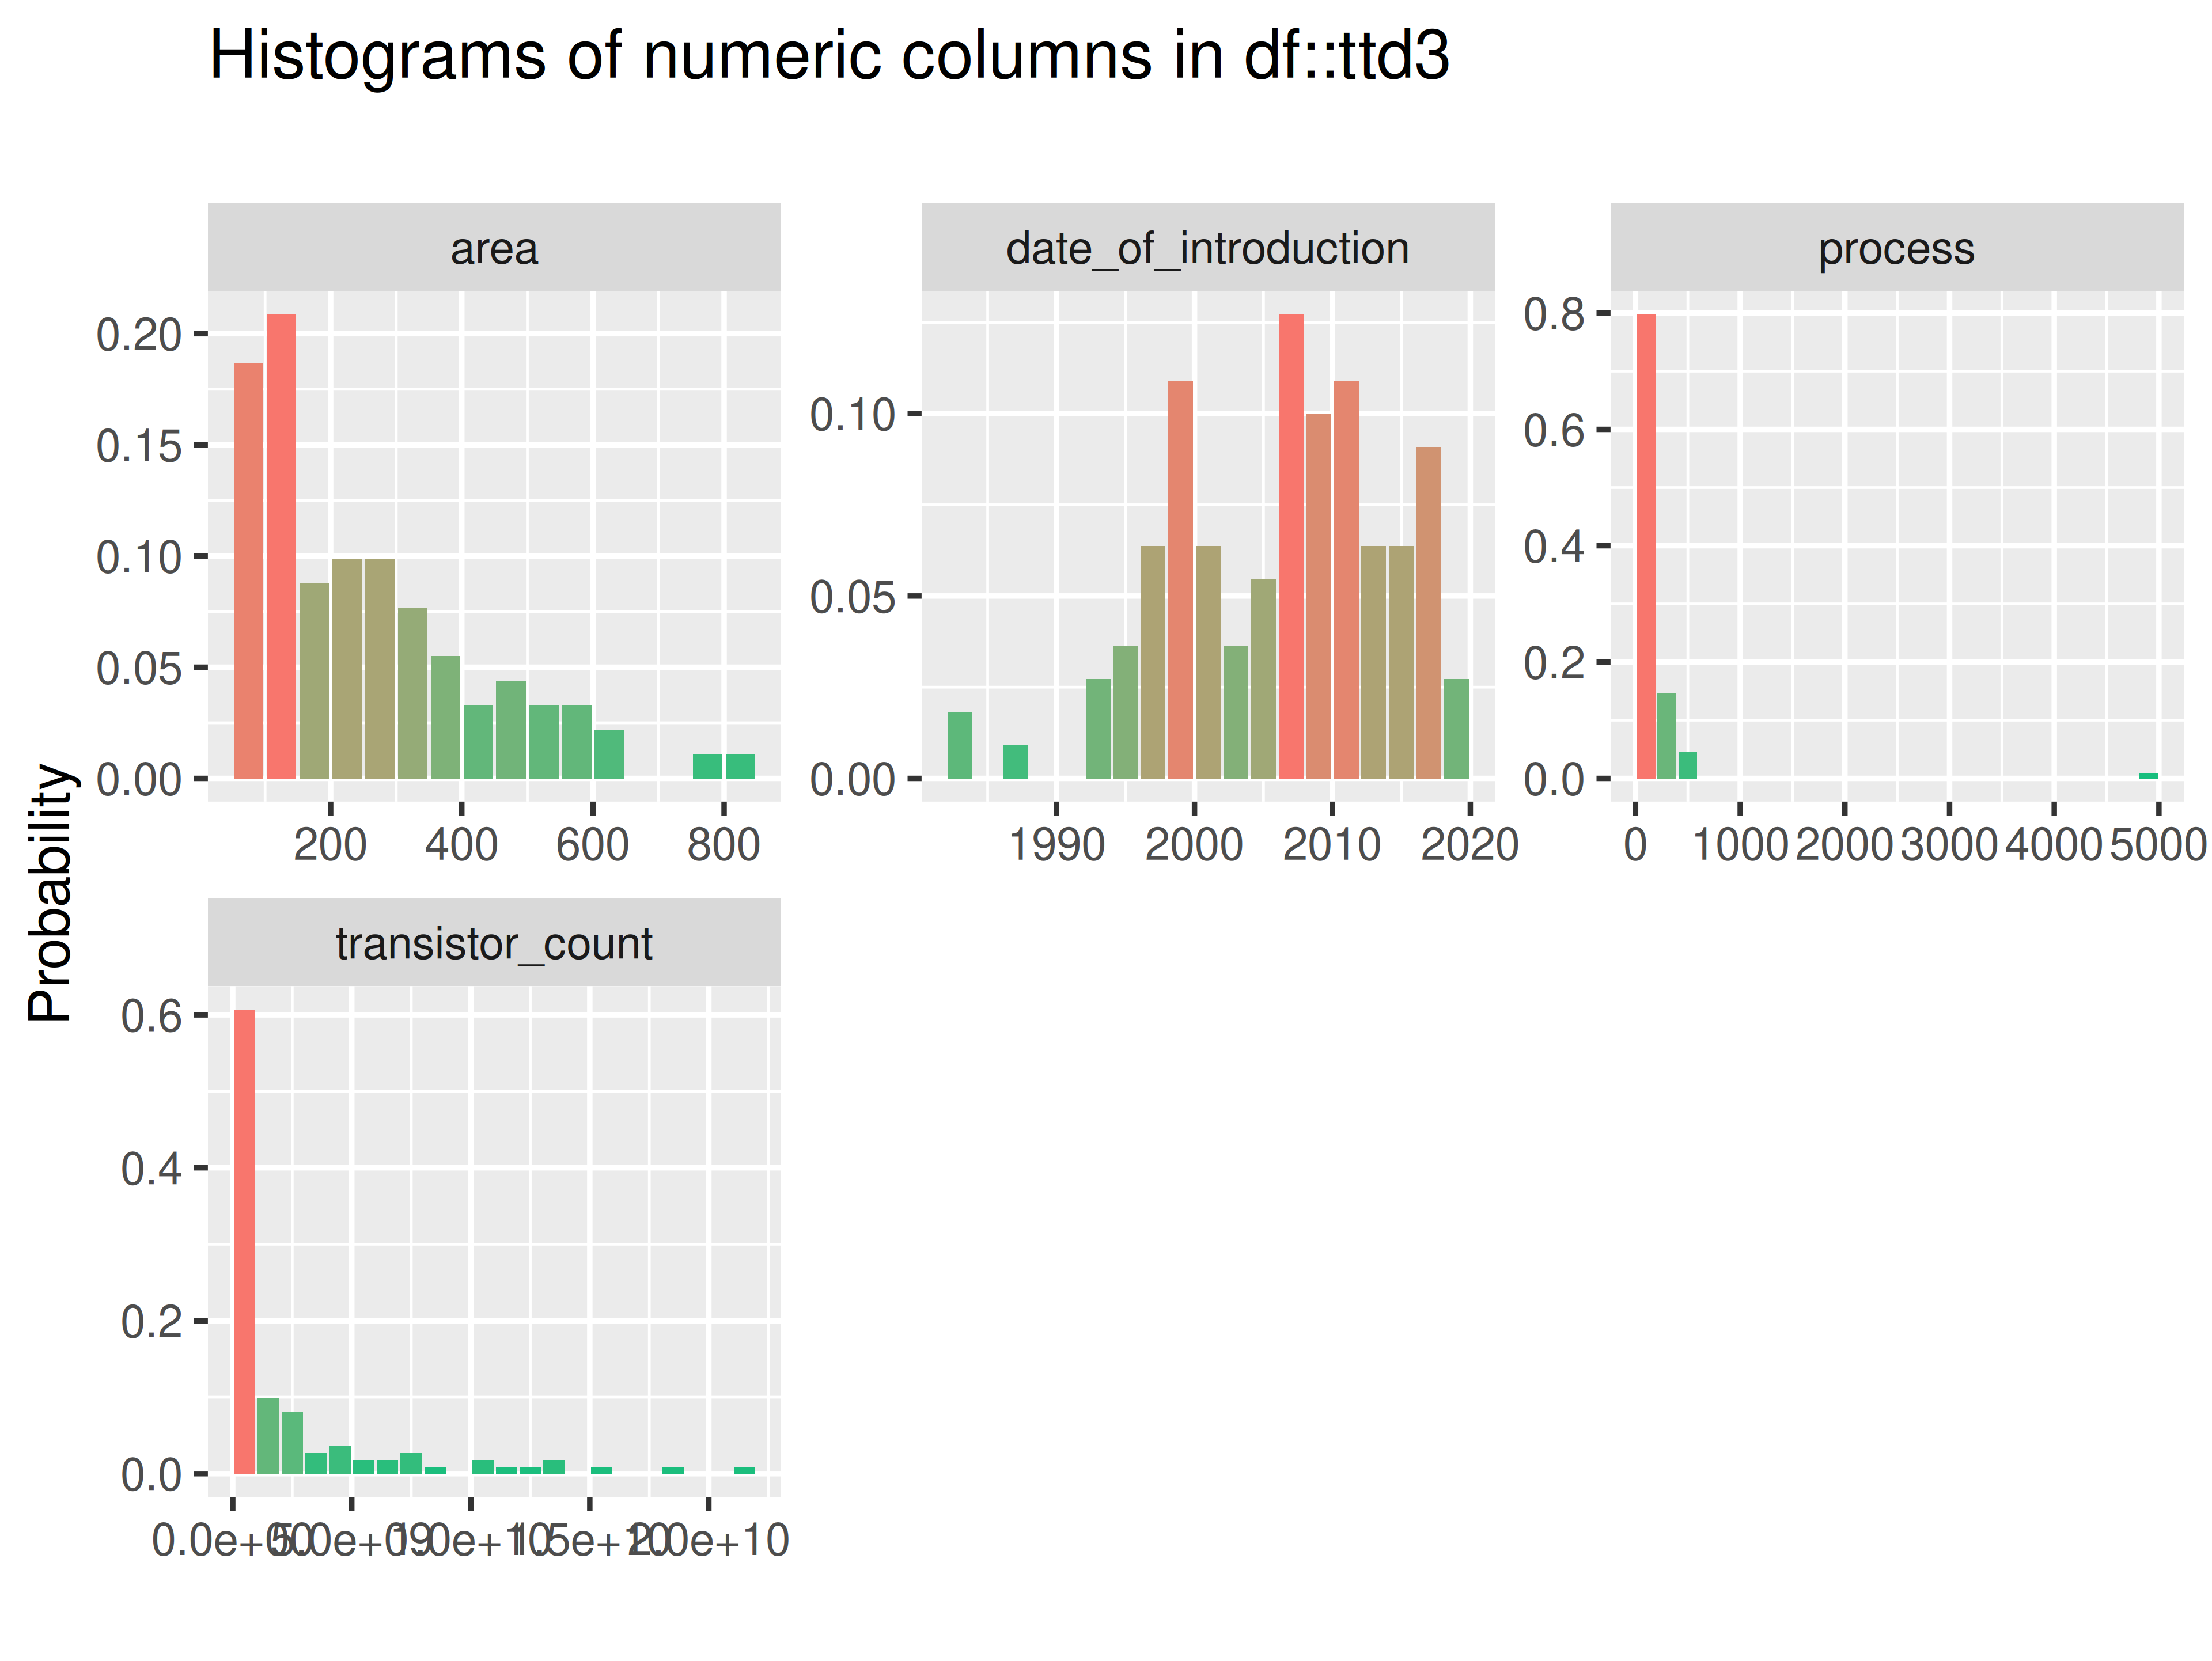
inspect_plot(
  ttd = list("gpu.csv" = ttd3[[2]]),
  plots = "num")
#> INFO [2026-05-28 13:46:57] inspect_plot(): starting analysis
#> INFO [2026-05-28 13:46:57] Beginning plot type 'num'
#> SUCCESS [2026-05-28 13:46:57] Completed plot type 'num'
#> SUCCESS [2026-05-28 13:46:57] inspect_plot(): all requested plots finished
#> NULL
inspectdf::inspect_num(
  df1 = ttd3[[3]],
  df2 = NULL,
  breaks = 20,
  include_int = TRUE
) |>
  inspectdf::show_plot(text_labels = TRUE)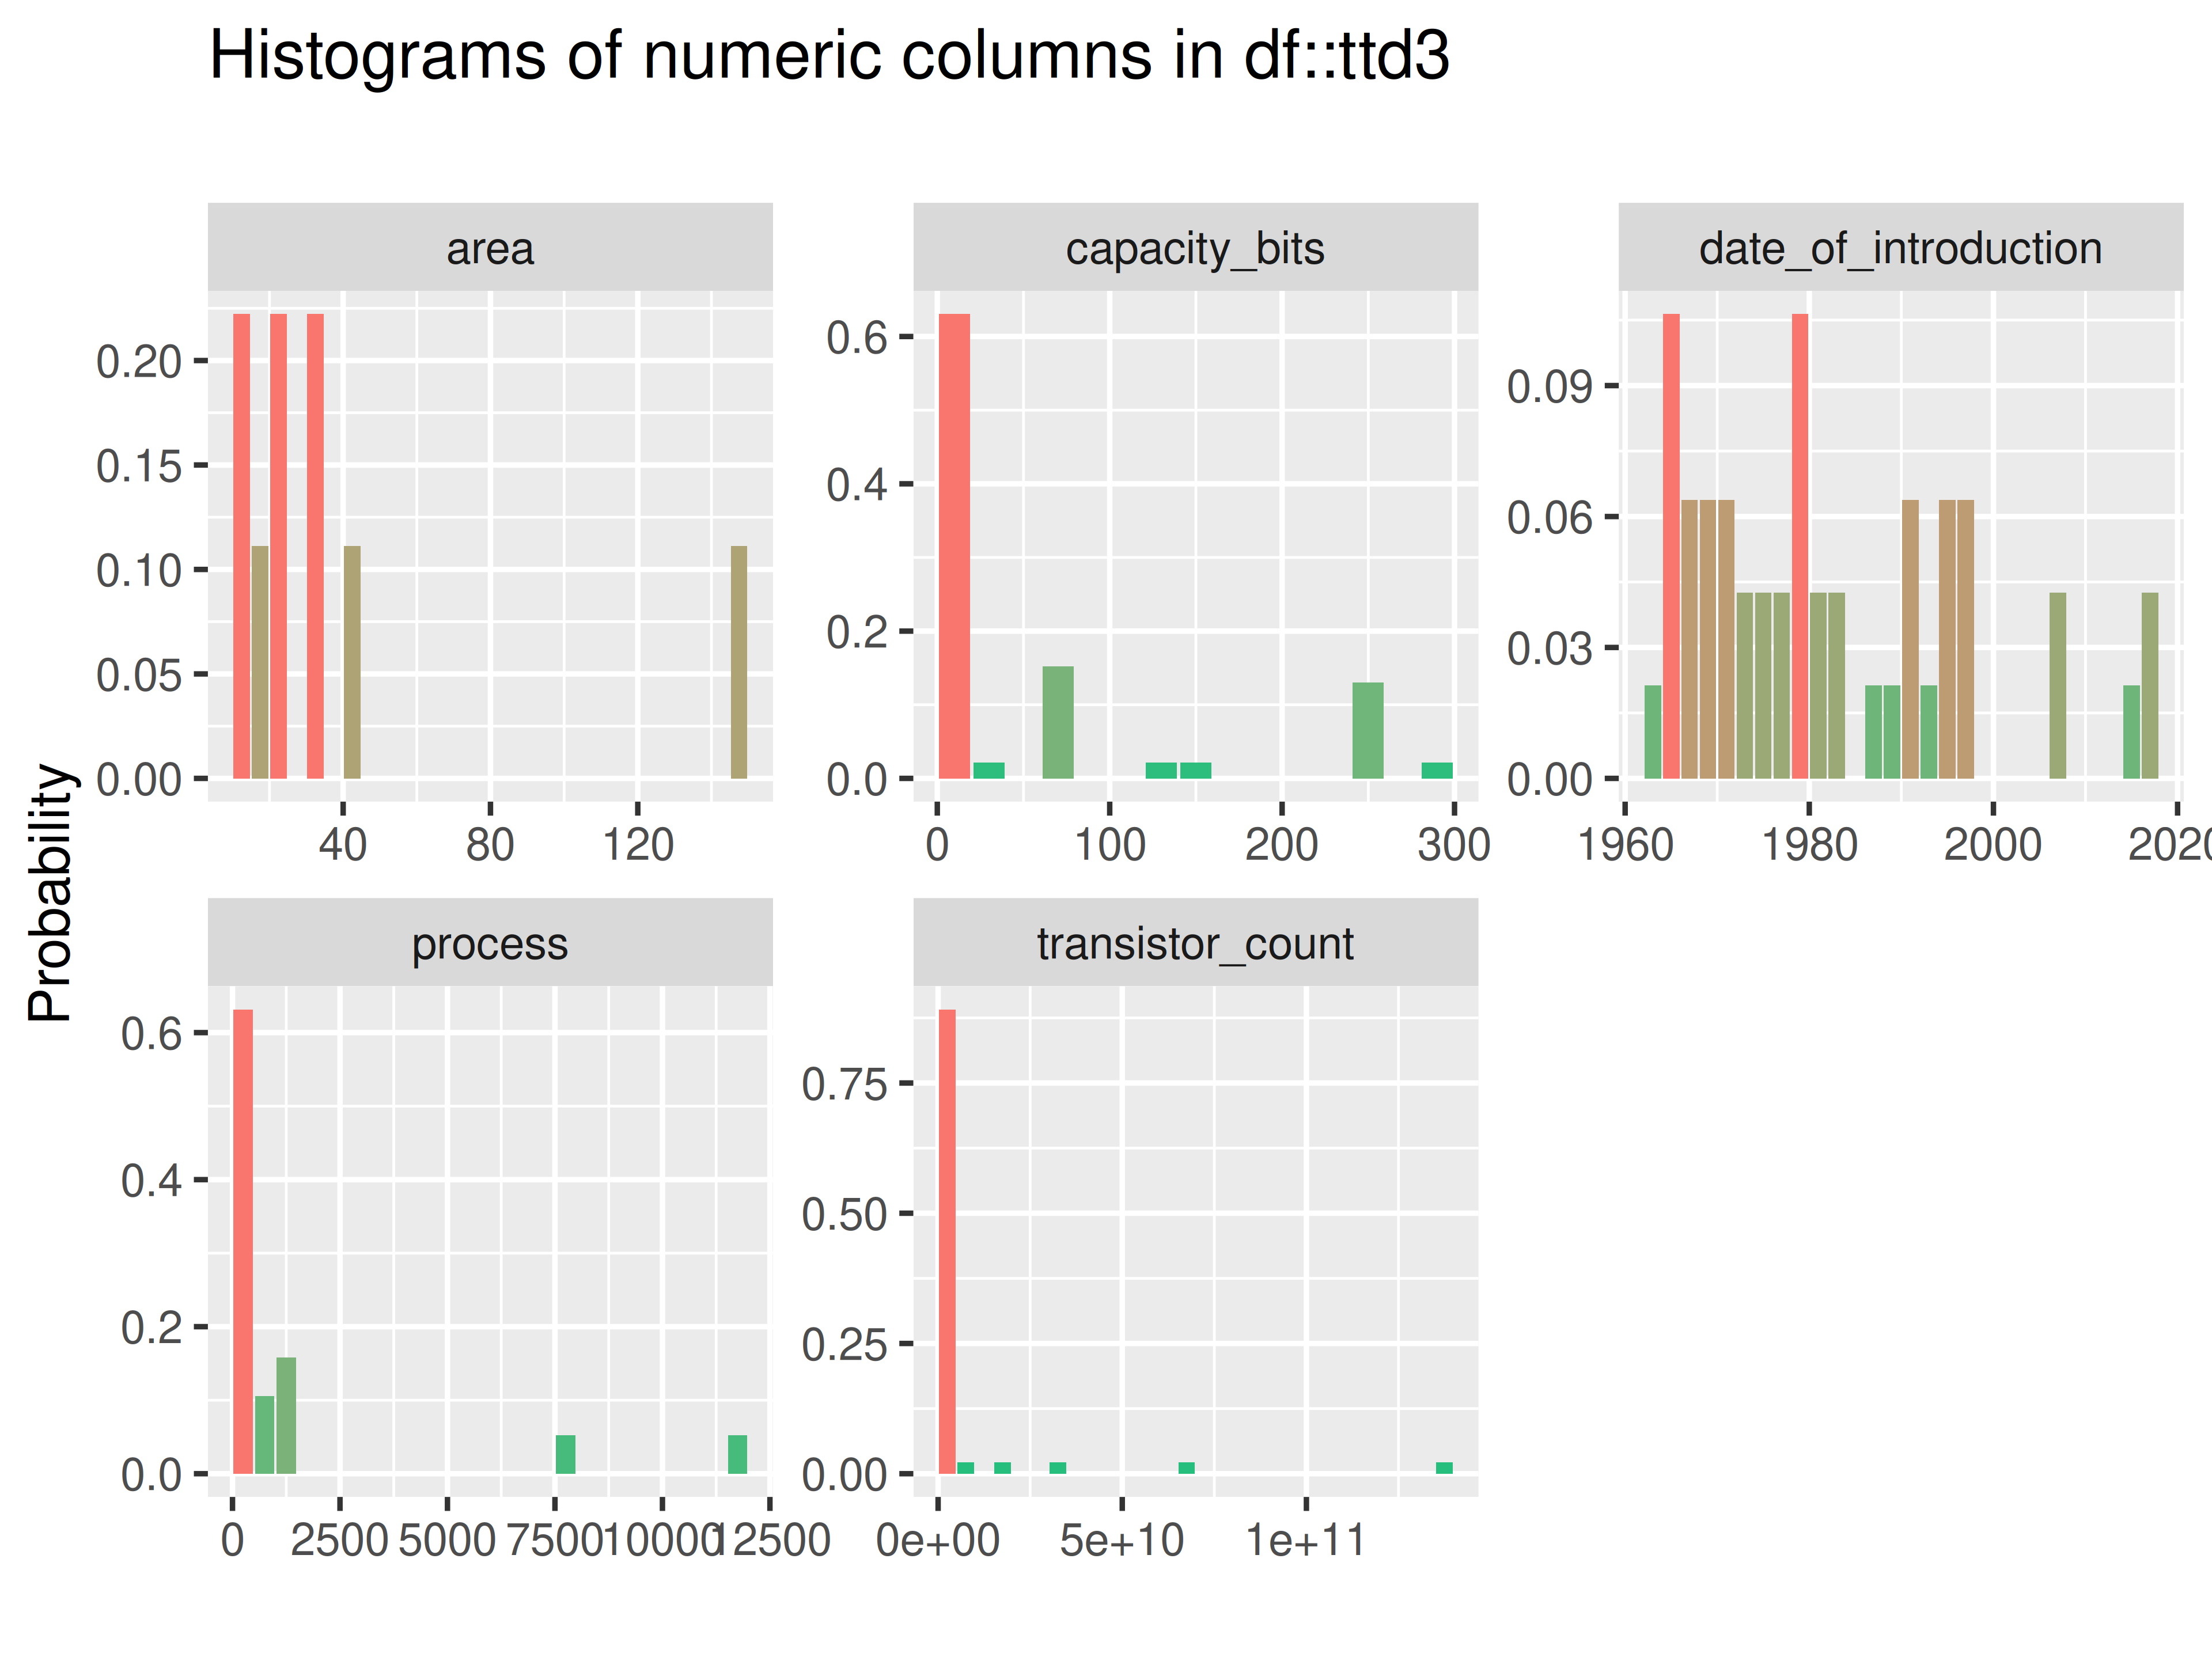
# ... for all datasets in ttd list
inspect_plot(
  ttd = list("ram.csv" = ttd3[[3]]),
  plots = "num")
#> INFO [2026-05-28 13:46:59] inspect_plot(): starting analysis
#> INFO [2026-05-28 13:46:59] Beginning plot type 'num'
#> SUCCESS [2026-05-28 13:47:00] Completed plot type 'num'
#> SUCCESS [2026-05-28 13:47:00] inspect_plot(): all requested plots finished
#> NULL
inspect_cat()
if (length(ttd) == 1)
If one dataset in ttd:
- check if there is at least 1 categorical column in the dataset in
the
ttdlist- if so, run:
inspectdf::inspect_cat(
  df1 = ttd[[1]],
  df2 = NULL,
  include_int = FALSE
) |>
  inspectdf::show_plot(text_labels = TRUE)
inspect_plot(
  ttd = list("netflix_titles.csv" = ttd[[1]]),
  plots = "cat")
#> INFO [2026-05-28 13:47:01] inspect_plot(): starting analysis
#> INFO [2026-05-28 13:47:01] Beginning plot type 'cat'
#> ERROR [2026-05-28 13:47:01] Error in plot type 'cat': In index: 1.
#> SUCCESS [2026-05-28 13:47:01] inspect_plot(): all requested plots finished
#> NULL
if (length(ttd) == 2)
If two datasets in ttd:
- check for intersecting columns in the two datasets in the
ttdlist
length(
  intersect(
    x = check_ttd_cat_cols(ttd2)[[1]],
    y = check_ttd_cat_cols(ttd2)[[2]]
  )
) > 0
#> [1] TRUE- If
TRUE, storeintersecting_columns
- Use
intersecting_columnsto subset each dataset inttdlist.
inspectdf::inspect_cat(
  df1 = ttd2[[1]][intersecting_columns],
  df2 = ttd2[[2]][intersecting_columns],
  include_int = FALSE
) |>
  inspectdf::show_plot(text_labels = TRUE)
inspect_plot(
  ttd = list(
    "agencies.csv" = ttd2[[1]][intersecting_columns],
    "launches.csv" = ttd2[[2]][intersecting_columns]
    ),
  plots = "cat")
#> INFO [2026-05-28 13:47:01] inspect_plot(): starting analysis
#> INFO [2026-05-28 13:47:01] Beginning plot type 'cat'
#> Warning in geom_bar(stat = "identity", position = "stack", colour = "black", :
#> Ignoring unknown parameters: `size`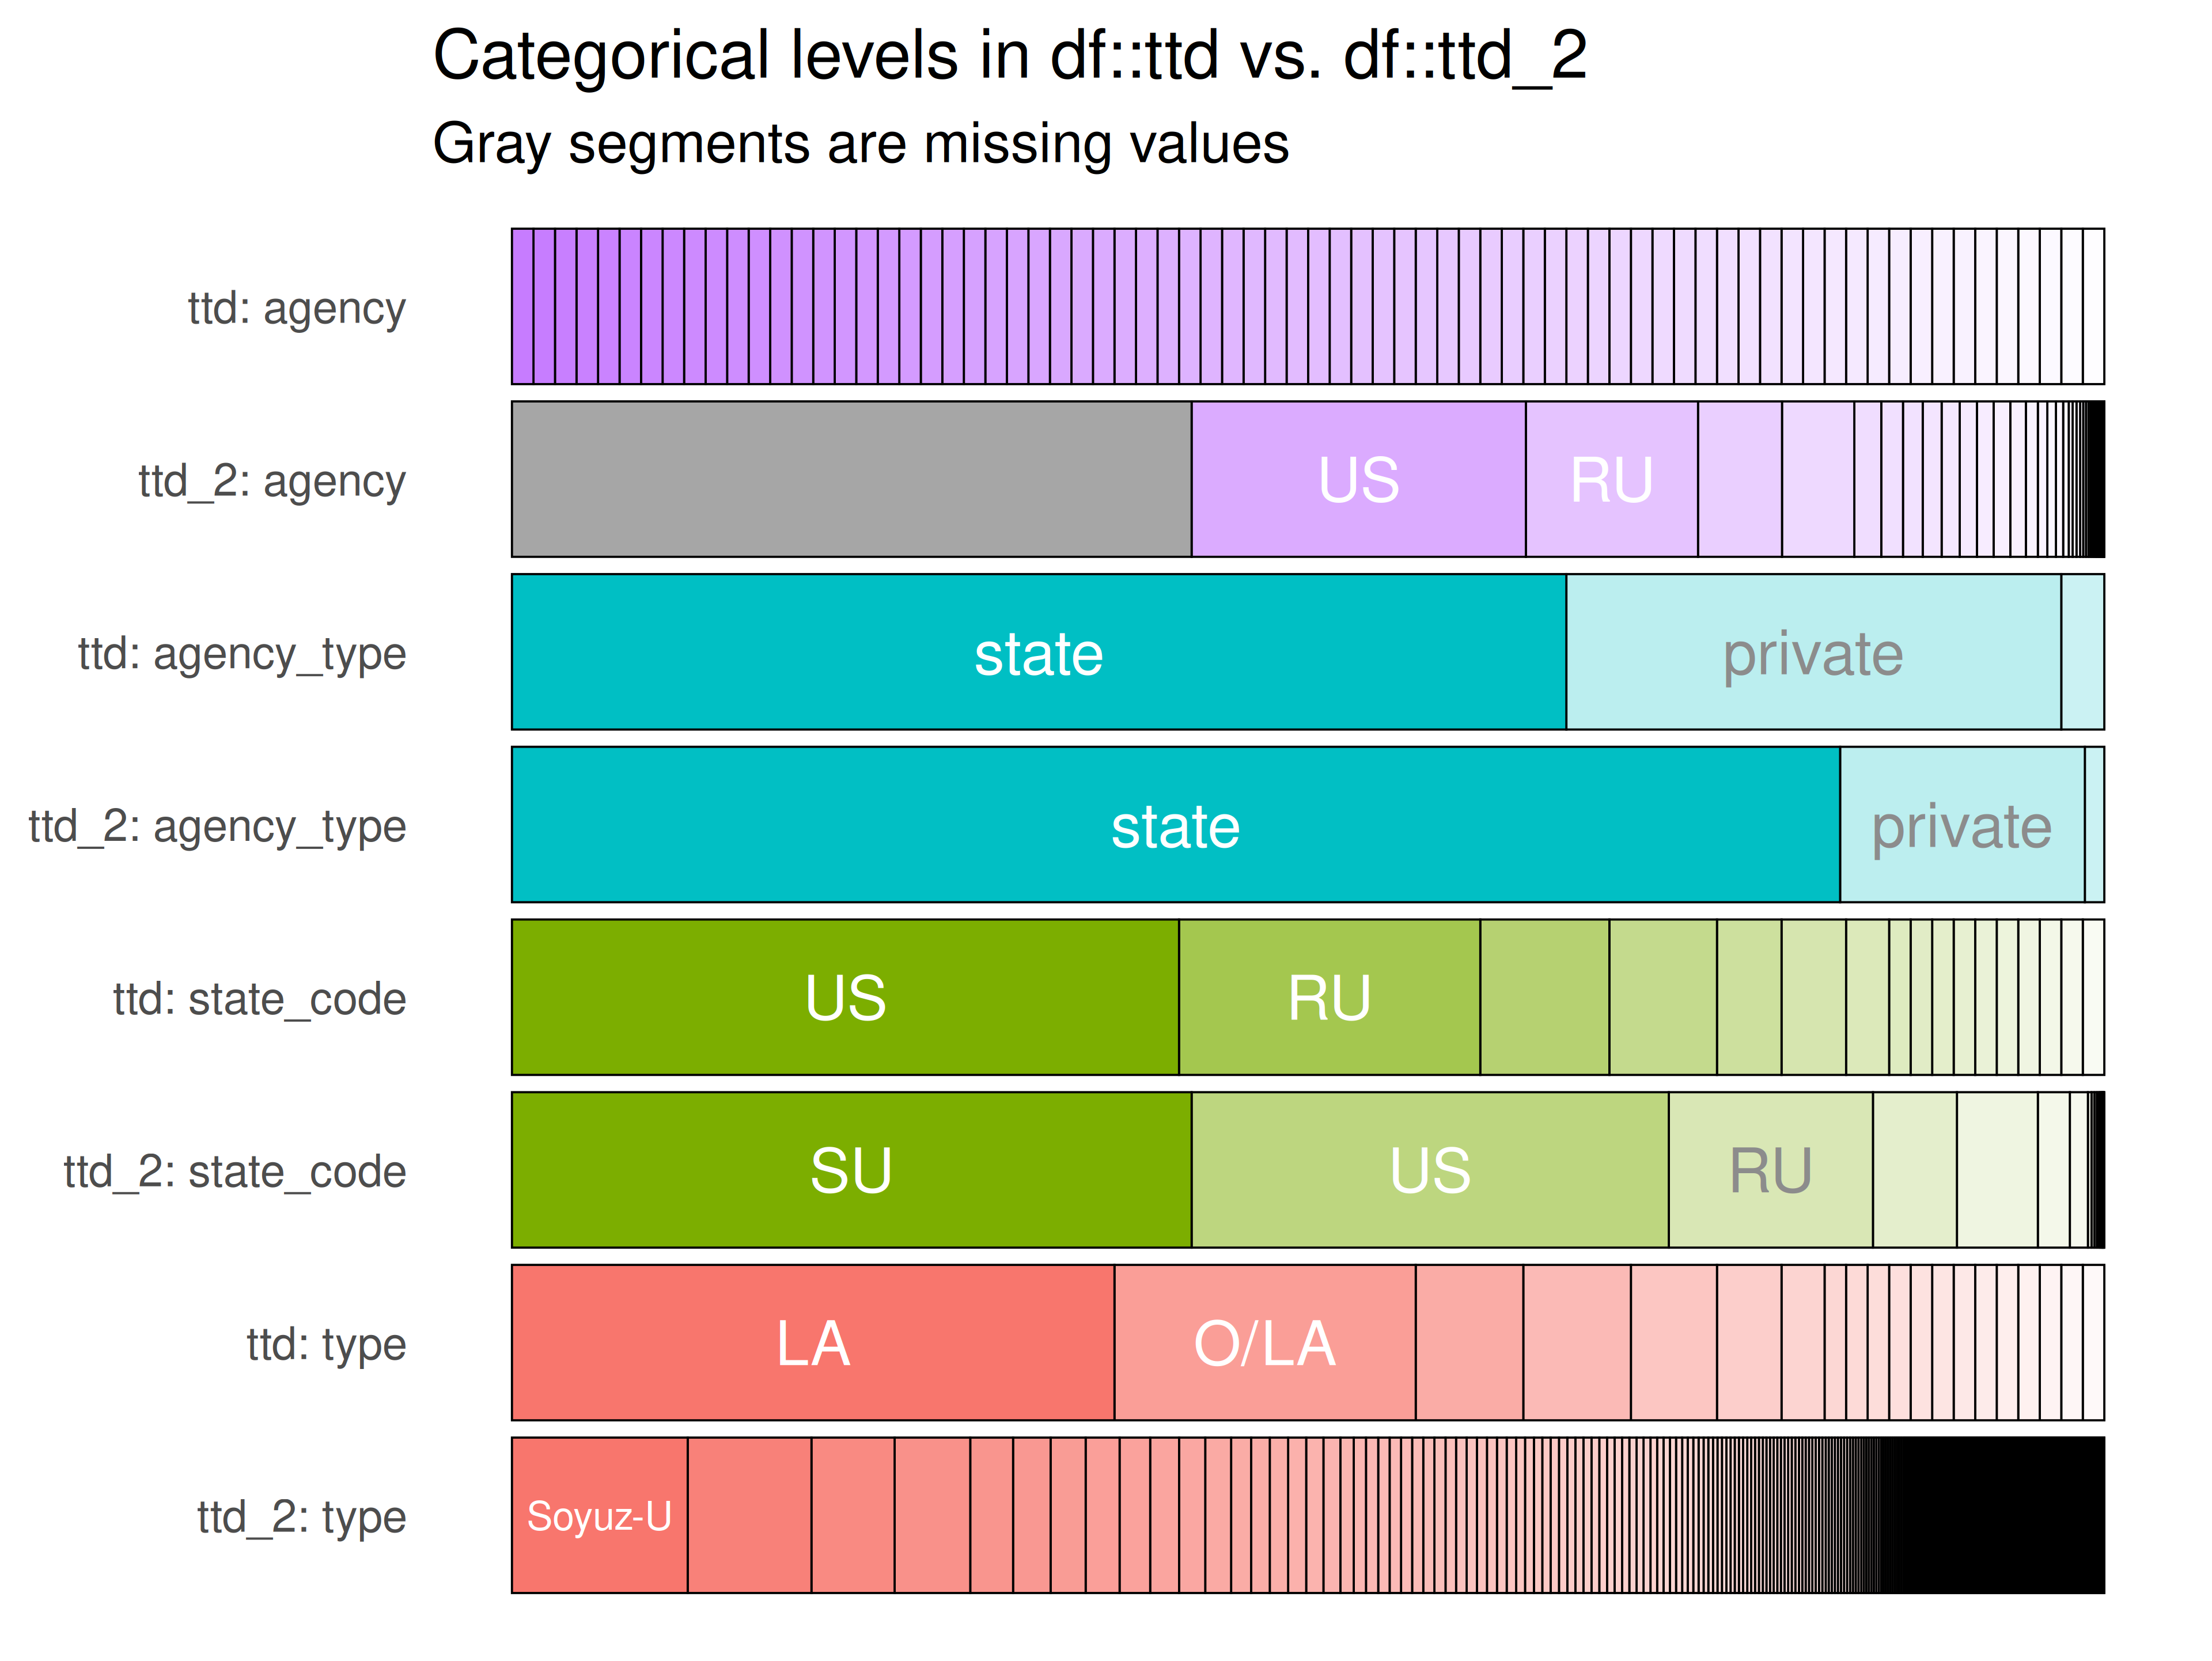
#> SUCCESS [2026-05-28 13:47:01] Completed plot type 'cat'
#> SUCCESS [2026-05-28 13:47:01] inspect_plot(): all requested plots finished
#> NULL- if there aren’t any intersecting categorical columns, run the
following on the dataset with the categorical column
ttd[[?]]:
inspectdf::inspect_cat(
  df1 = ttd[[1]],
  df2 = NULL,
  include_int = FALSE
) |>
  inspectdf::show_plot(text_labels = TRUE)
inspect_plot(
  ttd = list("netflix_titles.csv" = ttd[[1]]),
  plots = "cat")
#> INFO [2026-05-28 13:47:02] inspect_plot(): starting analysis
#> INFO [2026-05-28 13:47:02] Beginning plot type 'cat'
#> ERROR [2026-05-28 13:47:03] Error in plot type 'cat': In index: 1.
#> SUCCESS [2026-05-28 13:47:03] inspect_plot(): all requested plots finished
#> NULL
if (length(ttd) >= 3)
If more than two datasets in ttd:
inspectdf::inspect_cat(
  df1 = ttd_many[[1]],
  df2 = NULL,
  include_int = FALSE
) |>
  inspectdf::show_plot(text_labels = TRUE)
inspect_plot(
  ttd = list("colors.csv.gz" = ttd_many[[1]]),
  plots = "cat")
#> INFO [2026-05-28 13:47:03] inspect_plot(): starting analysis
#> INFO [2026-05-28 13:47:03] Beginning plot type 'cat'
#> ERROR [2026-05-28 13:47:03] Error in plot type 'cat': In index: 1.
#> SUCCESS [2026-05-28 13:47:03] inspect_plot(): all requested plots finished
#> NULL