baseball-trajectory
A small Shiny app for visualizing a baseball player’s career arc on a single metric — e.g. OPS (on-base + slugging) for batters or ERA (earned run average) for pitchers. It pulls per-season stats from the MLB Stats API, fits a weighted quadratic aging curve, and plots the player’s trajectory with a 95% confidence band and a marked peak age.
Batter metrics: OPS (on-base + slugging), OBP (on-base percentage), SLG (slugging percentage), AVG (batting average), HR (home runs), ISO (isolated power; SLG − AVG).
Pitcher metrics: ERA (earned run average), WHIP (walks + hits per inning pitched), K/9 (strikeouts per 9 innings), BB/9 (walks per 9 innings), HR/9 (home runs per 9 innings). Lower is better for ERA, WHIP, BB/9, and HR/9.
See user_guide/03-metrics.qmd for full definitions, formulas, and benchmarks.
What you can do
- See when a player peaked, how steeply they declined, and how well a smooth curve fits across seasons.
- Compare a player on any of the metrics listed above.
- Look up active players via fast typeahead, or recently-retired players via a deeper search.
- Filter out cups-of-coffee seasons with the Min PA / IP knob (minimum plate appearances for batters or innings pitched for pitchers).
Install
Create and activate a virtual environment first (required on Debian/Ubuntu and other externally-managed Python installs — .venv/ is already git-ignored):
python3 -m venv .venvsource .venv/bin/activateThen install in editable mode with the dev extras:
pip install -e ".[dev]"Run
baseball-trajectoryThen open http://127.0.0.1:8000 in a browser.
Usage
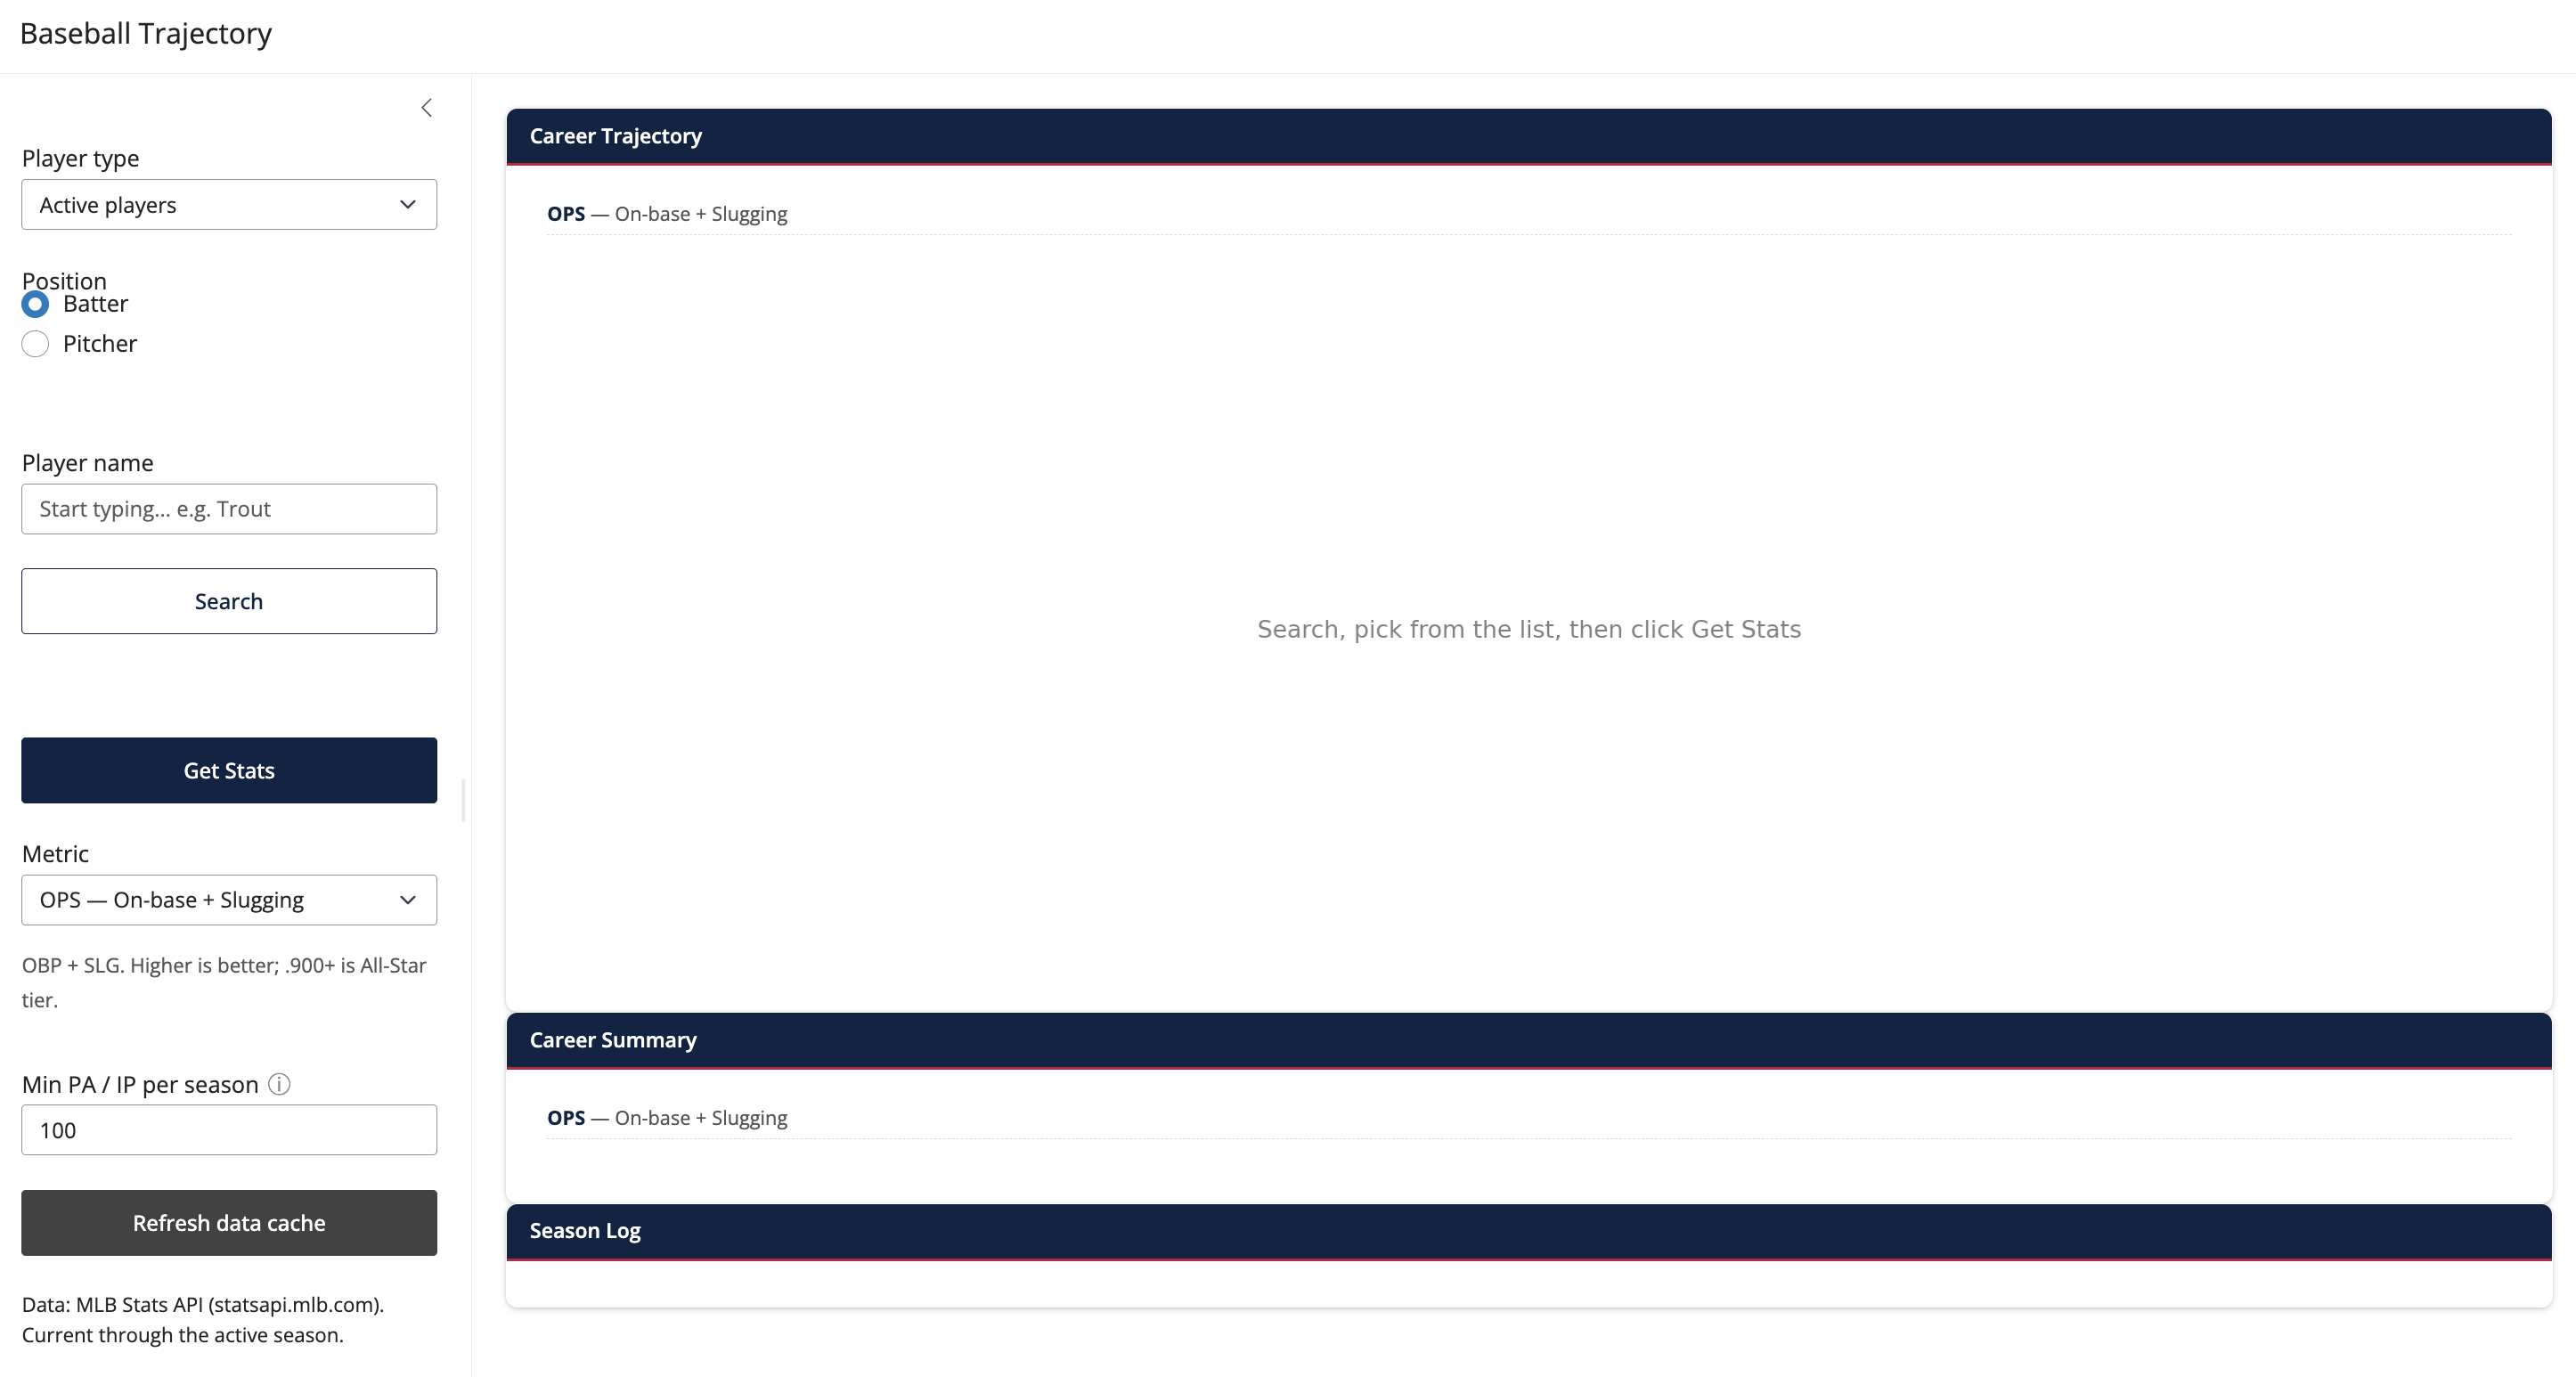
The sidebar workflow is two-step: find a player, then load their stats. Each step has its own button.
- Player type — Active players (fast typeahead, current season + 3 prior) or Retired players (deeper window, ~50 seasons).
- Position — Batter or Pitcher. Swaps the metric list and the weight column.
- Type a name in the Player name box (≥2 characters). The dropdown auto-populates as you type, with each row labelled Player Name — Position (Debut–Final), e.g. Mike Trout — CF (2011–Active). The dropdown is filtered by the Position toggle: Pitcher only shows
PandTWP(two-way players); Batter shows everything except pure pitchers. That stops you from picking a position player while Pitcher is selected and seeing an empty curve. - Pick a player from the dropdown. A small info card appears beneath the picker showing the full name, position, and debut–final seasons.
- Click Get Stats. The trajectory plot, career summary, and season log all update.
The plot only updates on Get Stats — picking from the dropdown alone does nothing — so the chart stays stable while you browse search results.
Looking up a retiree? Switch Player type to Retired players. The auto-typeahead window widens to ~50 seasons (Griffey, Pedro, Nolan Ryan, etc. all come up). For pre-1976 retirees, click the Search button to do an even deeper ~80-season lookup.
Other controls:
- Metric — drives the y-axis of the trajectory plot. The dropdown labels expand the acronyms (e.g. OPS — On-base + Slugging, ERA — Earned run average).
- Min PA / IP per season — filters out partial seasons before the curve is fit. Hover the ⓘ icon next to the label for details.
- Refresh data cache — clears the in-process cache so the next search re-downloads from the MLB Stats API.
Data sources
Stats come from the MLB Stats API (statsapi.mlb.com), the official source of record for Major League Baseball statistics. Data is current through the active season and is updated nightly by MLB. All endpoints are called directly via requests:
GET /api/v1/sports/1/players?season={year}— full season roster, used for typeahead and deep search.GET /api/v1/people/{id}— biographical data (birth date, full name).GET /api/v1/people/{id}/stats?stats=yearByYear&group={group}— per- season career splits.
All API responses arrive as Python dicts/lists and are converted to Polars DataFrames immediately. Use baseball_trajectory.data.refresh_cache() (or the Refresh data cache sidebar button) to force a re-fetch within a running session.
Tech stack
Polars for all data manipulation (no pandas in this codebase; all API responses are converted from dicts/lists directly).
requests for direct calls to the MLB Stats API.
statsmodels for the weighted least-squares aging-curve fit.
matplotlib for the trajectory chart.
Shiny for Python (core API, not express) for the UI.
Modeling approach
For each player, the app fits a weighted quadratic curve to per-season metric values:
y = a + b * Age + c * Age^2The fit is a weighted least-squares regression with weights equal to plate appearances (PA, batters) or innings pitched (IP, pitchers), so seasons with more playing time pull the curve harder than partial seasons. When the quadratic term c is negative, the curve has a maximum at Age = -b / (2c) — that’s the player’s fitted peak age.
Predictions over a fine age grid include a 95% confidence band, drawn as a shaded ribbon on the chart.
Project structure
baseball-trajectory/
├── pyproject.toml
├── requirements.txt        # runtime deps for Connect Cloud
├── app.py                  # Connect Cloud primary-file shim
├── README.md
├── .gitignore
├── great-docs.yml          # docs site config
├── assets/                 # README-only images (landing page screenshot)
├── src/
│   └── baseball_trajectory/
│       ├── __init__.py     # version
│       ├── __main__.py     # console-script entry point
│       ├── data.py         # MLB Stats API queries + Polars loaders
│       ├── model.py        # WLS aging-curve fit + summaries
│       ├── plots.py        # matplotlib trajectory chart
│       └── app.py          # Shiny UI + server
├── user_guide/              # Great Docs narrative sources (.qmd)
├── tests/
│   ├── __init__.py
│   └── test_model.py
└── .github/
    └── workflows/
        └── docs.yml        # CI auto-deploy docs to GitHub Pages
Documentation
Full user docs (Getting started, User guide, Modeling approach, Data sources, API reference, Limitations) live under user_guide/ and are built with Great Docs, which also auto-generates the API reference from docstrings and turns this README into the site’s landing page.
Install the docs extras (requires Quarto on PATH):
pip install -e ".[docs]"Build the static site to great-docs/_site/:
great-docs buildPreview it locally:
great-docs previewPublishing
Documentation → GitHub Pages
After pushing the project to a GitHub repository, the docs can be served from https://<user>.github.io/<repo>/ via GitHub Pages.
The workflow at .github/workflows/docs.yml (generated with great-docs setup-github-pages) builds the site with Quarto on every push and pull request, and deploys it to GitHub Pages on pushes to main — including PR preview deployments. To enable it:
- Settings → Pages → Source: GitHub Actions
- Push to
main. The workflow runs and publishes the artifact.
The first run requires a workflow approval if your account uses required-reviewer policies on Pages deployments.
To regenerate the workflow (e.g. after changing Python version or package manager), run great-docs setup-github-pages --force again.
App → Posit Connect Cloud
The repo includes two files at the root that make the project deployable to Posit Connect Cloud out of the box:
requirements.txt— Connect Cloud’s installer reads only this file. It does not runpip install -e .againstpyproject.toml.app.py(at the root) — a deployment shim. Connect Cloud loads its primary file and looks for anappobject; this shim addssrc/tosys.pathand re-exports the Shiny app frombaseball_trajectory.app.
To deploy:
- Push the project to a GitHub repository (Connect Cloud deploys from GitHub).
- In Connect Cloud, click New Content → Shiny for Python.
- Select your GitHub repository and branch.
- Set Primary file to
app.py(the root one, notsrc/baseball_trajectory/app.py). - Click Deploy.
The app reaches out to https://statsapi.mlb.com for roster and career data — if your Connect Cloud account has egress controls, allowlist that host.
For full deployment details (pinning, container deploys, other Shiny hosts), see the Deployment page (user_guide/07-deployment.qmd) in the docs site.
Package distribution
GitHub Pages doesn’t host Python packages — that’s PyPI’s job. Until the package is on PyPI, users can install it directly from a GitHub URL.
From the default branch:
pip install git+https://github.com/<user>/baseball-trajectory.gitFrom a tagged release (recommended once you’ve cut one):
pip install git+https://github.com/<user>/baseball-trajectory.git@v0.1.0To cut a release, create an annotated tag and push it:
git tag -a v0.1.0 -m "v0.1.0"git push origin v0.1.0Then attach release notes via the GitHub Releases UI or the gh CLI.
If you later publish to PyPI, the hatchling build backend already configured in pyproject.toml is sufficient — python -m build produces both wheel and sdist, and twine upload dist/* pushes them.
Limitations
- Typeahead covers the current season + 3 prior seasons only — fast, but retirees won’t show up in the live dropdown. Clicking Search with no match falls back to a ~30-season deep lookup that covers most modern retirees (back to roughly 1996 from a 2026 perspective).
- Players who retired before the deep-search window aren’t reachable through the UI. The MLB Stats API has older records; if you need them, the app would have to call the all-time
/people/searchendpoint. - The aging-curve fit assumes a single quadratic shape. Players with unusual career arcs (late bloomers, injury-shortened careers, mid-career position changes) won’t be modeled well.
- Multi-team seasons (when a player is traded mid-year) are aggregated by summing counting stats; ERA and all per-9 rates are recomputed as IPouts-weighted averages across stints.
- No park or league-strength adjustments — raw counting and rate stats only.
- Age is computed as of July 1 of each season (the standard mid-season rule); players born in July or later are counted as one year younger.