topSystem
This chapter covers monitoring performance and resource usage in the Linux systems. These commands will help ensure that the servers and applications are running efficiently and can help you preemptively address potential issues before they escalate into major problems.
We’ll delve into some of the most essential and widely-used system monitoring commands: top, htop, free, df, and du
Real-time monitoring
top
top displays a dynamic, real-time view of the system’s processes, including CPU and memory usage.
top in iTerm2htop
htop is a more user-friendly and visually appealing alternative to top.1
htop in GNOMEhtop enhances usability with features like color coding, an interactive interface, and the ability to scroll through processes.
Snapshots
free
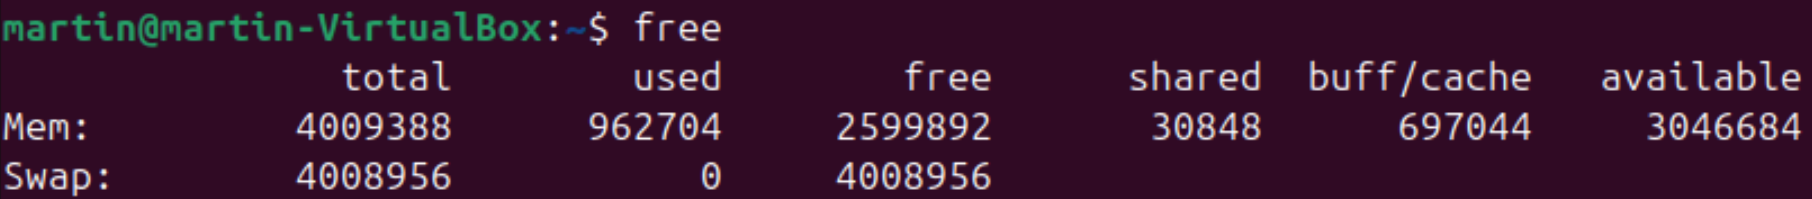
free displays the amount of free and used memory in the system, giving you a quick snapshot of memory allocation and availability:
Bash ![]() on Linux
on Linux ![]() .
.
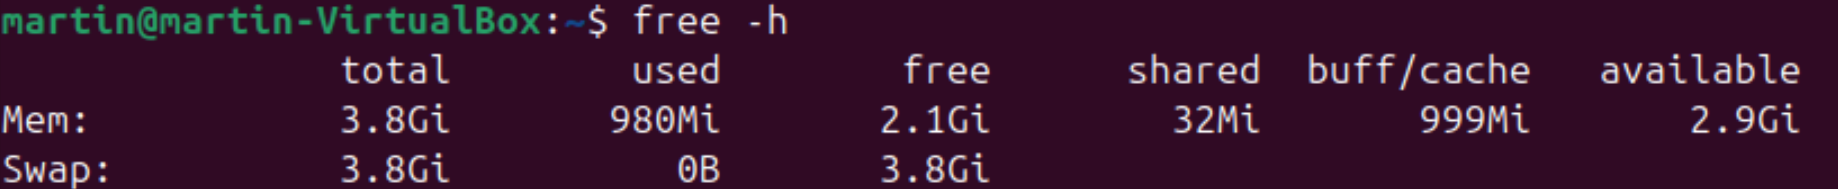
You can add -h to make it more human-readable:
df
df (disk free) shows disk usage in a human-readable format, including the size, used space, available space, and the mount point of each filesystem.
df
#> Filesystem                       512-blocks      Used Available Capacity iused     ifree %iused  Mounted on
#> /dev/disk1s1s1                    976490576  20002808  84798224    20%  403755 423991120    0%   /
#> devfs                                   395       395         0   100%     684         0  100%   /dev
#> /dev/disk1s3                      976490576   5059568  84798224     6%    5077 423991120    0%   /System/Volumes/Preboot
#> /dev/disk1s5                      976490576   2097312  84798224     3%       1 423991120    0%   /System/Volumes/VM
#> /dev/disk1s6                      976490576     39200  84798224     1%      19 423991120    0%   /System/Volumes/Update
#> /dev/disk1s2                      976490576 861746736  84798224    92% 5662798 423991120    1%   /System/Volumes/Data
#> map auto_home                             0         0         0   100%       0         0     -   /System/Volumes/Data/home
By default, it displays sizes in 1K blocks but can show them in a more readable format (like MB or GB) with the -h option (human-readable).
df -h
# Filesystem                          Size    Used   Avail Capacity iused ifree %iused  Mounted on
# /dev/disk1s1s1                     466Gi   9.5Gi    35Gi    22%    404k  367M    0%   /
# devfs                              197Ki   197Ki     0Bi   100%     682     0  100%   /dev
# /dev/disk1s3                       466Gi   2.4Gi    35Gi     7%    5.1k  367M    0%   /System/Volumes/Preboot
# /dev/disk1s5                       466Gi   2.0Gi    35Gi     6%       2  367M    0%   /System/Volumes/VM
# /dev/disk1s6                       466Gi    20Mi    35Gi     1%      19  367M    0%   /System/Volumes/Update
# /dev/disk1s2                       466Gi   415Gi    35Gi    93%    6.2M  367M    2%   /System/Volumes/Data
# map auto_home                        0Bi     0Bi     0Bi   100%       0     0     -   /System/Volumes/Data/home
du
du summarizes disk usage for directories and files, allowing you to pinpoint large files and directories that may be consuming excessive disk space.
du data
# 128   data/raw
# 240   data
Just like df, show the output in a more readable format (like MB or GB) with the -h (human-readable) option:
du -h data
#  64K  data/raw
# 120K  data
ps
ps reports a snapshot of the process status for all running processes, regardless of the owner, including the process ID (PID), terminal type (TTY), cumulative CPU time (TIME), and the command (CMD) that started each process:
ps
#   PID TTY           TIME CMD
# 10409 ttys000    0:00.01 -bash
Command options can also expand the selection to include other users’ processes, full command lines, etc.
ps -o lstart,sess,pmem,pcpu,etime,command
# STARTED                        SESS %MEM  %CPU ELAPSED COMMAND
# Fri Aug 30 13:08:56 2024          0  0.0   0.0   38:09 -bash
The specified columns are:
lstart: The exact date and time the process was started
sess: The session ID of the process
pmem: The percentage of the physical memory used by the process
pcpu: The percentage of the CPU time used by the process
etime: The elapsed time since the process startedcommand: The command and arguments
Recap
In this chapter, we explored five essential system monitoring commands in Linux: top, htop, free, df, and du. These commands provide crucial insights into system performance and resource utilization, enabling efficient monitoring and troubleshooting of Linux systems.
Mastering these commands will help you monitor and maintain optimal system performance, ensure efficient resource utilization, and quickly address potential issues.