Make x, y, color plot title
make_x_y_color_title.RdMake x, y, color plot title
Examples
diamonds <- ggplot2::diamonds
mini_dmnds <- diamonds[sample(nrow(diamonds), 10000), ]
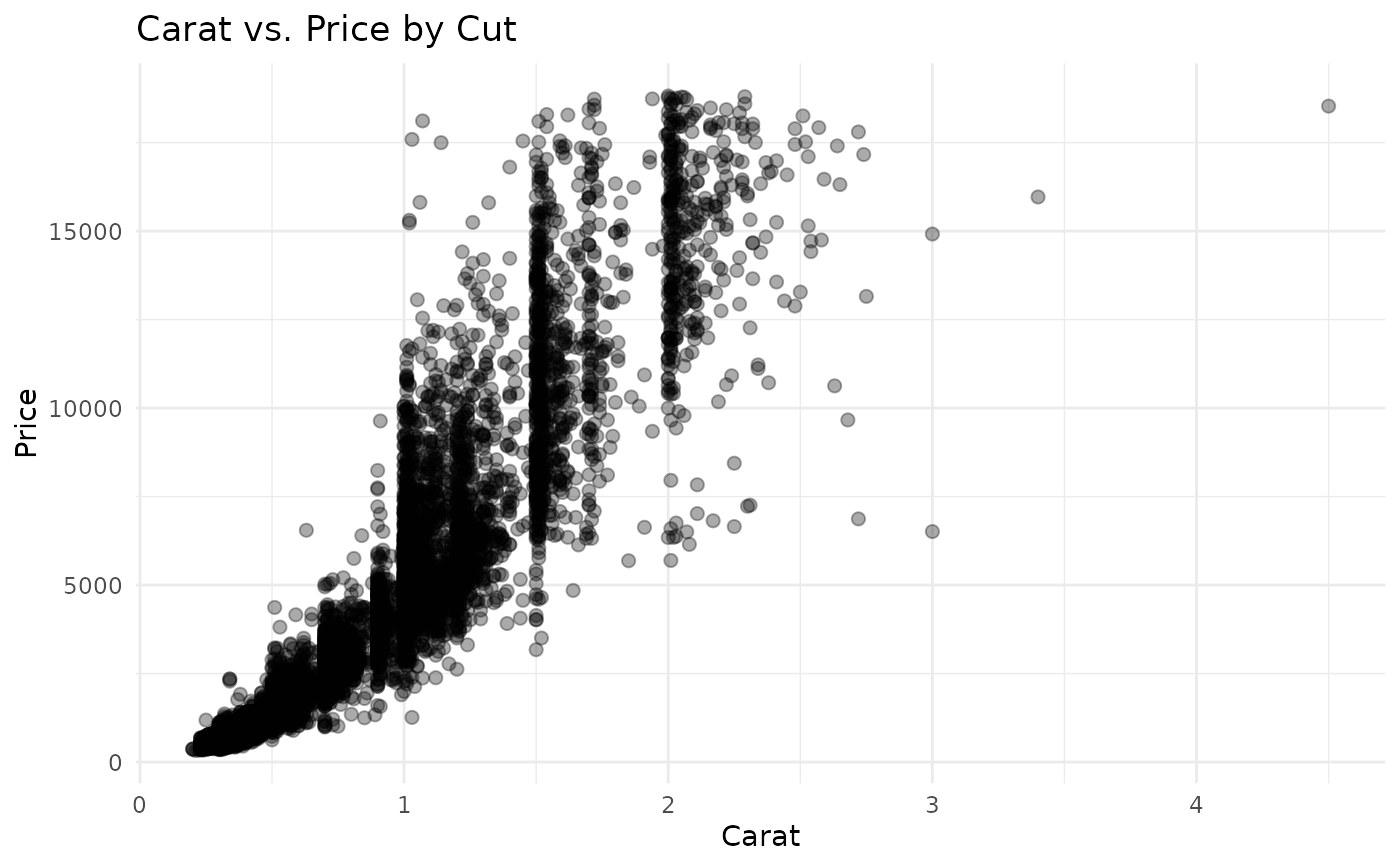
gg_scatter(
df = mini_dmnds,
x_var = "carat",
y_var = "price",
alpha = 1 / 3,
color = "#000000",
size = 2
) + ggplot2::labs(title =
make_x_y_color_title(
x = "carat",
y = "price",
color = "cut"
))