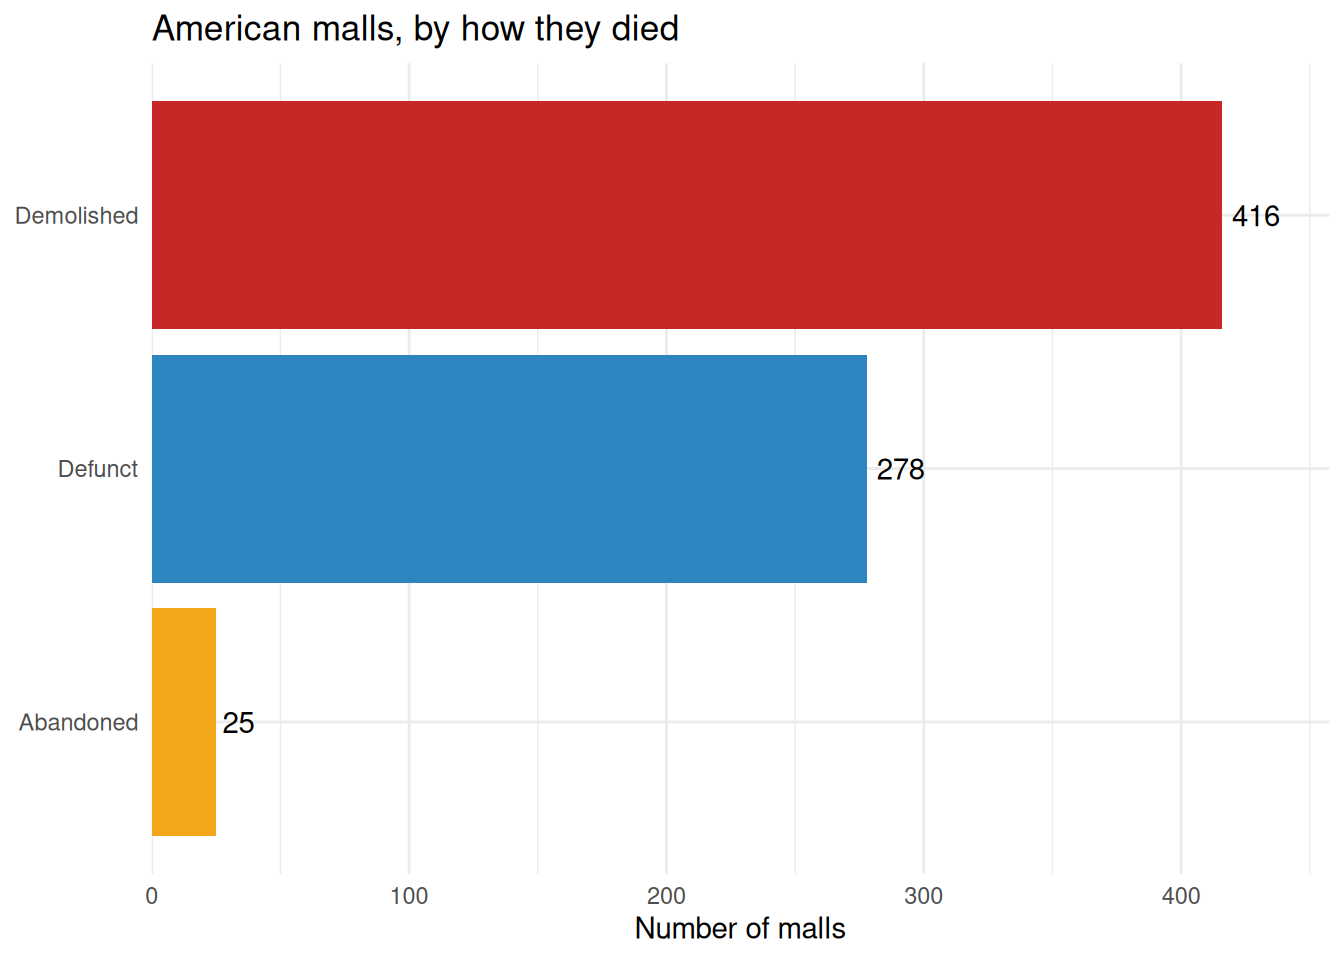
The chart below shows how American malls in the defunct category met their end. The code reads the data cleaned in clean_malls.qmd and plots it.
library(dplyr)
library(readr)
library(ggplot2)
library(forcats)

malls_counts <- read_csv("data/defunct_malls_clean.csv") |>
  count(status, sort = TRUE)

ggplot(malls_counts, aes(x = fct_reorder(status, n), y = n, fill = status)) +
  geom_col() +
  coord_flip() +
  geom_text(aes(label = n), hjust = -0.2) +
  scale_fill_manual(values = c(
    "Demolished" = "#c62828", "Abandoned" = "#f2a71b", "Defunct" = "#2e86c1"
  )) +
  scale_y_continuous(expand = expansion(mult = c(0, 0.1))) +
  labs(
    x = NULL, y = "Number of malls", fill = "Status",
    title = "American malls, by how they died"
  ) +
  theme_minimal() +
  theme(legend.position = "none")