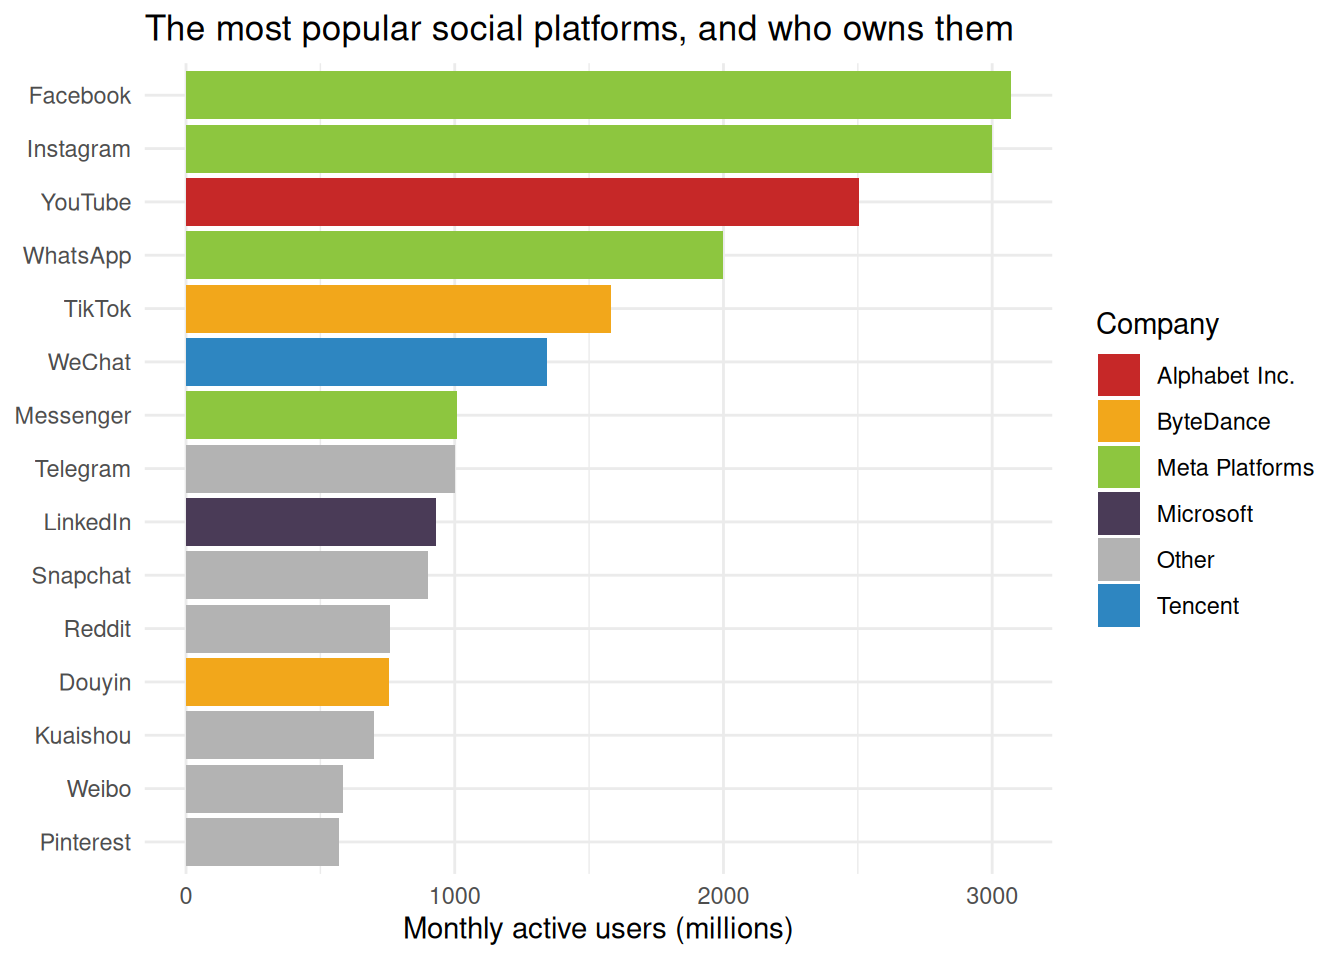
The chart below shows the 15 social platforms with the most monthly active users, colored by owning company. The code reads the data cleaned in clean_social.qmd and plots it.
library(dplyr)library(readr)library(ggplot2)library(forcats)social_top15 <-read_csv("data/social_platforms_clean.csv") |>slice_max(mau_millions, n =15)ggplot(social_top15, aes(x =fct_reorder(name, mau_millions),y = mau_millions,fill = company_group)) +geom_col() +coord_flip() +scale_fill_manual(values =c("Meta Platforms"="#8dc63f", "Alphabet Inc."="#c62828","ByteDance"="#f2a71b", "Tencent"="#2e86c1","Microsoft"="#4a3b57", "Other"="grey70" )) +labs(x =NULL, y ="Monthly active users (millions)", fill ="Company",title ="The most popular social platforms, and who owns them" ) +theme_minimal()
Figure 1: Top 15 social platforms by monthly active users