Hex sticker
hexsticker.RmdPackage hex sticker
This vignette covers how the images in the hex-sticker were created.
Data
risk_pairs <- segtools::get_seg_data("AppRiskPairData")
vand_data <- segtools::get_seg_data("VanderbiltComplete")
Graph constants
mmolConvFactor <- segtools::mmolConvFactor
mmolConvFactor
#> [1] 18.01806
risk_factor_colors <- segtools::risk_factor_colors
risk_factor_colors
#> [1] "#00A500" "#00FF00" "#FFFF00" "#FF0000" "#800000"
base_data <- segtools::base_data
base_data
#>   x_coordinate y_coordinate color_gradient
#> 1            0            0              0
#> 2            0            0              1
#> 3            0            0              2
#> 4            0            0              3
#> 5            0            0              4
SEG graph
ggp_seg_hex <- ggplot() +
  geom_point(
    data = base_data,
    aes(
      x = x_coordinate,
      y = y_coordinate,
      fill = color_gradient
    ),
    show.legend = FALSE
  ) +
  geom_point(
    data = risk_pairs,
    aes(
      x = REF,
      y = BGM,
      color = abs_risk
    ),
    show.legend = FALSE
  ) +
  ggplot2::scale_color_gradientn(
    colors = risk_factor_colors,
    guide = "none",
    limits = c(0, 4),
    values = scales::rescale(c(
      0, # darkgreen
      0.4375, # green
      1.0625, # yellow
      2.7500, # red
      4.0000
    ))
  ) +
  ggplot2::scale_fill_gradientn(
    values = scales::rescale(c(
      0, # darkgreen
      0.4375, # green
      1.0625, # yellow
      2.75, # red
      4.0 # brown
    )),
    limits = c(0, 4),
    colors = risk_factor_colors,
    guide = ggplot2::guide_colorbar(
      ticks = FALSE,
      barheight = unit(100, "mm")
    ),
    breaks = c(0.25, 1, 2, 3, 3.75),
    labels = c(
      "None", "Slight",
      "Moderate", "High", "Extreme"
    ),
    name = "Risk level"
  ) +
  ggplot2::scale_y_continuous(
    limits = c(0, 600),
    sec.axis =
      sec_axis(~ . / mmolConvFactor,
        name = "Measured blood glucose (mmol/L)"
      ),
    name = "Measured blood glucose (mg/dL)"
  ) +
  ggplot2::scale_x_continuous(
    limits = c(0, 600),
    sec.axis =
      sec_axis(~ . / mmolConvFactor,
        name = "Reference blood glucose (mmol/L)"
      ),
    name = "Reference blood glucose (mg/dL)"
  ) +
  ggplot2::geom_point(
    data = vand_data,
    ggplot2::aes(
      x = REF,
      y = BGM
    ),
    shape = 21,
    alpha = 0.75,
    size = 3.3,
    color = "#000000",
    fill = "#FFFFFF",
    stroke = 0.4
  ) +
  ggplot2::theme_void(base_size = 20, base_family = "Ubuntu")
ggp_seg_hex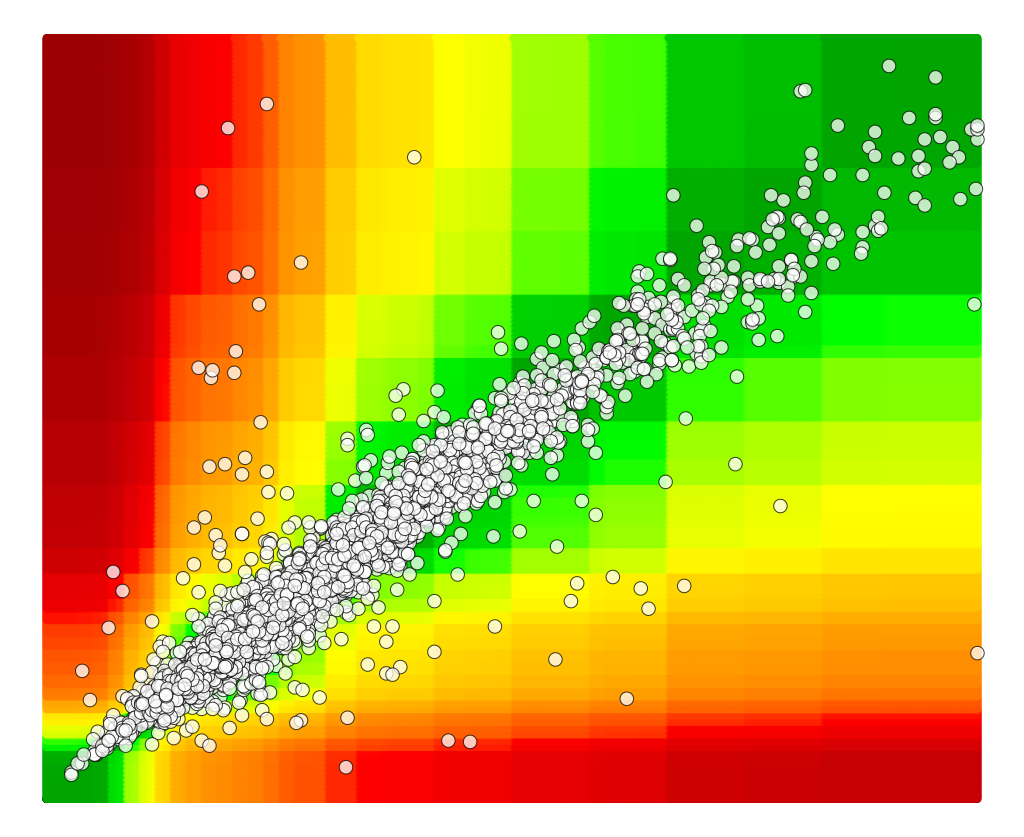
Modified Bland-Altman Plot
ln_risk_pairs <- dplyr::mutate(vand_data,

        lnREF = log(REF),

        lnBGM = log(BGM),

        lnDiff = lnBGM - lnREF,

        rel_perc_diff = exp(lnDiff) - 1)

ggp_modba_hex <- ggplot2::ggplot(data = ln_risk_pairs,
  mapping = ggplot2::aes(x = REF, y = rel_perc_diff)) +

ggplot2::geom_point(
  alpha = 1.0,
  size = 2.5,
  shape = 21,
  fill = "#FFFFFF",
  color = "#005b96") +

  ggplot2::geom_point(
  alpha = 1.0,
  shape = 21,
  size = 1.88,
  color = "#def3f6", #03396c
  fill = "#03396c") +

ggplot2::scale_y_continuous(
  limits = c(-0.50, 0.50)
) +

ggplot2::geom_line(
  ggplot2::aes(x = Ref, y = UB),
  data = segtools::APPSEGBlandAltmanRefVals,
  linetype = "dotted",
  lineend = "round",
  linejoin = "round",
  color = "#ce2b37",
  linewidth = 2.2,
  alpha = 0.85
) +

ggplot2::geom_line(
  ggplot2::aes(x = Ref, y = LB),
  data = segtools::APPSEGBlandAltmanRefVals,
  linetype = "dotted",
  lineend = "round",
  linejoin = "round",
  color = "#ce2b37",
  linewidth = 2.2,
  alpha = 0.85
) +
ggplot2::theme_void(base_size = 20)
ggp_modba_hex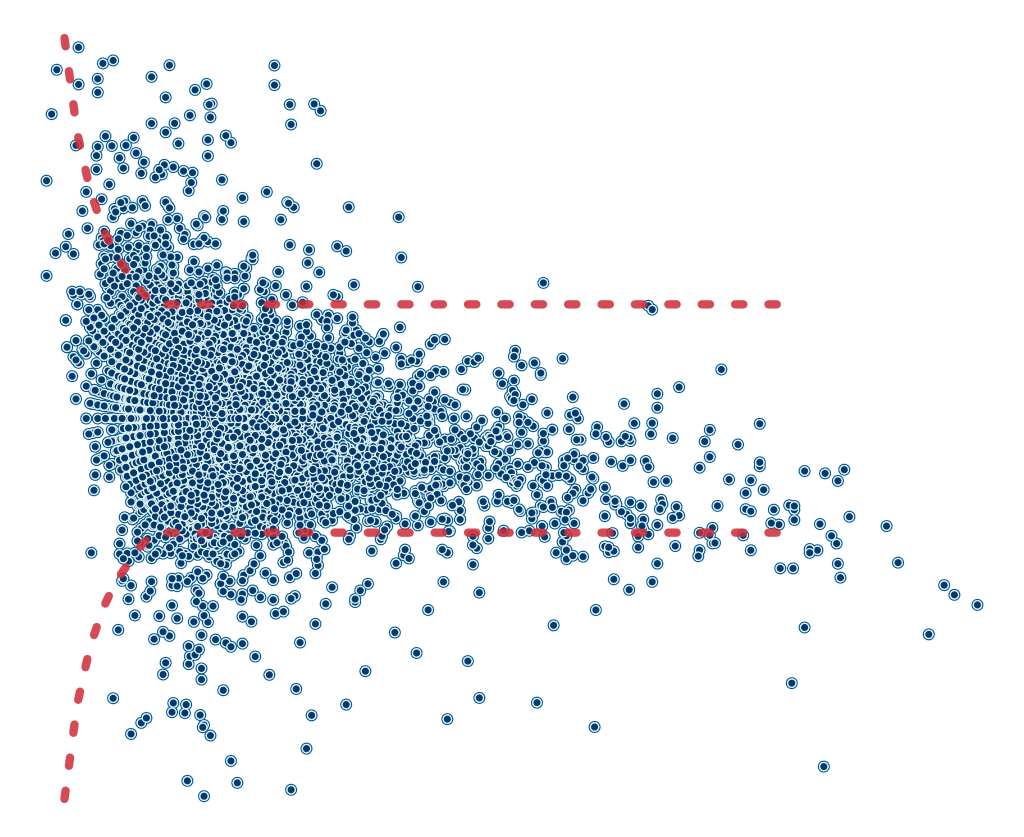
Create hex sticker
The hex-sticker is built with the hexSticker and
magick packages. Below we import
hex-img-raw.png (a combination of the plots above) and
creates the customizations for the hex sticker image:
img_path <- "../man/figures/hex-img-raw.png"
hexSticker::sticker(
  img_path,
  u_family = "Ubuntu",
  # colors
  h_fill = "#FFFFFF", # fill
  p_color = "#02577A", # package name
  h_color = "#043b67", # hexagon border
  u_color = "#fa7b3c", # color for url

  package = "segtools",
  p_size = 18,
  p_x = 1,
  p_y = 1.51,

  s_x = 1,
  s_y = .92,
  s_width = .92,

  url = "mjfrigaard.github.io/segtools",
  u_size = 4.5,

  filename = "../man/figures/package_hex.png",

)
Review
knitr::include_graphics("../man/figures/package_hex.png")