Risk Categories
risk-categories.RmdThe risk tables are created using the functions in the seg-shiny-1-3-3 repo. Through the multiple iterations of this application, different values have been used to establish these categories.
Objective
This vignette covers the risk category table function and performs unit tests on the output to ensure it matches the table in the application.
Load test data
The segtools package uses testthat, a common
testing framework for performing unit tests. I’ll load a test data file
used in the
GitHub repo (VanderbiltComplete.csv) below and run it
in the shiny app to generate the tables for comparison.
github_data_root <-
  "https://raw.githubusercontent.com/mjfrigaard/seg-shiny-data/master/Data/"
full_sample_repo <- base::paste0(github_data_root,
  "VanderbiltComplete.csv")
test_vand_comp_data <-
  vroom::vroom(file = full_sample_repo, delim = ",")
glimpse(test_vand_comp_data)
#> Rows: 9,891
#> Columns: 2
#> $ BGM <dbl> 121, 212, 161, 191, 189, 104, 293, 130, 261, 147, 83, 132, 146, 24…
#> $ REF <dbl> 127, 223, 166, 205, 210, 100, 296, 142, 231, 148, 81, 131, 155, 25…
Application (version 1.3.3) functions
The previous application functions are stored in the helpers.R
file in the GitHub repo.
SEG Risk Variables
Create the risk_vars_tbl from
seg_risk_vars():
risk_vars_tbl <- seg_risk_vars(df = test_vand_comp_data)
dplyr::glimpse(risk_vars_tbl)
#> Rows: 9,868
#> Columns: 19
#> $ BGM            <dbl> 121, 212, 161, 191, 189, 104, 293, 130, 261, 147, 83, 1…
#> $ REF            <dbl> 127, 223, 166, 205, 210, 100, 296, 142, 231, 148, 81, 1…
#> $ bgm_pair_cat   <chr> "BGM < REF", "BGM < REF", "BGM < REF", "BGM < REF", "BG…
#> $ ref_pair_2cat  <chr> NA, NA, NA, NA, NA, NA, NA, NA, NA, NA, NA, NA, NA, NA,…
#> $ included       <chr> "Total included in SEG Analysis", "Total included in SE…
#> $ RiskPairID     <dbl> 72849, 127636, 96928, 114997, 113800, 62605, 176390, 78…
#> $ RiskFactor     <dbl> 0.0025445, 0.0279900, 0.0000000, 0.2061100, 0.2086500, …
#> $ abs_risk       <dbl> 0.0025445, 0.0279900, 0.0000000, 0.2061100, 0.2086500, …
#> $ risk_cat       <dbl> 0, 0, 0, 0, 0, 0, 0, 0, 0, 0, 0, 0, 0, 0, 0, 0, 0, 0, 0…
#> $ ABSLB          <dbl> -0.001, -0.001, -0.001, -0.001, -0.001, -0.001, -0.001,…
#> $ ABSUB          <dbl> 0.5, 0.5, 0.5, 0.5, 0.5, 0.5, 0.5, 0.5, 0.5, 0.5, 0.5, …
#> $ risk_cat_txt   <chr> "None", "None", "None", "None", "None", "None", "None",…
#> $ rel_diff       <dbl> -0.047244094, -0.049327354, -0.030120482, -0.068292683,…
#> $ abs_rel_diff   <dbl> 0.047244094, 0.049327354, 0.030120482, 0.068292683, 0.1…
#> $ sq_rel_diff    <dbl> 2.232004e-03, 2.433188e-03, 9.072434e-04, 4.663891e-03,…
#> $ iso_diff       <dbl> 4.7244094, 4.9327354, 3.0120482, 6.8292683, 10.0000000,…
#> $ iso_range      <chr> "<= 5% or 5 mg/dL", "<= 5% or 5 mg/dL", "<= 5% or 5 mg/…
#> $ risk_grade     <chr> "A", "A", "A", "A", "A", "A", "A", "A", "A", "A", "A", …
#> $ risk_grade_txt <chr> "0 - 0.5", "0 - 0.5", "0 - 0.5", "0 - 0.5", "0 - 0.5", …
Risk Category Table
The SEGRiskCategoryTable4 table is created in the app
server function
seg_risk_cat_tbl()
I’ve re-written it below as seg_risk_cat_tbl():
Below I confirm the output from seg_risk_cat_tbl():
seg_risk_cat_tbl(risk_vars_tbl)| SEG Risk Level | SEG Risk Category | Number of Pairs | Percent |
|---|---|---|---|
| 0 | None | 9474 | 96% |
| 1 | Slight, Lower | 294 | 3% |
| 2 | Slight, Higher | 55 | 0.6% |
| 3 | Moderate, Lower | 24 | 0.2% |
| 4 | Moderate, Higher | 11 | 0.1% |
| 5 | Severe, Lower | 10 | 0.1% |
| 6 | Severe, Upper | NA | NA |
| 7 | Extreme | NA | NA |
Application RiskCategoryTable
Below is the app display of the risk level table.
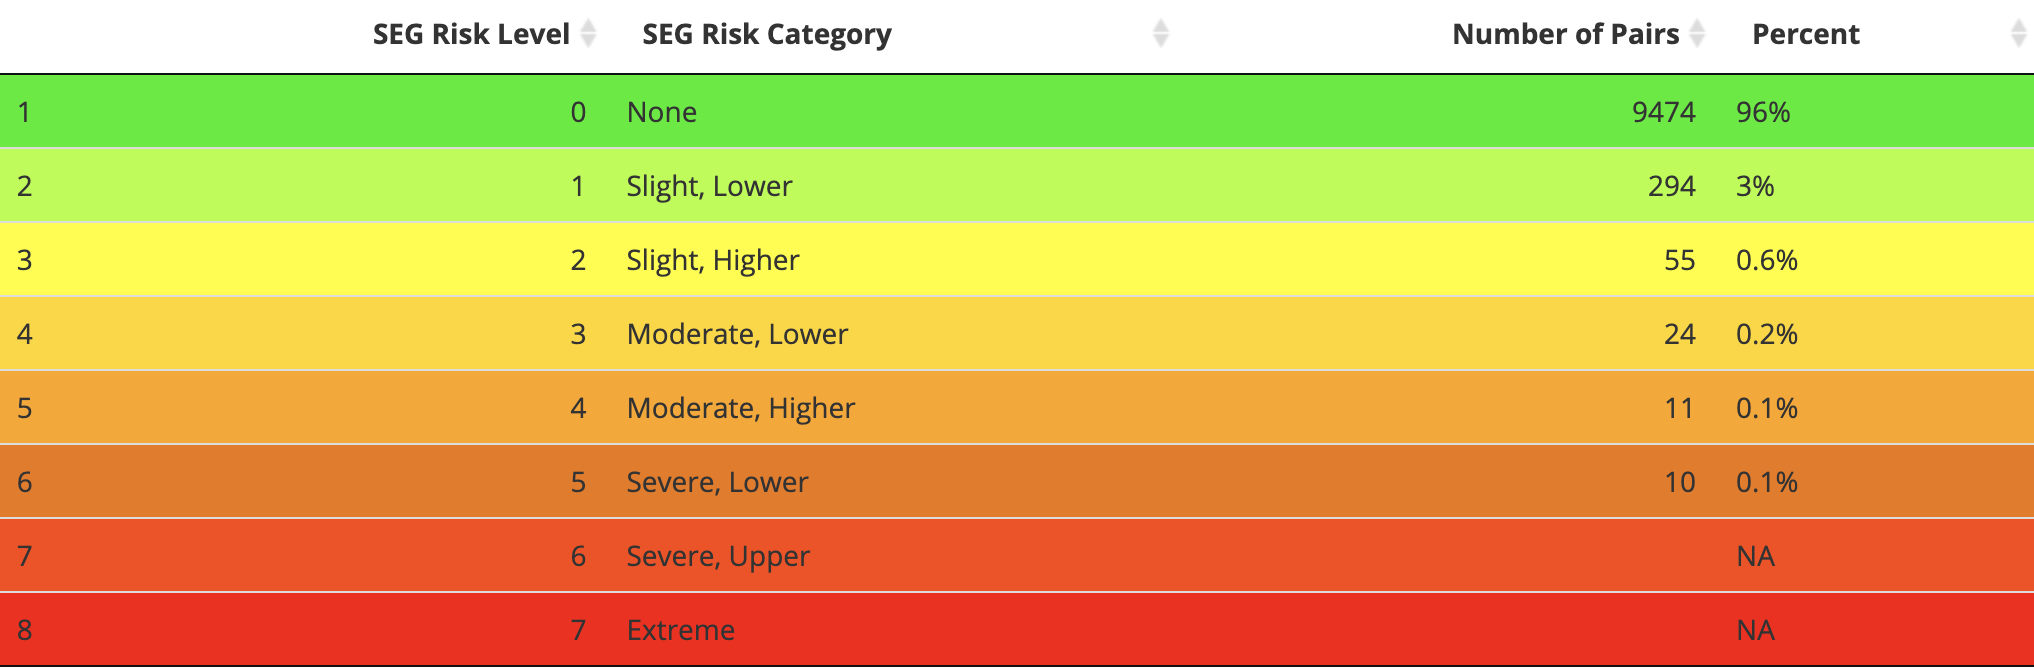
The risk level table is also built with DT, and I’ve built
it below as app_risk_level_tbl (for testing)
app_risk_level_tbl <- as.data.frame(
  tibble::tibble(
    `SEG Risk Level` = c(0L, 1L, 2L, 3L, 4L, 5L, 6L, 7L),
    `SEG Risk Category` = c(
      'None',
      'Slight, Lower', 'Slight, Higher',
      'Moderate, Lower','Moderate, Higher',
      'Severe, Lower', 'Severe, Higher',
      'Extreme'
    ),
    `Number of Pairs` = c(9474L, 294L, 55L, 24L, 11L, 10L, NA_integer_, NA_integer_),
    Percent = c(
      '96%', '3%', '0.6%', '0.2%', '0.1%', '0.1%', NA_character_, NA_character_
    ),
  )
)
app_risk_level_tbl| SEG Risk Level | SEG Risk Category | Number of Pairs | Percent |
|---|---|---|---|
| 0 | None | 9474 | 96% |
| 1 | Slight, Lower | 294 | 3% |
| 2 | Slight, Higher | 55 | 0.6% |
| 3 | Moderate, Lower | 24 | 0.2% |
| 4 | Moderate, Higher | 11 | 0.1% |
| 5 | Severe, Lower | 10 | 0.1% |
| 6 | Severe, Higher | NA | NA |
| 7 | Extreme | NA | NA |
Test
I’ll limit the test to the Number of Pairs column.
testthat::test_that("Test risk category pairs", {
testthat::expect_equal(
  # function table
  object = seg_risk_cat_tbl(risk_vars_tbl)$`Number of Pairs`,
  # application table
  expected = app_risk_level_tbl$`Number of Pairs`
  )
})
#> Test passed 🎉