Risk Grades
mard.RmdThe risk tables are created using three functions in the seg-shiny-1-3-3 repo. Through the multiple iterations of this application, different values have been used to establish these categories.
Objective
This vignette covers the MARD table function, and performs unit tests
on the output from the seg_mard_tbl() function to ensure
they match the table output in the application.
Load test data
The segtools package uses testthat, a common
testing framework for performing unit tests. I’ll load a test data file
used in the
GitHub repo (VanderbiltComplete.csv) below and run it
in the shiny app to generate the tables for comparison.
github_data_root <-
  "https://raw.githubusercontent.com/mjfrigaard/seg-shiny-data/master/Data/"
full_sample_repo <- base::paste0(github_data_root,
  "VanderbiltComplete.csv")
test_vand_comp_data <-
  vroom::vroom(file = full_sample_repo, delim = ",")
glimpse(test_vand_comp_data)
#> Rows: 9,891
#> Columns: 2
#> $ BGM <dbl> 121, 212, 161, 191, 189, 104, 293, 130, 261, 147, 83, 132, 146, 24…
#> $ REF <dbl> 127, 223, 166, 205, 210, 100, 296, 142, 231, 148, 81, 131, 155, 25…
Application (version 1.3.3) functions
The previous application functions are stored in the helpers.R
file in the GitHub repo.
SEG Risk Variables
Create the risk_vars_tbl from
seg_risk_vars():
risk_vars_tbl <- seg_risk_vars(df = test_vand_comp_data)
dplyr::glimpse(risk_vars_tbl)
#> Rows: 9,868
#> Columns: 19
#> $ BGM            <dbl> 121, 212, 161, 191, 189, 104, 293, 130, 261, 147, 83, 1…
#> $ REF            <dbl> 127, 223, 166, 205, 210, 100, 296, 142, 231, 148, 81, 1…
#> $ bgm_pair_cat   <chr> "BGM < REF", "BGM < REF", "BGM < REF", "BGM < REF", "BG…
#> $ ref_pair_2cat  <chr> NA, NA, NA, NA, NA, NA, NA, NA, NA, NA, NA, NA, NA, NA,…
#> $ included       <chr> "Total included in SEG Analysis", "Total included in SE…
#> $ RiskPairID     <dbl> 72849, 127636, 96928, 114997, 113800, 62605, 176390, 78…
#> $ RiskFactor     <dbl> 0.0025445, 0.0279900, 0.0000000, 0.2061100, 0.2086500, …
#> $ abs_risk       <dbl> 0.0025445, 0.0279900, 0.0000000, 0.2061100, 0.2086500, …
#> $ risk_cat       <dbl> 0, 0, 0, 0, 0, 0, 0, 0, 0, 0, 0, 0, 0, 0, 0, 0, 0, 0, 0…
#> $ ABSLB          <dbl> -0.001, -0.001, -0.001, -0.001, -0.001, -0.001, -0.001,…
#> $ ABSUB          <dbl> 0.5, 0.5, 0.5, 0.5, 0.5, 0.5, 0.5, 0.5, 0.5, 0.5, 0.5, …
#> $ risk_cat_txt   <chr> "None", "None", "None", "None", "None", "None", "None",…
#> $ rel_diff       <dbl> -0.047244094, -0.049327354, -0.030120482, -0.068292683,…
#> $ abs_rel_diff   <dbl> 0.047244094, 0.049327354, 0.030120482, 0.068292683, 0.1…
#> $ sq_rel_diff    <dbl> 2.232004e-03, 2.433188e-03, 9.072434e-04, 4.663891e-03,…
#> $ iso_diff       <dbl> 4.7244094, 4.9327354, 3.0120482, 6.8292683, 10.0000000,…
#> $ iso_range      <chr> "<= 5% or 5 mg/dL", "<= 5% or 5 mg/dL", "<= 5% or 5 mg/…
#> $ risk_grade     <chr> "A", "A", "A", "A", "A", "A", "A", "A", "A", "A", "A", …
#> $ risk_grade_txt <chr> "0 - 0.5", "0 - 0.5", "0 - 0.5", "0 - 0.5", "0 - 0.5", …
MARD Table
The MARDTable is created in the server function of the
application, starting here.
I’ve converted it into a function, seg_mard_tbl(), which
takes the output from seg_risk_vars():
seg_mard_tbl()
seg_mard_tbl <- function(risk_vars) {
  mard_cols <- data.frame(
    Total = c(nrow(risk_vars)),
    Bias = c(mean(risk_vars$rel_diff)),
    MARD = c(mean(risk_vars$abs_rel_diff)),
    CV = c(sd(risk_vars$rel_diff)),
    stringsAsFactors = FALSE,
    check.names = FALSE
  )

  lower_tbl <- tibble::add_column(
    .data = mard_cols,
    `Lower 95% Limit of Agreement` = mard_cols$Bias - 1.96 * mard_cols$CV
  )
  upper_tbl <- tibble::add_column(
    .data = lower_tbl,
    `Upper 95% Limit of Agreement` = mard_cols$Bias + 1.96 * mard_cols$CV
  )
  mard_vars <- dplyr::mutate(
    .data = upper_tbl,
    Bias = base::paste0(base::round(
      100 * Bias,
      digits = 1
    ), "%"),
    MARD = base::paste0(base::round(
      100 * MARD,
      digits = 1
    ), "%"),
    CV = base::paste0(base::round(
      100 * CV,
      digits = 1
    ), "%"),
    `Lower 95% Limit of Agreement` = base::paste0(base::round(
      100 * `Lower 95% Limit of Agreement`,
      digits = 1
    ), "%"),
    `Upper 95% Limit of Agreement` = base::paste0(base::round(
      100 * `Upper 95% Limit of Agreement`,
      digits = 1
    ), "%")
  )
  mard_vars_tbl <- tibble::as_tibble(mard_vars)
  return(mard_vars_tbl)
}
Below I check the seg_mard_tbl() function:
seg_mard_tbl(risk_vars = risk_vars_tbl)| Total | Bias | MARD | CV | Lower 95% Limit of Agreement | Upper 95% Limit of Agreement |
|---|---|---|---|---|---|
| 9868 | 0.6% | 7% | 14.8% | -28.3% | 29.6% |
Application MARDTable
The MARD table from the application is below:
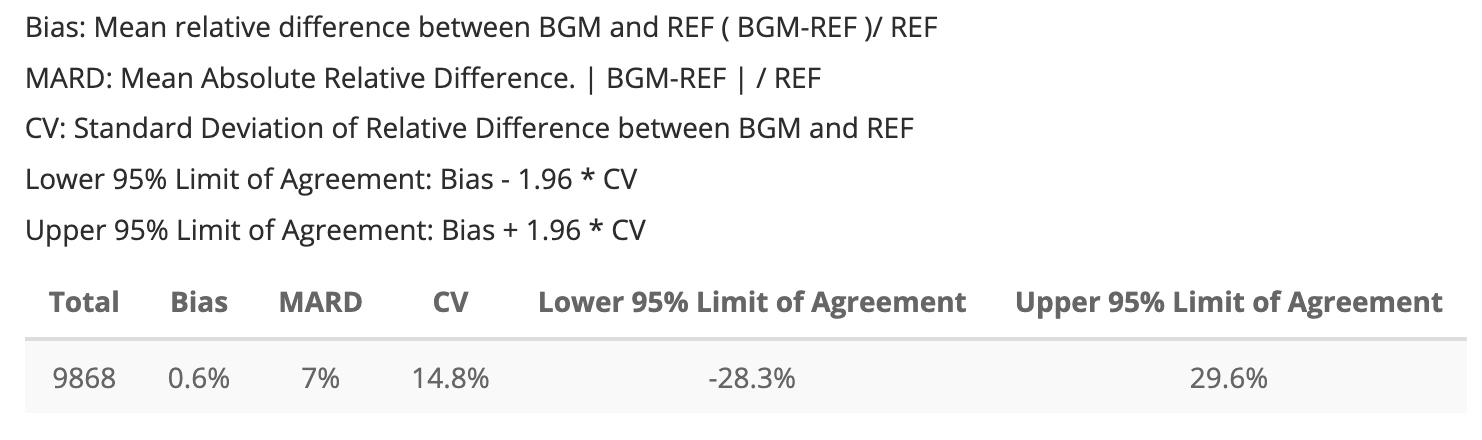
Once again, I will store the app’s MARD table into and object I can
test using datapasta::tribble_paste() (as
app_mard_tbl).
app_mard_tbl <- tibble::tibble(
    Total = 9868L,
    Bias = "0.6%",
    MARD = "7%",
    CV = "14.8%",
    `Lower 95% Limit of Agreement` = "-28.3%",
    `Upper 95% Limit of Agreement` = "29.6%")
app_mard_tbl| Total | Bias | MARD | CV | Lower 95% Limit of Agreement | Upper 95% Limit of Agreement |
|---|---|---|---|---|---|
| 9868 | 0.6% | 7% | 14.8% | -28.3% | 29.6% |
Test
Below I test both MARD tables using
testthat::expect_equal() again:
testthat::test_that("Test MARD table values", {
testthat::expect_equal(
  # function table
  object = seg_mard_tbl(risk_vars = risk_vars_tbl),
  # application table
  expected = app_mard_tbl
  )
})
#> Test passed 🌈