ISO Range Table
iso-ranges.RmdThe risk tables are created using the functions in the seg-shiny-1-3-3 repo. Through the multiple iterations of this application, different values have been used to establish these categories.
Objective
This vignette covers the ISO range table function and performs unit tests on the output table to ensure it matches the table in the output in the application.
Load test data
The segtools package uses testthat, a common
testing framework for performing unit tests. I’ll load a test data file
used in the
GitHub repo (VanderbiltComplete.csv) below and run it
in the shiny app to generate the tables for comparison.
github_data_root <-
  "https://raw.githubusercontent.com/mjfrigaard/seg-shiny-data/master/Data/"
full_sample_repo <- base::paste0(github_data_root,
  "VanderbiltComplete.csv")
test_vand_comp_data <-
  vroom::vroom(file = full_sample_repo, delim = ",")
glimpse(test_vand_comp_data)
#> Rows: 9,891
#> Columns: 2
#> $ BGM <dbl> 121, 212, 161, 191, 189, 104, 293, 130, 261, 147, 83, 132, 146, 24…
#> $ REF <dbl> 127, 223, 166, 205, 210, 100, 296, 142, 231, 148, 81, 131, 155, 25…
Application (version 1.3.3) functions
Below are the three functions from the helpers.R
file in the application repo.
SEG Risk Variables
Create the risk_vars_tbl from
seg_risk_vars():
risk_vars_tbl <- seg_risk_vars(df = test_vand_comp_data)
dplyr::glimpse(risk_vars_tbl)
#> Rows: 9,868
#> Columns: 19
#> $ BGM            <dbl> 121, 212, 161, 191, 189, 104, 293, 130, 261, 147, 83, 1…
#> $ REF            <dbl> 127, 223, 166, 205, 210, 100, 296, 142, 231, 148, 81, 1…
#> $ bgm_pair_cat   <chr> "BGM < REF", "BGM < REF", "BGM < REF", "BGM < REF", "BG…
#> $ ref_pair_2cat  <chr> NA, NA, NA, NA, NA, NA, NA, NA, NA, NA, NA, NA, NA, NA,…
#> $ included       <chr> "Total included in SEG Analysis", "Total included in SE…
#> $ RiskPairID     <dbl> 72849, 127636, 96928, 114997, 113800, 62605, 176390, 78…
#> $ RiskFactor     <dbl> 0.0025445, 0.0279900, 0.0000000, 0.2061100, 0.2086500, …
#> $ abs_risk       <dbl> 0.0025445, 0.0279900, 0.0000000, 0.2061100, 0.2086500, …
#> $ risk_cat       <dbl> 0, 0, 0, 0, 0, 0, 0, 0, 0, 0, 0, 0, 0, 0, 0, 0, 0, 0, 0…
#> $ ABSLB          <dbl> -0.001, -0.001, -0.001, -0.001, -0.001, -0.001, -0.001,…
#> $ ABSUB          <dbl> 0.5, 0.5, 0.5, 0.5, 0.5, 0.5, 0.5, 0.5, 0.5, 0.5, 0.5, …
#> $ risk_cat_txt   <chr> "None", "None", "None", "None", "None", "None", "None",…
#> $ rel_diff       <dbl> -0.047244094, -0.049327354, -0.030120482, -0.068292683,…
#> $ abs_rel_diff   <dbl> 0.047244094, 0.049327354, 0.030120482, 0.068292683, 0.1…
#> $ sq_rel_diff    <dbl> 2.232004e-03, 2.433188e-03, 9.072434e-04, 4.663891e-03,…
#> $ iso_diff       <dbl> 4.7244094, 4.9327354, 3.0120482, 6.8292683, 10.0000000,…
#> $ iso_range      <chr> "<= 5% or 5 mg/dL", "<= 5% or 5 mg/dL", "<= 5% or 5 mg/…
#> $ risk_grade     <chr> "A", "A", "A", "A", "A", "A", "A", "A", "A", "A", "A", …
#> $ risk_grade_txt <chr> "0 - 0.5", "0 - 0.5", "0 - 0.5", "0 - 0.5", "0 - 0.5", …
ISO Range Table
The ISORangeTable5 table is also created in the server
function in the App.R file.
seg_iso_range_tbl()
I’ve re-written this below as seg_iso_range_tbl():
seg_iso_range_tbl(risk_vars_tbl)
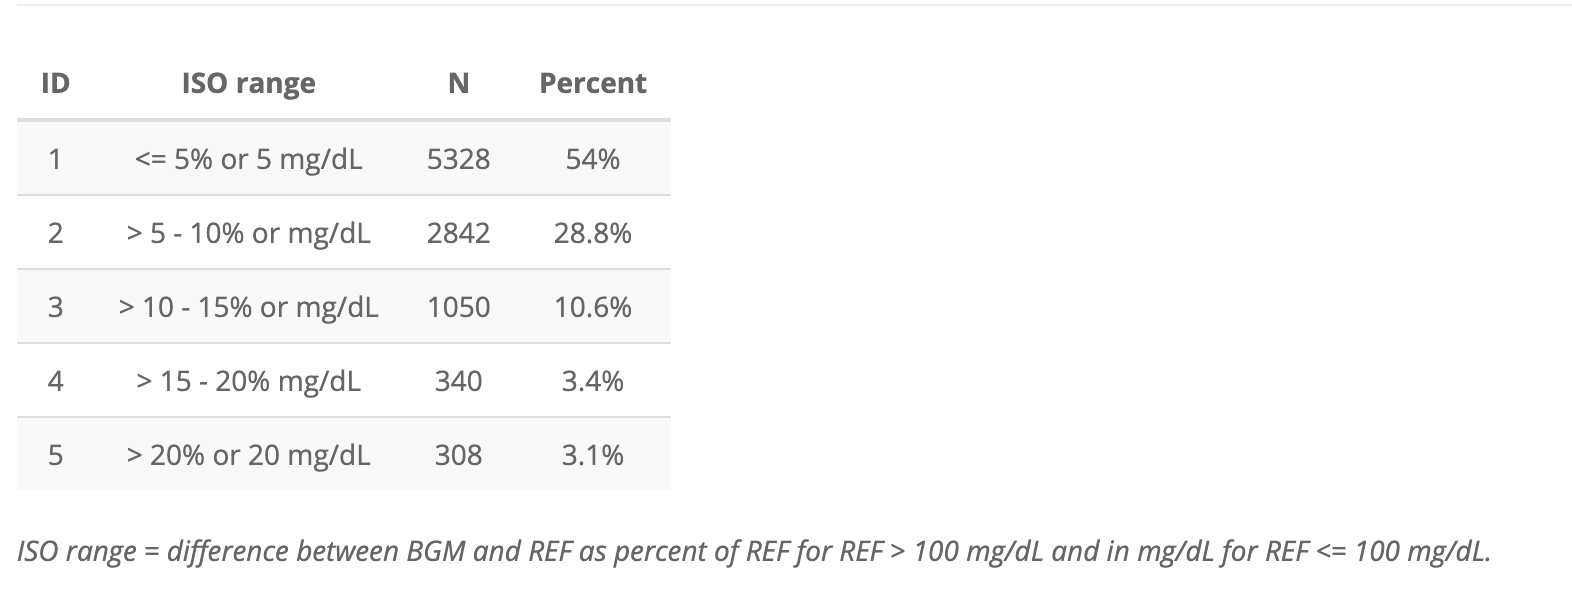
#> # A tibble: 5 × 4
#> ID `ISO range` N Percent
#> <int> <chr> <int> <chr>
#> 1 1 <= 5% or 5 mg/dL 5328 54%
#> 2 2 > 5 - 10% or mg/dL 2842 28.8%
#> 3 3 > 10 - 15% or mg/dL 1050 10.6%
#> 4 4 > 15 - 20% mg/dL 340 3.4%
#> 5 5 > 20% or 20 mg/dL 308 3.1%Application ISORangeTable
Below is the output for the ISORangeTable in the
application
I’ve re-created this as app_iso_range_tbl below:
app_iso_range_tbl <- tibble::tribble(
     ~ID,          ~`ISO range`,    ~N, ~Percent,
      1L,    "<= 5% or 5 mg/dL", 5328L,    "54%",
      2L,  "> 5 - 10% or mg/dL", 2842L,  "28.8%",
      3L, "> 10 - 15% or mg/dL", 1050L,  "10.6%",
      4L,    "> 15 - 20% mg/dL",  340L,   "3.4%",
      5L,   "> 20% or 20 mg/dL",  308L,   "3.1%"
     )
app_iso_range_tbl| ID | ISO range | N | Percent |
|---|---|---|---|
| 1 | <= 5% or 5 mg/dL | 5328 | 54% |
| 2 | > 5 - 10% or mg/dL | 2842 | 28.8% |
| 3 | > 10 - 15% or mg/dL | 1050 | 10.6% |
| 4 | > 15 - 20% mg/dL | 340 | 3.4% |
| 5 | > 20% or 20 mg/dL | 308 | 3.1% |
Test
Below we test the two ISORangeTable tables
testthat::test_that("Test risk grade table", {
testthat::expect_equal(
  # function table
  object = seg_iso_range_tbl(risk_vars_tbl),
  # application table
  expected = app_iso_range_tbl
  )
})
#> Test passed 🌈