Pair Types
pair-types.RmdThe risk tables are created using the functions in the seg-shiny-1-3-3 repo. Through the multiple iterations of this application, different values have been used to establish these categories.
Objective
This vignette covers the the pair type table function and performs
unit tests to ensure the output from the
seg_pair_type_tbl() function match the output table in the
application.
Load test data
The segtools package uses testthat, a common
testing framework for performing unit tests. I’ll load a test data file
used in the
GitHub repo (VanderbiltComplete.csv) below and run it
in the shiny app to generate the tables for comparison.
github_data_root <-
  "https://raw.githubusercontent.com/mjfrigaard/seg-shiny-data/master/Data/"
full_sample_repo <- base::paste0(github_data_root,
  "VanderbiltComplete.csv")
test_vand_comp_data <-
  vroom::vroom(file = full_sample_repo, delim = ",")
glimpse(test_vand_comp_data)
#> Rows: 9,891
#> Columns: 2
#> $ BGM <dbl> 121, 212, 161, 191, 189, 104, 293, 130, 261, 147, 83, 132, 146, 24…
#> $ REF <dbl> 127, 223, 166, 205, 210, 100, 296, 142, 231, 148, 81, 131, 155, 25…
Application (version 1.3.3) functions
The previous application functions are stored in the helpers.R
file in the GitHub repo.
SEG Risk Variables
Create the risk_vars_tbl from
seg_risk_vars():
risk_vars_tbl <- seg_risk_vars(df = test_vand_comp_data)
dplyr::glimpse(risk_vars_tbl)
#> Rows: 9,868
#> Columns: 19
#> $ BGM            <dbl> 121, 212, 161, 191, 189, 104, 293, 130, 261, 147, 83, 1…
#> $ REF            <dbl> 127, 223, 166, 205, 210, 100, 296, 142, 231, 148, 81, 1…
#> $ bgm_pair_cat   <chr> "BGM < REF", "BGM < REF", "BGM < REF", "BGM < REF", "BG…
#> $ ref_pair_2cat  <chr> NA, NA, NA, NA, NA, NA, NA, NA, NA, NA, NA, NA, NA, NA,…
#> $ included       <chr> "Total included in SEG Analysis", "Total included in SE…
#> $ RiskPairID     <dbl> 72849, 127636, 96928, 114997, 113800, 62605, 176390, 78…
#> $ RiskFactor     <dbl> 0.0025445, 0.0279900, 0.0000000, 0.2061100, 0.2086500, …
#> $ abs_risk       <dbl> 0.0025445, 0.0279900, 0.0000000, 0.2061100, 0.2086500, …
#> $ risk_cat       <dbl> 0, 0, 0, 0, 0, 0, 0, 0, 0, 0, 0, 0, 0, 0, 0, 0, 0, 0, 0…
#> $ ABSLB          <dbl> -0.001, -0.001, -0.001, -0.001, -0.001, -0.001, -0.001,…
#> $ ABSUB          <dbl> 0.5, 0.5, 0.5, 0.5, 0.5, 0.5, 0.5, 0.5, 0.5, 0.5, 0.5, …
#> $ risk_cat_txt   <chr> "None", "None", "None", "None", "None", "None", "None",…
#> $ rel_diff       <dbl> -0.047244094, -0.049327354, -0.030120482, -0.068292683,…
#> $ abs_rel_diff   <dbl> 0.047244094, 0.049327354, 0.030120482, 0.068292683, 0.1…
#> $ sq_rel_diff    <dbl> 2.232004e-03, 2.433188e-03, 9.072434e-04, 4.663891e-03,…
#> $ iso_diff       <dbl> 4.7244094, 4.9327354, 3.0120482, 6.8292683, 10.0000000,…
#> $ iso_range      <chr> "<= 5% or 5 mg/dL", "<= 5% or 5 mg/dL", "<= 5% or 5 mg/…
#> $ risk_grade     <chr> "A", "A", "A", "A", "A", "A", "A", "A", "A", "A", "A", …
#> $ risk_grade_txt <chr> "0 - 0.5", "0 - 0.5", "0 - 0.5", "0 - 0.5", "0 - 0.5", …
Pair Type Table
The original pairtypeTable() function is stored in the
application helpers.R
file.
seg_pair_type_tbl()
I’ve re-written pairtypeTable() as
seg_pair_type_tbl()
When I check seg_pair_type_tbl() on the
test_vand_comp_data (VanderbiltComplete.csv)
data, I see the following:
seg_pair_type_tbl(df = test_vand_comp_data)| Pair Type | Count |
|---|---|
| Total | 9891 |
| BGM < REF | 4710 |
| BGM = REF | 479 |
| BGM > REF | 4702 |
| REF > 600: Excluded from SEG Analysis | 23 |
| Total included in SEG Analysis | 9868 |
Application PairTypeTable
After uploading VanderbiltComplete.csv, the first table
in the Summary Tables tab is the pairs table:
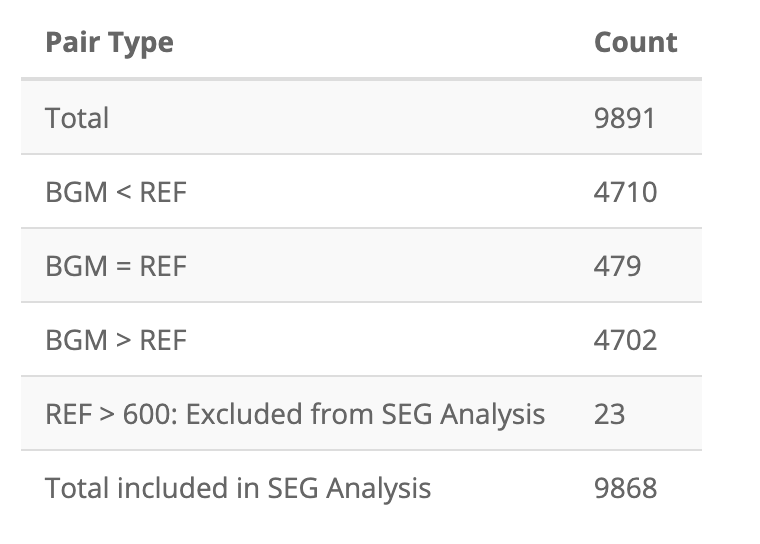
I’ve also stored these as app_pairs_tbl:
app_pairs_tbl = tibble::as_tibble(data.frame(
  stringsAsFactors = FALSE,
  check.names = FALSE,
  `Pair Type` = c(
    "Total",
    "BGM < REF",
    "BGM = REF",
    "BGM > REF",
    "REF > 600: Excluded from SEG Analysis",
    "Total included in SEG Analysis"
  ),
  Count = c(9891L, 4710L, 479L, 4702L, 23L, 9868L)
))
app_pairs_tbl| Pair Type | Count |
|---|---|
| Total | 9891 |
| BGM < REF | 4710 |
| BGM = REF | 479 |
| BGM > REF | 4702 |
| REF > 600: Excluded from SEG Analysis | 23 |
| Total included in SEG Analysis | 9868 |
Test
To test if the two tables are identical, I use
testthat’s testthat::expect_equal() function,
with object set to
seg_pair_type_tbl(dat = test_vand_comp_data) and
expected set to app_pairs_tbl.
testthat::test_that("Test seg_pair_type_tbl()", {
  testthat::expect_equal(
    # function table
    object = seg_pair_type_tbl(df = test_vand_comp_data),
    # application table
    expected = app_pairs_tbl
  )
})
#> Test passed 🥇