SEG Risk Variables
risk-vars.RmdThe risk tables are created using functions in the seg-shiny-1-3-3 repo. Through the multiple iterations of this application, different values have been used to establish these categories.
Objective
This vignette covers the development of the risk variables and performs unit tests on the associated functions to ensure the output matches the tables in the application.
Load test data
The segtools package uses testthat, a common
testing framework for performing unit tests. I’ll load a test data file
used in the
GitHub repo (VanderbiltComplete.csv) below and run it
in the shiny app to generate the tables for comparison.
github_data_root <-
  "https://raw.githubusercontent.com/mjfrigaard/seg-shiny-data/master/Data/"
full_sample_repo <- base::paste0(github_data_root,
  "VanderbiltComplete.csv")
test_vand_comp_data <-
  vroom::vroom(file = full_sample_repo, delim = ",")
glimpse(test_vand_comp_data)
#> Rows: 9,891
#> Columns: 2
#> $ BGM <dbl> 121, 212, 161, 191, 189, 104, 293, 130, 261, 147, 83, 132, 146, 24…
#> $ REF <dbl> 127, 223, 166, 205, 210, 100, 296, 142, 231, 148, 81, 131, 155, 25…
Application (version 1.3.3) functions
The previous application functions are stored in the helpers.R
file in the GitHub repo.
SEG risk variables
The SEG variables were initially created with the segTable()
function
Error
When I try this with the full_sample_repo, I get the
following error:
segTable(dat = full_sample_repo)
#> Error in loadNamespace(x): there is no package called 'readr'
I’ve split the previous segTable() function splits into
into two parts: risk category columns (seg_risk_cat_cols())
and ISO columns (seg_iso_cols()).
SEG Risk Category Columns
I’ll split segTable() into two parts to identify the
bug:
-
seg_risk_cat_cols()imports theAppLookUpRiskCat.csvandAppRiskPairData.csvinside the function.
I check seg_risk_cat_cols() with the
test_vand_comp_data:
risk_cat_vars <- seg_risk_cat_cols(df = test_vand_comp_data)
glimpse(risk_cat_vars)
#> Rows: 9,868
#> Columns: 12
#> $ BGM           <dbl> 121, 212, 161, 191, 189, 104, 293, 130, 261, 147, 83, 13…
#> $ REF           <dbl> 127, 223, 166, 205, 210, 100, 296, 142, 231, 148, 81, 13…
#> $ bgm_pair_cat  <chr> "BGM < REF", "BGM < REF", "BGM < REF", "BGM < REF", "BGM…
#> $ ref_pair_2cat <chr> NA, NA, NA, NA, NA, NA, NA, NA, NA, NA, NA, NA, NA, NA, …
#> $ included      <chr> "Total included in SEG Analysis", "Total included in SEG…
#> $ RiskPairID    <dbl> 72849, 127636, 96928, 114997, 113800, 62605, 176390, 782…
#> $ RiskFactor    <dbl> 0.0025445, 0.0279900, 0.0000000, 0.2061100, 0.2086500, -…
#> $ abs_risk      <dbl> 0.0025445, 0.0279900, 0.0000000, 0.2061100, 0.2086500, 0…
#> $ risk_cat      <dbl> 0, 0, 0, 0, 0, 0, 0, 0, 0, 0, 0, 0, 0, 0, 0, 0, 0, 0, 0,…
#> $ ABSLB         <dbl> -0.001, -0.001, -0.001, -0.001, -0.001, -0.001, -0.001, …
#> $ ABSUB         <dbl> 0.5, 0.5, 0.5, 0.5, 0.5, 0.5, 0.5, 0.5, 0.5, 0.5, 0.5, 0…
#> $ risk_cat_txt  <chr> "None", "None", "None", "None", "None", "None", "None", …
SEG ISO Range Columns
seg_iso_cols() creates the ISO columns:
seg_iso_cols() accepts the output from
seg_risk_cat_cols() and returns a dataset with all the
risk/ISO variables.
iso_vars_tbl <- seg_iso_cols(risk_cat_cols = risk_cat_vars)
glimpse(iso_vars_tbl)
#> Rows: 9,868
#> Columns: 19
#> $ BGM            <dbl> 121, 212, 161, 191, 189, 104, 293, 130, 261, 147, 83, 1…
#> $ REF            <dbl> 127, 223, 166, 205, 210, 100, 296, 142, 231, 148, 81, 1…
#> $ bgm_pair_cat   <chr> "BGM < REF", "BGM < REF", "BGM < REF", "BGM < REF", "BG…
#> $ ref_pair_2cat  <chr> NA, NA, NA, NA, NA, NA, NA, NA, NA, NA, NA, NA, NA, NA,…
#> $ included       <chr> "Total included in SEG Analysis", "Total included in SE…
#> $ RiskPairID     <dbl> 72849, 127636, 96928, 114997, 113800, 62605, 176390, 78…
#> $ RiskFactor     <dbl> 0.0025445, 0.0279900, 0.0000000, 0.2061100, 0.2086500, …
#> $ abs_risk       <dbl> 0.0025445, 0.0279900, 0.0000000, 0.2061100, 0.2086500, …
#> $ risk_cat       <dbl> 0, 0, 0, 0, 0, 0, 0, 0, 0, 0, 0, 0, 0, 0, 0, 0, 0, 0, 0…
#> $ ABSLB          <dbl> -0.001, -0.001, -0.001, -0.001, -0.001, -0.001, -0.001,…
#> $ ABSUB          <dbl> 0.5, 0.5, 0.5, 0.5, 0.5, 0.5, 0.5, 0.5, 0.5, 0.5, 0.5, …
#> $ risk_cat_txt   <chr> "None", "None", "None", "None", "None", "None", "None",…
#> $ rel_diff       <dbl> -0.047244094, -0.049327354, -0.030120482, -0.068292683,…
#> $ abs_rel_diff   <dbl> 0.047244094, 0.049327354, 0.030120482, 0.068292683, 0.1…
#> $ sq_rel_diff    <dbl> 2.232004e-03, 2.433188e-03, 9.072434e-04, 4.663891e-03,…
#> $ iso_diff       <dbl> 4.7244094, 4.9327354, 3.0120482, 6.8292683, 10.0000000,…
#> $ iso_range      <chr> "<= 5% or 5 mg/dL", "<= 5% or 5 mg/dL", "<= 5% or 5 mg/…
#> $ risk_grade     <chr> "A", "A", "A", "A", "A", "A", "A", "A", "A", "A", "A", …
#> $ risk_grade_txt <chr> "0 - 0.5", "0 - 0.5", "0 - 0.5", "0 - 0.5", "0 - 0.5", …
seg_risk_vars()
seg_risk_vars() combines the SEG risk category and ISO
range columns into a wrapper function:
Below I check the differences between seg_risk_vars()
and the iso_vars_tbl output:
Test
testthat::test_that("Test seg_risk_vars()", {
  testthat::expect_equal(
    # function table
    object = seg_risk_vars(df = test_vand_comp_data),
    # ISO vars table
    expected = iso_vars_tbl
  )
})
#> Test passed 😀
Update: discrepancies with Risk Grade table
Due to discrepancies in the application risk grade table output, the
risk_grade and risk_grade_txt variables have
been adjusted in the seg_iso_cols() function (see table
below):
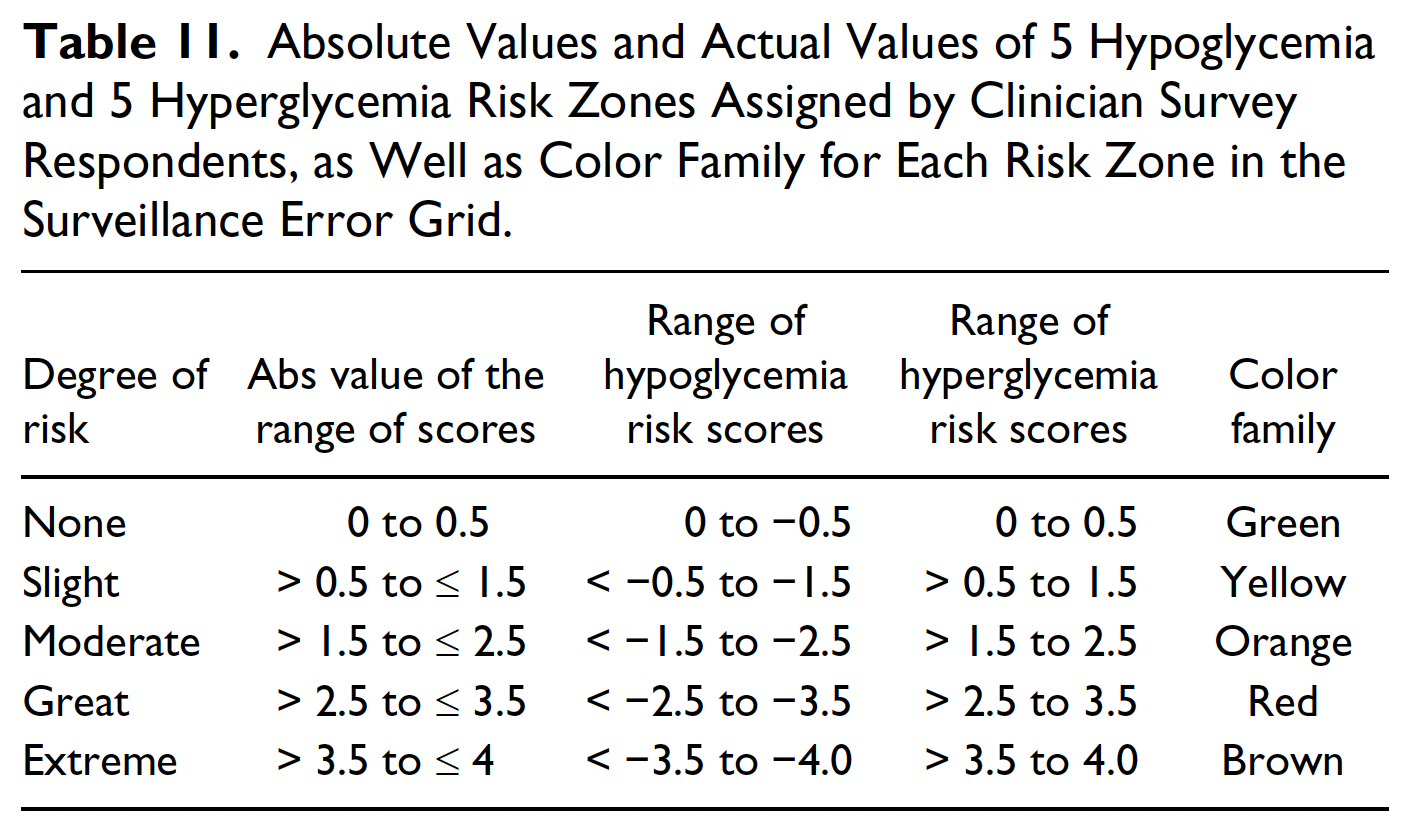
J Diabetes Sci Technol. 2014 Jul;8(4):658-72. doi: 10.1177/1932296814539589.
The Risk Factor Range code has been updated to reflect the risk zones in the Surveillance Error Grid paper.
      risk_grade = dplyr::case_when(
        abs_risk >= 0.0 & abs_risk < 0.5 ~ "A",
        abs_risk >= 0.5 & abs_risk < 1.5 ~ "B",
        abs_risk >= 1.5 & abs_risk < 2.5 ~ "C",
        abs_risk >= 2.5 & abs_risk < 3.5 ~ "D",
        abs_risk >= 3.5 ~ "E"
      ),
      risk_grade_txt = dplyr::case_when(
        abs_risk >= 0.0 & abs_risk < 0.5 ~ "0 - 0.5",
        abs_risk >= 0.5 & abs_risk < 1.0 ~ "> 0.5 - 1.0",
        abs_risk >= 1.0 & abs_risk < 2.0 ~ "> 1.0 - 2.0",
        abs_risk >= 2.0 & abs_risk < 3.0 ~ "> 2.0 - 3.0",
        abs_risk >= 3.0 ~ "> 3.0"
      )
Updated seg_iso_cols()
I remedy this issue in an updated seg_risk_vars()
function below:
To verify, I’ll use seg_risk_cat_cols() and
seg_iso_cols() to create a new
iso_vars_tbl:
# create risk categories
risk_cat_vars <- seg_risk_cat_cols(df = test_vand_comp_data)
# create ISO columns
iso_vars_tbl <- seg_iso_cols(risk_cat_vars = risk_cat_vars)
glimpse(iso_vars_tbl)
#> Rows: 9,868
#> Columns: 19
#> $ BGM            <dbl> 121, 212, 161, 191, 189, 104, 293, 130, 261, 147, 83, 1…
#> $ REF            <dbl> 127, 223, 166, 205, 210, 100, 296, 142, 231, 148, 81, 1…
#> $ bgm_pair_cat   <chr> "BGM < REF", "BGM < REF", "BGM < REF", "BGM < REF", "BG…
#> $ ref_pair_2cat  <chr> NA, NA, NA, NA, NA, NA, NA, NA, NA, NA, NA, NA, NA, NA,…
#> $ included       <chr> "Total included in SEG Analysis", "Total included in SE…
#> $ RiskPairID     <dbl> 72849, 127636, 96928, 114997, 113800, 62605, 176390, 78…
#> $ RiskFactor     <dbl> 0.0025445, 0.0279900, 0.0000000, 0.2061100, 0.2086500, …
#> $ abs_risk       <dbl> 0.0025445, 0.0279900, 0.0000000, 0.2061100, 0.2086500, …
#> $ risk_cat       <dbl> 0, 0, 0, 0, 0, 0, 0, 0, 0, 0, 0, 0, 0, 0, 0, 0, 0, 0, 0…
#> $ ABSLB          <dbl> -0.001, -0.001, -0.001, -0.001, -0.001, -0.001, -0.001,…
#> $ ABSUB          <dbl> 0.5, 0.5, 0.5, 0.5, 0.5, 0.5, 0.5, 0.5, 0.5, 0.5, 0.5, …
#> $ risk_cat_txt   <chr> "None", "None", "None", "None", "None", "None", "None",…
#> $ rel_diff       <dbl> -0.047244094, -0.049327354, -0.030120482, -0.068292683,…
#> $ abs_rel_diff   <dbl> 0.047244094, 0.049327354, 0.030120482, 0.068292683, 0.1…
#> $ sq_rel_diff    <dbl> 2.232004e-03, 2.433188e-03, 9.072434e-04, 4.663891e-03,…
#> $ iso_diff       <dbl> 4.7244094, 4.9327354, 3.0120482, 6.8292683, 10.0000000,…
#> $ iso_range      <chr> "<= 5% or 5 mg/dL", "<= 5% or 5 mg/dL", "<= 5% or 5 mg/…
#> $ risk_grade     <chr> "A", "A", "A", "A", "A", "A", "A", "A", "A", "A", "A", …
#> $ risk_grade_txt <chr> "0 - 0.5", "0 - 0.5", "0 - 0.5", "0 - 0.5", "0 - 0.5", …
Updated seg_risk_vars()
Now I can compare this output to the output from the updated
seg_risk_vars() function:
Re-Test
testthat::test_that("Test seg_risk_vars()", {
  testthat::expect_equal(
    # updated function table
    object = seg_risk_vars(df = test_vand_comp_data),
    # ISO vars table
    expected = iso_vars_tbl
  )
})
#> Test passed 🎊