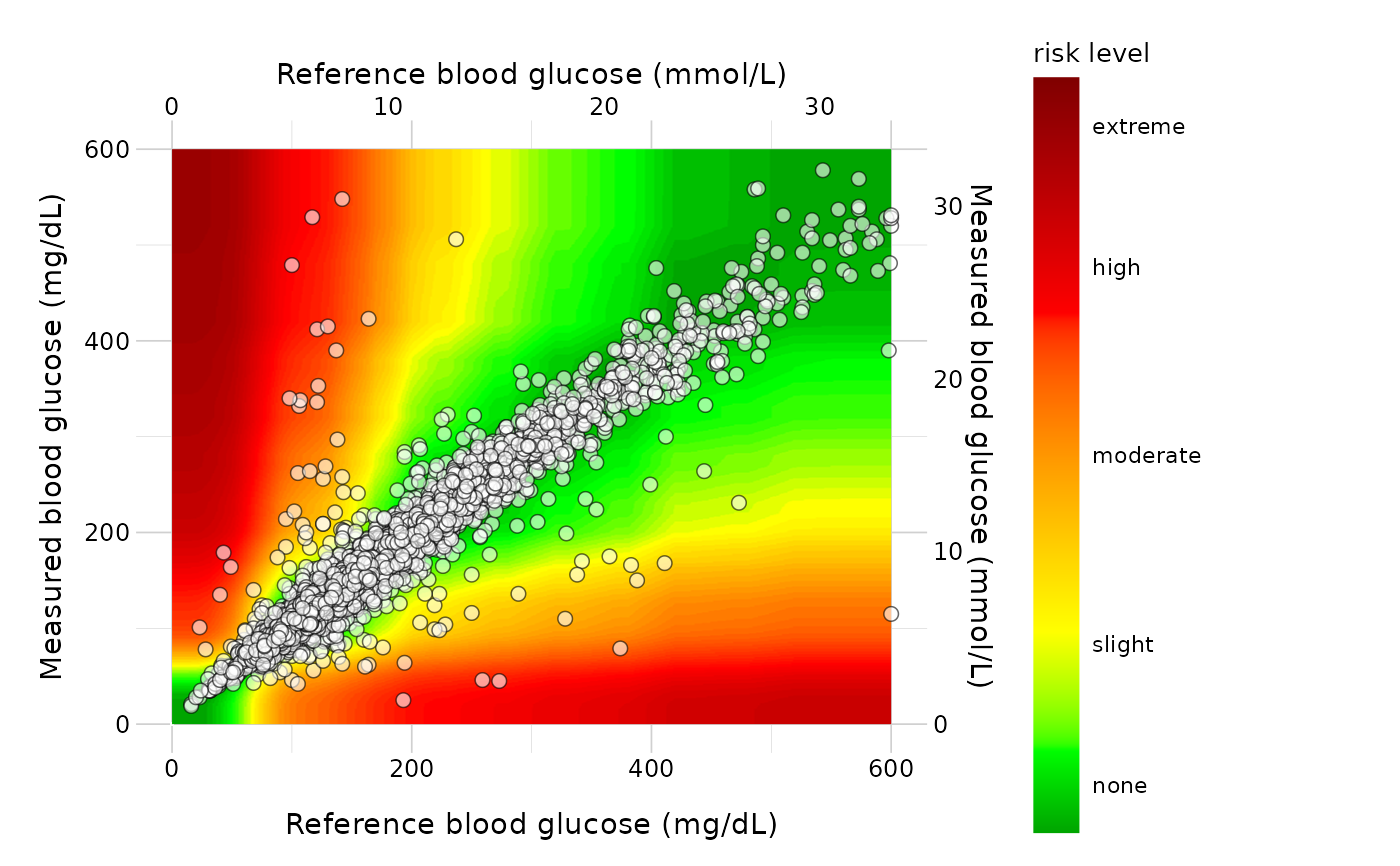
ggplot2 function for SEG grid
seg_graph.Rdggplot2 function for SEG grid
Usage
seg_graph(
  data,
  text_size = 14,
  alpha_var = 0.6,
  size_var = 2.3,
  color_var = "#000000",
  fill_var = "#FFFFFF"
)
Arguments
- data
Dataset containing only
BGMandREFcolumns- alpha_var
alpha setting
- size_var
size setting
- color_var
color setting
- fill_var
fill setting
Examples
require(vroom)
#> Loading required package: vroom
vanderbilt_complete <- vroom::vroom(
 file =
   system.file("extdata", "VanderbiltComplete.csv",
               package = "segtools"), delim = ",")
#> Rows: 9891 Columns: 2
#> ── Column specification ────────────────────────────────────────────────────────
#> Delimiter: ","
#> dbl (2): BGM, REF
#>
#> ℹ Use `spec()` to retrieve the full column specification for this data.
#> ℹ Specify the column types or set `show_col_types = FALSE` to quiet this message.
seg_graph(vanderbilt_complete)