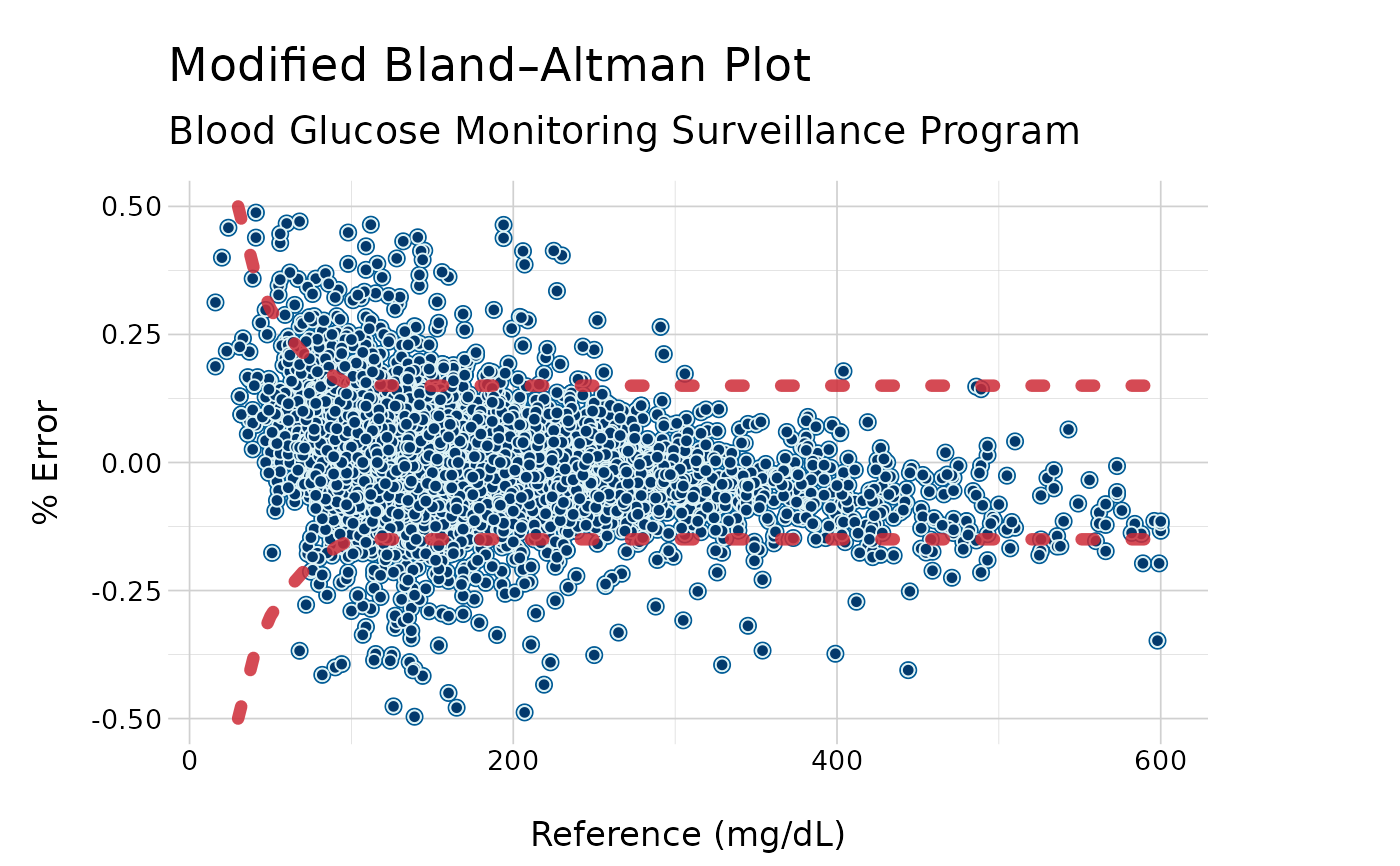
The SEG modified Bland-Altman plot
seg_modba_graph.RdThe SEG modified Bland-Altman plot
Arguments
- data
Dataset containing only
BGMandREFcolumns- text_size
base size passed to
theme_seg()
Examples
require(vroom)
vanderbilt_complete <- vroom::vroom(
 file =
   system.file("extdata", "VanderbiltComplete.csv",
               package = "segtools"), delim = ",")
#> Rows: 9891 Columns: 2
#> ── Column specification ────────────────────────────────────────────────────────
#> Delimiter: ","
#> dbl (2): BGM, REF
#>
#> ℹ Use `spec()` to retrieve the full column specification for this data.
#> ℹ Specify the column types or set `show_col_types = FALSE` to quiet this message.
seg_modba_graph(data = vanderbilt_complete)
#> Warning: Removed 79 rows containing missing values (`geom_point()`).
#> Warning: Removed 79 rows containing missing values (`geom_point()`).
#> Warning: Removed 1 row containing missing values (`geom_line()`).
#> Warning: Removed 1 row containing missing values (`geom_line()`).