Budgeting
1 Book Topics
- Mindset shift: budgets are about conscious allocation, not restriction; “room for error” is the most underrated concept (Housel)
- Expense categories: fixed (predictable), variable (fluctuate), periodic (annual/irregular); each requires a different strategy
- Sinking funds: set aside 1/12 of annual periodic costs each month to avoid “budget emergencies”
- Zero-based budgeting: every dollar gets a job; income − all allocations = 0; best for rebuilding from debt
- Percentage-based budgeting: Sethi’s Conscious Spending Plan (50–60% fixed, 10%+ investing, 20–35% guilt-free); low maintenance at steady income
- Best tool: the one you’ll actually use; automatic imports, easy categorization, and a summary view matter most
2 Percentages
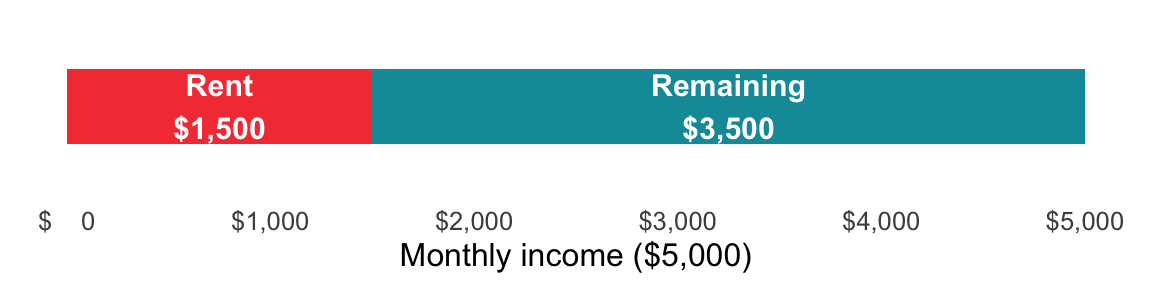
The foundational budgeting calculation: what share of income does each expense represent?
Formula: (Expense ÷ Income) × 100
We can create a simple function to calculate the percentage of income that an expense represents. The fmt_pct() function formats the result as a percentage.
show/hide
percent_of_income <- function(expense, income) {
    fmt_pct(expense / income)
}
show/hide
percent_of_income(expense = 1500, income = 5000)
#> [1] "30%"
In Python, we store intermediate values explicitly before formatting; this makes the calculation steps transparent and easier to debug.
show/hide
def percent_of_income(expense, income):
    ratio = expense / income
    return fmt_pct(ratio)

percent_of_income(expense=1500, income=5000)
#> '30.0%'
Assuming Expense is in cell B2 and Income is in cell C2:
=(B2 / C2) * 100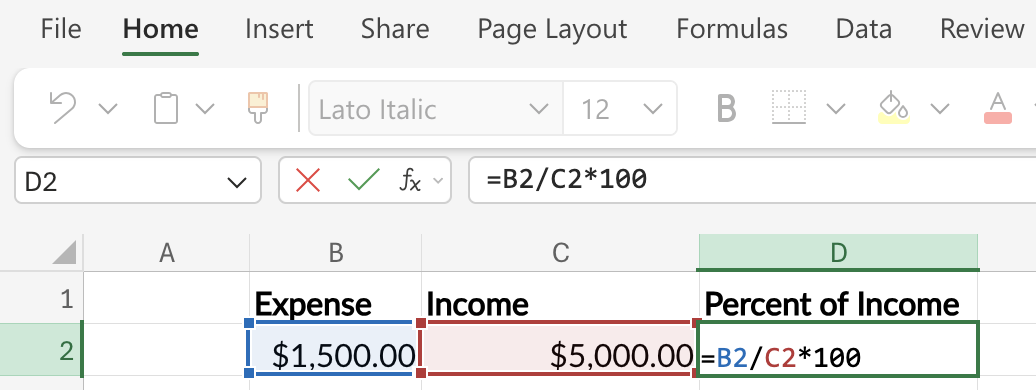
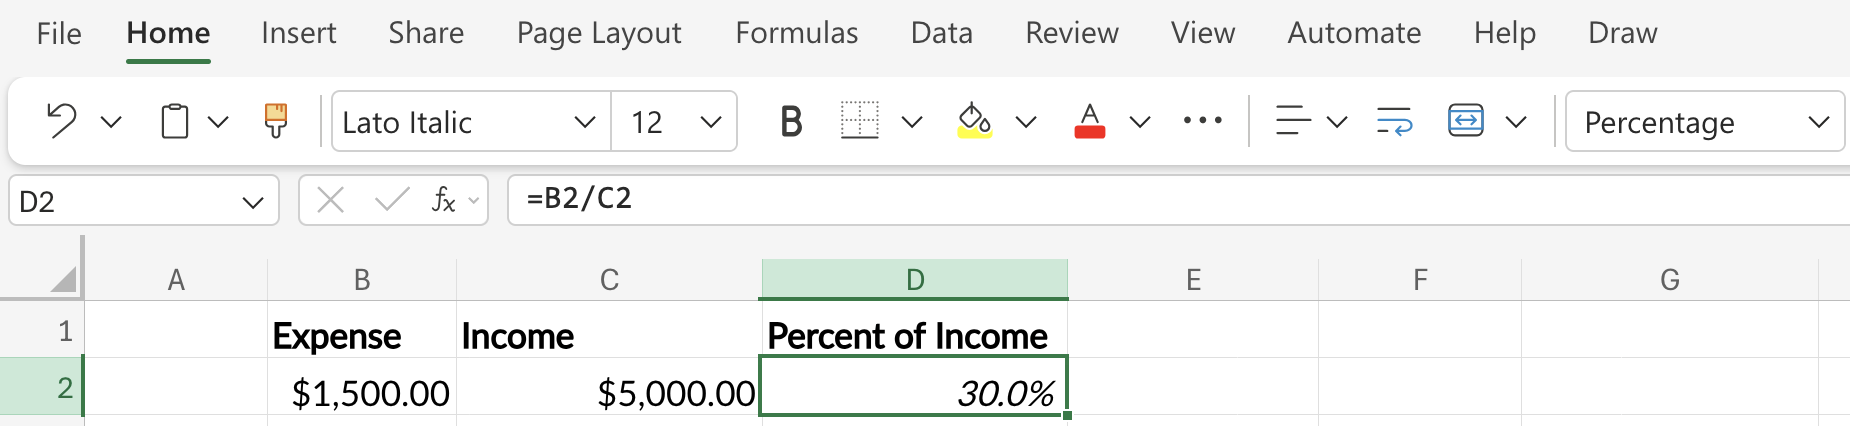
Or, more simply, enter =B2 / C2 and format the cell as a Percentage using the button in the toolbar.
3 Annualizing and Monthly-izing
Scale any spending habit across time periods to see the true cost.
Annual → Monthly: ÷ 12
Monthly → Annual: × 12
Weekly → Monthly: × 4.33
Daily → Annual: × 365
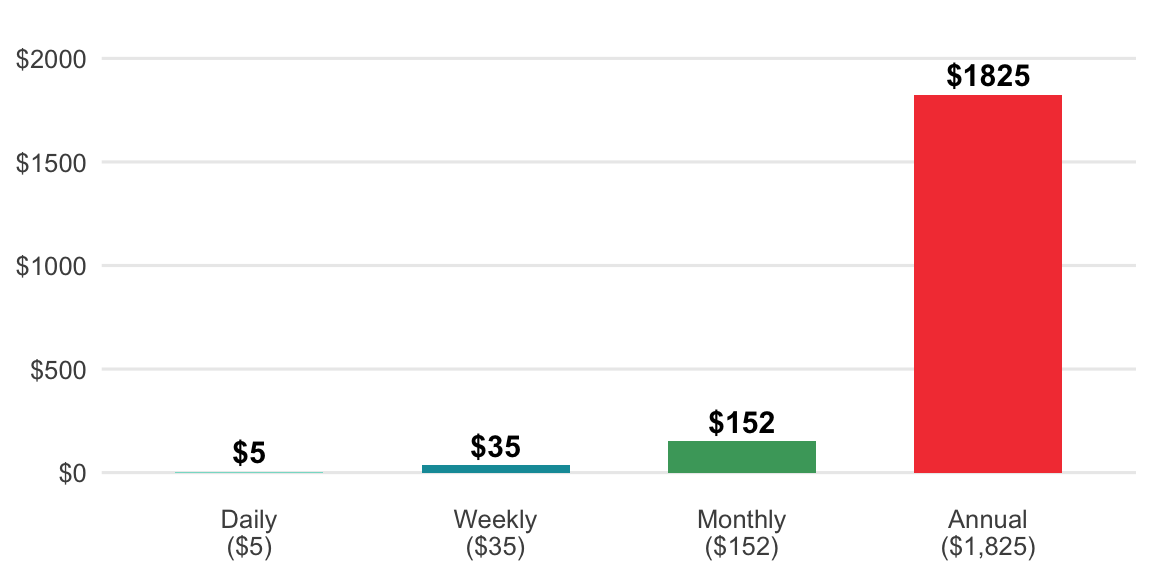
Two of the most common conversions are annualizing daily, weekly, and monthly amounts and converting annual, weekly, or daily amounts to a monthly equivalent.
to_annual <- function(amount, period = c("daily", "weekly", "monthly")) {
  period  <- match.arg(period)
  factors <- c(daily = 365, weekly = 52, monthly = 12)
  fmt_dollar(amount * factors[[period]])
}
to_monthly <- function(amount, period = c("daily", "weekly", "annual")) {
period <- match.arg(period)
factors <- c(daily = 30.44, weekly = 4.33, annual = 1 / 12)
fmt_dollar(amount * factors[[period]])
}to_annual(amount = 5, period = "daily")
#> [1] "$1,825.00"to_monthly(amount = 150, period = "weekly")
#> [1] "$649.50"def to_annual(amount, period="daily"):
factors = {"daily": 365, "weekly": 52, "monthly": 12}
return fmt_dollar(amount * factors[period])def to_monthly(amount, period="daily"):
factors = {"daily": 30.44, "weekly": 4.33, "annual": 1 / 12}
return fmt_dollar(amount * factors[period])print(to_annual(amount=5, period="daily"))
#> $1,825.00print(to_monthly(amount=150, period="weekly"))
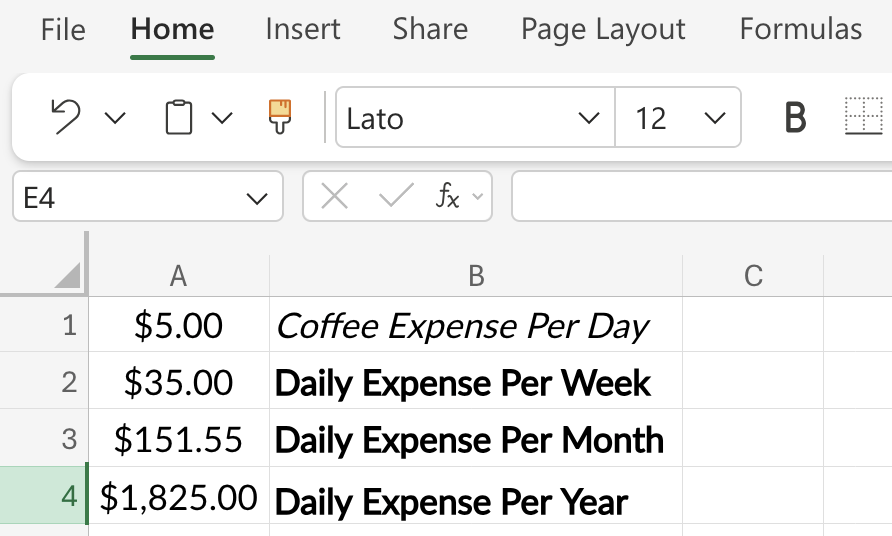
#> $649.50Let’s start with the daily value in cell A1, then convert it to the cost per week in cell A2:
=A1 * 7Next we can convert the week to the monthly cost in cell A3:
=A2 * 4.33Finally, we get the annual cost in cell A4:
=A1 * 365Format cells A1 - A4 as Currency or Accounting.
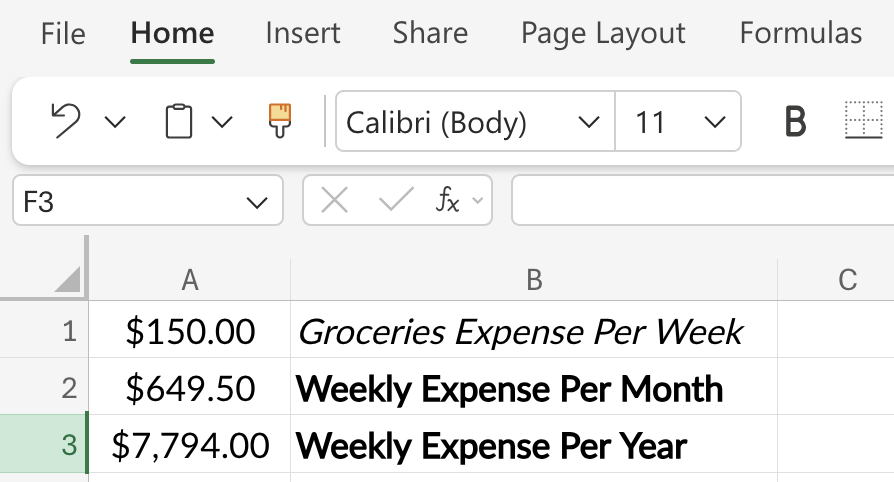
To convert a weekly value in cell A1 to a monthly value, place the following formula in cell A2:
=A1 * 4.33To convert the monthly cost to an annual cost, enter the following in cell A3:
=A2 * 12Format cells A1 - A3 as Currency or Accounting.
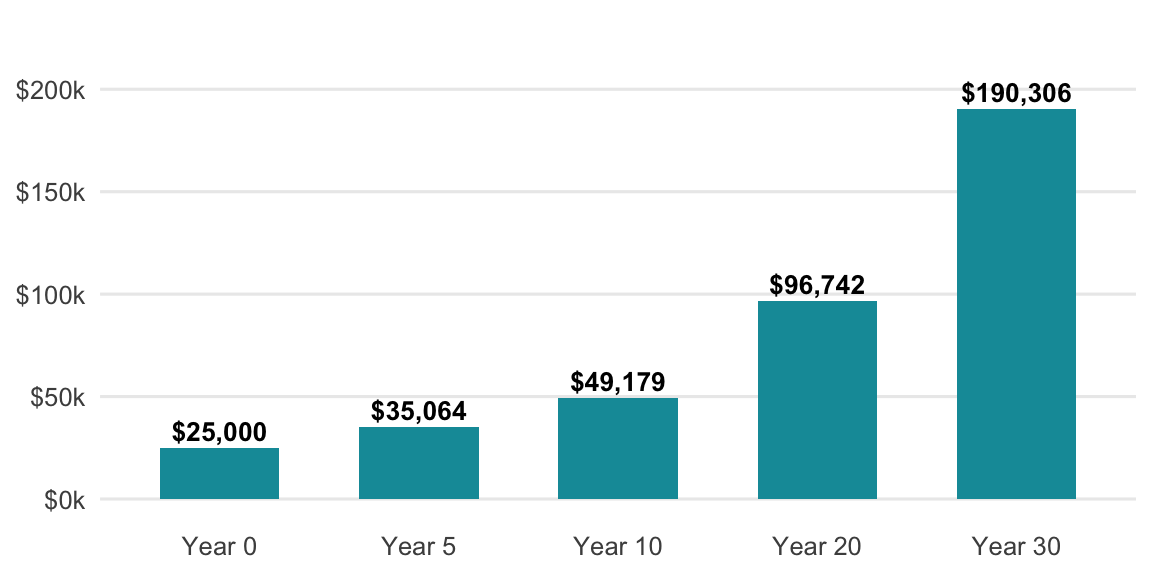
4 Opportunity Cost
Every dollar spent is also what that dollar could have become. The hidden cost of any purchase is its future value if invested instead.
Formula: amount × (1 + r)^n
show/hide
opportunity_cost <- function(amount, rate, years) {
  (amount * (1 + rate)^years) |>
    fmt_dollar()
}
show/hide
opportunity_cost(amount = 25000, rate = 0.07, years = 30)
#> [1] "$190,306.38"
In Python, we store intermediate values explicitly before formatting; this makes the calculation steps transparent and easier to debug.
show/hide
def opportunity_cost(amount, rate, years):
    fv = amount * (1 + rate) ** years
    return fmt_dollar(fv)
show/hide
opportunity_cost(amount=25000, rate=0.07, years=30)
#> '$190,306.38'
Assuming the initial amount is in cell A2, the annual rate (as a decimal, e.g., 0.07) is in B2, and the number of years is in C2:
=A2*(1+B2)^C2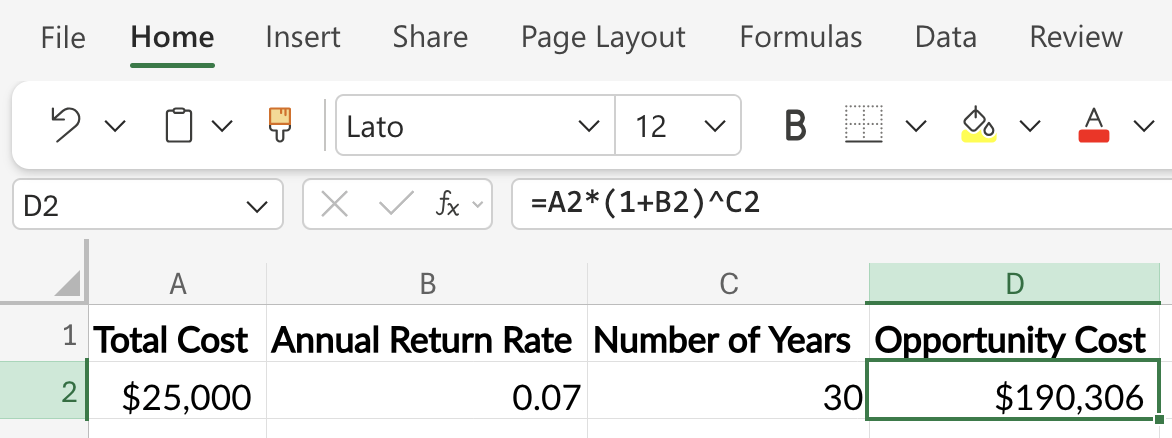
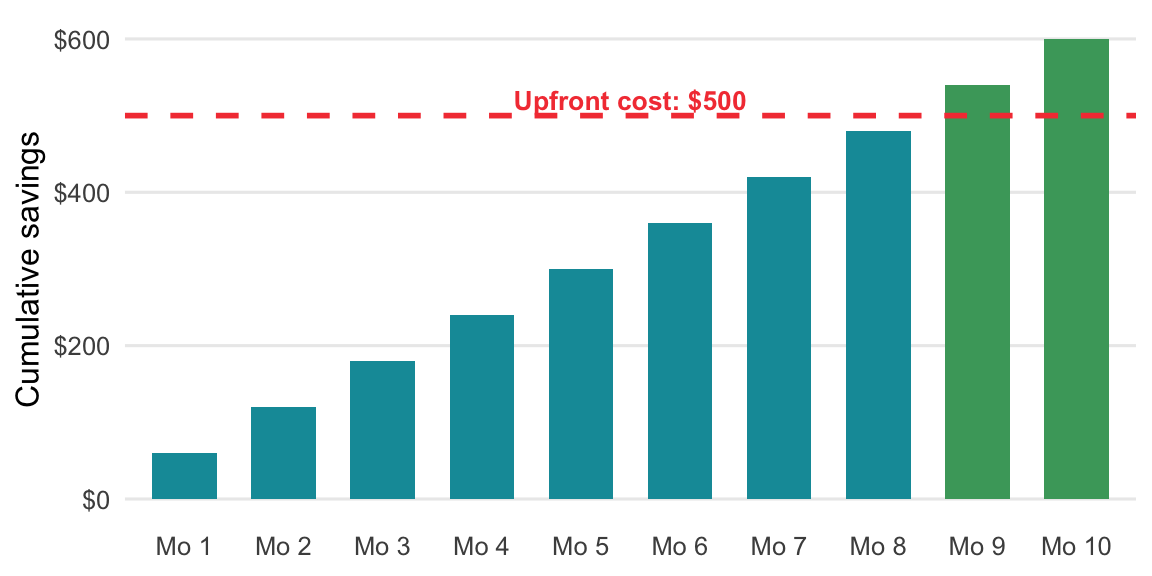
5 Break-Even
Useful for evaluating memberships, refinances, or any purchase with an upfront cost and recurring savings.
Formula: Upfront Cost ÷ Monthly Savings = months to break even
months_to_break_even <- function(upfront_cost, monthly_savings) {
  upfront_cost / monthly_savings
}months_to_break_even(upfront_cost = 500, monthly_savings = 60)
#> [1] 8.333333def months_to_break_even(upfront_cost, monthly_savings):
return upfront_cost / monthly_savingsmonths_to_break_even(upfront_cost=500, monthly_savings=60)
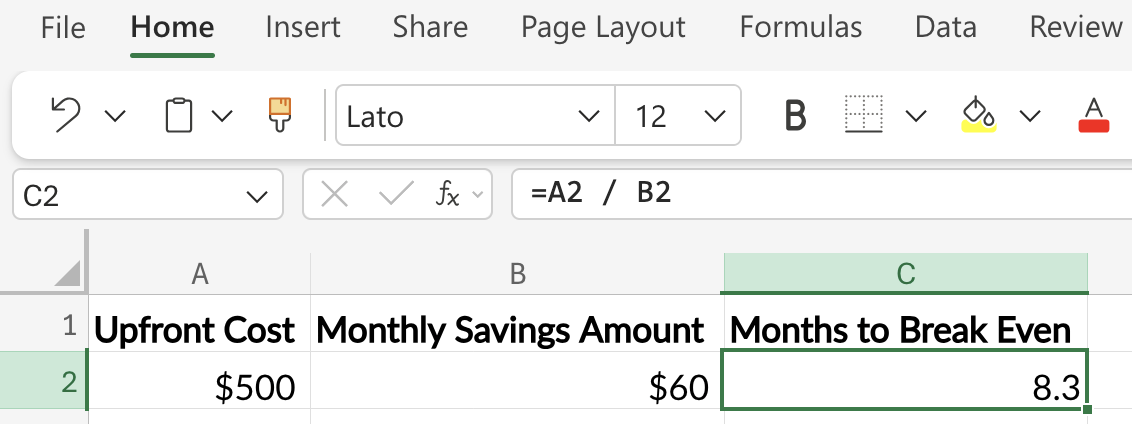
#> 8.333333333333334Assuming the upfront cost is in cell A2 and the monthly savings amount is in cell B2:
=A2 / B2