Each topic starts with a real scenario and a bar model, then three levels of exercises. Level 1 (Guided) fills in the blanks of a finished function. Level 2 (Practice) applies it to new numbers. Level 3 (Challenge) asks a new question with little scaffolding. The R and Python exercises run in your browser: click Run Code to try, Submit Answer to check, and use the hint or solution if you get stuck. Excel exercises have a solution you can reveal.
A higher deductible lowers your premium but costs more on each claim. The break even point is how many years of premium savings it takes to cover the extra deductible.
Formula: Break even years = (Higher deductible − Lower deductible) ÷ Yearly premium savings
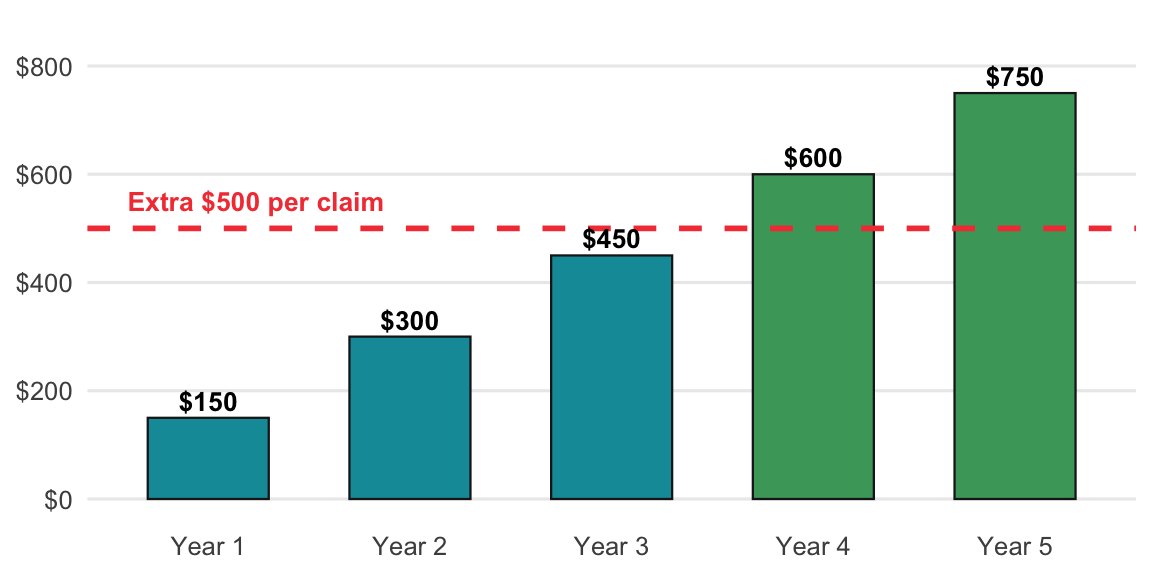
Car insurance costs $1,500 a year with a $500 deductible, or $1,350 with a $1,000 deductible. ($1,000 − $500) ÷ $150 = about 3.3 years. If you file a claim less often than that, the higher deductible comes out ahead.
How to read this result: a positive yearly gain means the higher deductible saves money on average. The gain turns negative only if you claim more often than the break even. Either way, pick the higher deductible only if your emergency fund can cover it.
Fill in the blanks to finish break_even_years(), then find how many claim-free years it takes for a $1,000 deductible (instead of $500) that saves $150 a year to pay off.
Put the higher deductible in A2 (1000), the lower one in B2 (500), and the yearly savings in C2 (150). Find the break-even years in D2.
=(A2 - B2) / C2This returns 3.3 years.
The extra risk you take on is the difference between the two deductibles.
def break_even_years(high_deductible, low_deductible, yearly_savings):
    return (high_deductible - low_deductible) / yearly_savings

break_even_years(1000, 500, 150)
The extra risk you take on is the difference between the two deductibles.
break_even_years <- function(high_deductible, low_deductible, yearly_savings) {
  (high_deductible - low_deductible) / yearly_savings
}
break_even_years(1000, 500, 150)Another quote: a $2,000 deductible instead of $500 saves $250 a year. What is the break-even?
Change the inputs to 2000, 500, and 250.
The same formula returns 6 years.
High 2000, low 500, savings 250.
break_even_years(2000, 500, 250)High 2000, low 500, savings 250.
break_even_years(2000, 500, 250)Back to the $1,000 vs. $500 choice that saves $150 a year. If you file one claim every k years, your yearly gain from the higher deductible is 150 − 500 ÷ k. Of k = 2, 3, 5, and 10, what is the most frequent claim rate (smallest k) where the higher deductible comes out ahead?
Put k in A2:A5, the yearly gain in B, and find the smallest k with a positive gain.
In B2, filled down: =150 - 500/A2. Then:
=MINIFS(A2:A5, B2:B5, ">0")The answer is 5. Claiming every 2 or 3 years, the lower deductible is cheaper.
Use min(k for k in claim_every if 150 - 500 / k > 0).
claim_every = [2, 3, 5, 10]
min(k for k in claim_every if 150 - 500 / k > 0)
Compute gain <- 150 - 500 / claim_every for all four at once, then min(claim_every[...]).
claim_every <- c(2, 3, 5, 10)
gain <- 150 - 500 / claim_every
min(claim_every[gain > 0])A health plan’s real yearly cost is its premiums plus your share of medical bills, minus any money your employer puts in your HSA. Your share can never go above the out of pocket maximum.
Formula: Yearly cost = (Monthly premium × 12) + min(Medical bills, Out of pocket max) − Employer HSA money
This simple version assumes you pay all medical bills up to the out of pocket maximum, so it slightly overstates plans with coinsurance.
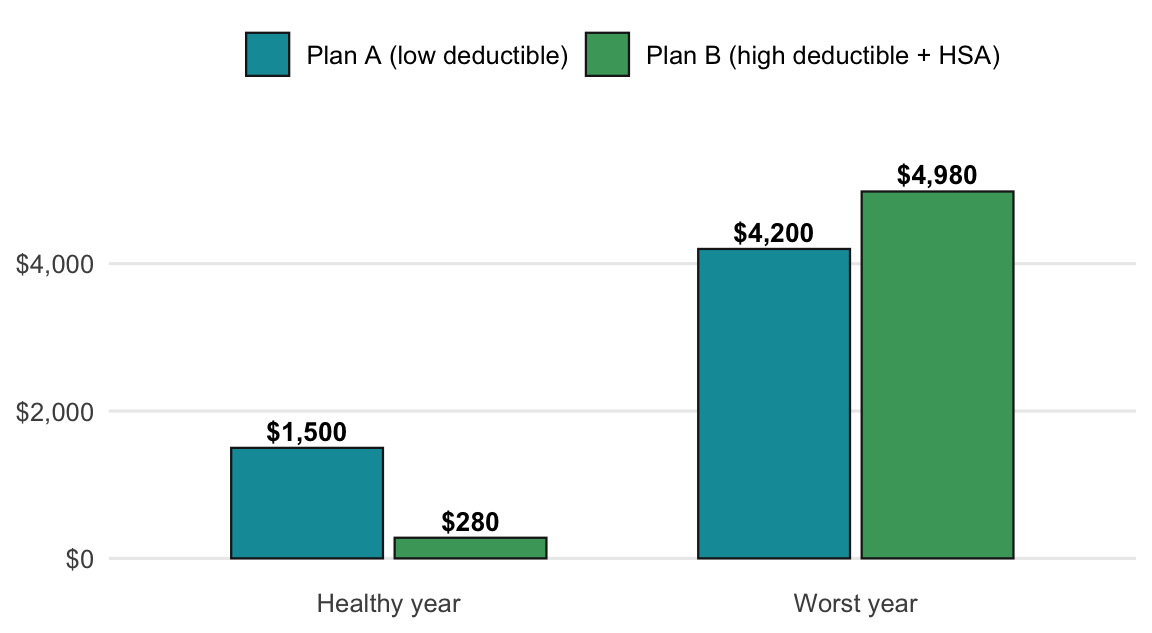
Plan A has a $100 monthly premium and a $3,000 out of pocket maximum. Plan B has a $40 monthly premium, a $5,000 out of pocket maximum, and $500 a year from your employer in the HSA. In a healthy year ($300 of care), Plan A costs $1,500 and Plan B costs $280. In the worst year, Plan A costs $4,200 and Plan B costs $4,980.
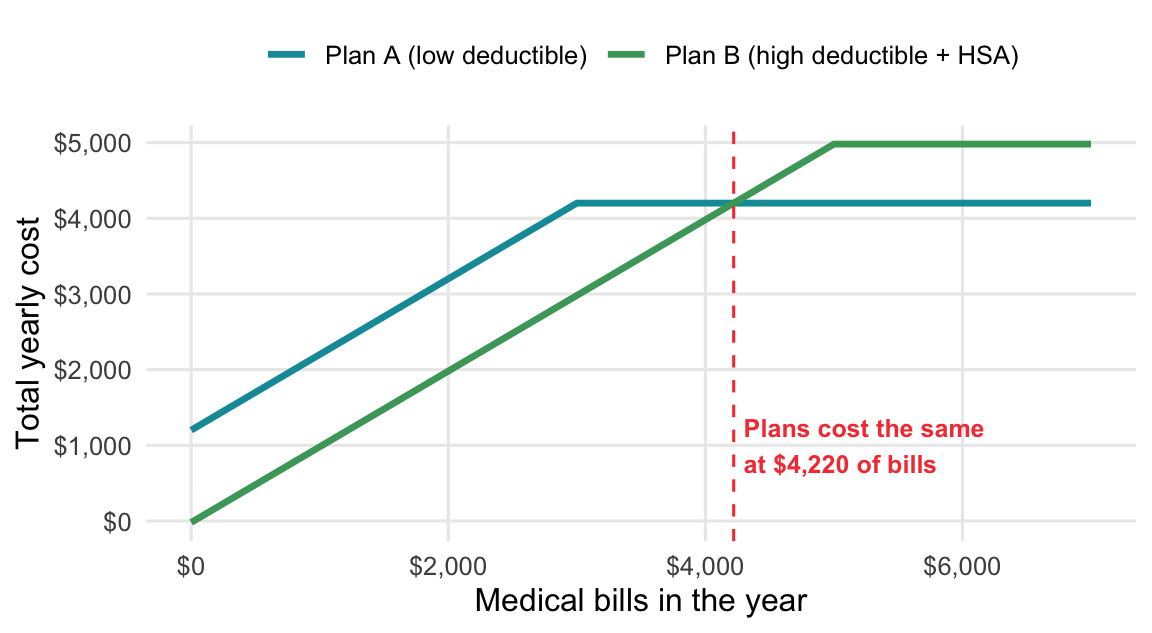
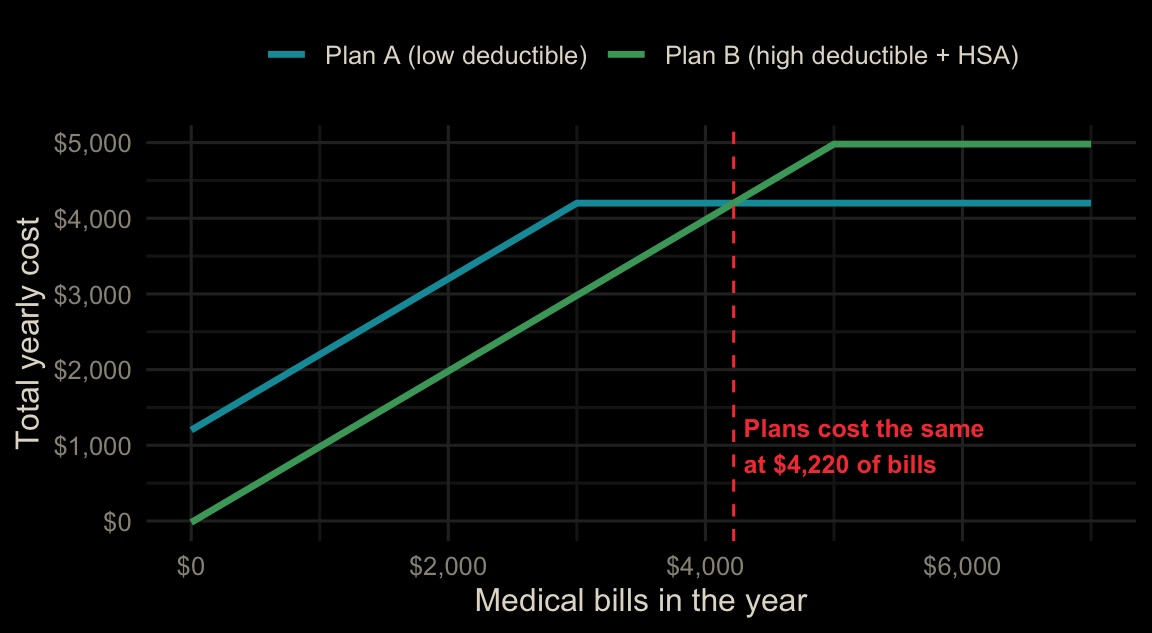
How to read this result: the gap between the lines is what you save (or lose) with Plan B. Below $4,220 of bills, Plan B wins by up to $1,220. Above it, Plan A wins by at most $780. If you put Plan B’s savings into the HSA, one healthy year covers the difference.
Fill in the blanks to finish plan_cost(), then find Plan A’s yearly cost ($100 a month, $3,000 out-of-pocket max) in a healthy year with $300 of medical bills.
Put the premium in A2 (100), bills in B2 (300), the out-of-pocket max in C2 (3000), and employer HSA money in D2 (0). Find the yearly cost in E2.
=A2*12 + MIN(B2, C2) - D2This returns $1,500.
Premiums are paid every month. You never pay more in bills than the out-of-pocket max.
import numpy as np
def plan_cost(monthly_premium, medical_cost, oop_max, employer_hsa=0):
    return monthly_premium * 12 + np.minimum(medical_cost, oop_max) - employer_hsa

plan_cost(100, 300, 3000)
Premiums are paid every month. You never pay more in bills than the out-of-pocket max.
plan_cost <- function(monthly_premium, medical_cost, oop_max, employer_hsa = 0) {
  monthly_premium * 12 + pmin(medical_cost, oop_max) - employer_hsa
}
plan_cost(100, 300, 3000)Plan B costs $40 a month with a $5,000 out-of-pocket max, and the employer puts $500 in your HSA. What does Plan B cost in the worst year, when you hit the max?
Change the inputs to 40, a very large bill (or the max), 5000, and 500.
=40*12 + 5000 - 500This returns $4,980, versus $4,200 for Plan A.
A bill of infinity means you hit the out-of-pocket max. The max is 5000 and the HSA money is 500.
plan_cost(40, float("inf"), 5000, employer_hsa=500)A bill of Inf means you hit the out-of-pocket max. The max is 5000 and the HSA money is 500.
plan_cost(40, Inf, 5000, employer_hsa = 500)Plan B is cheaper in healthy years and Plan A in bad ones. Checking medical bills from $3,000 to $5,000 in $10 steps, what is the lowest bill where Plan B costs as much as or more than Plan A?
Work it out with algebra: above $3,000, Plan A is capped at 1,200 + 3,000, and Plan B is 480 + bills − 500.
Set them equal: 480 + bills − 500 = 4,200, so =4200 - 480 + 500 gives $4,220.
plan_cost() uses np.minimum, so it works on the whole bills array. Compute a and b, then bills[b >= a].min().
bills = np.arange(3000, 5001, 10)
a = plan_cost(100, bills, 3000)
b = plan_cost(40, bills, 5000, employer_hsa=500)
bills[b >= a].min()
plan_cost() uses pmin(), so it works on all bills at once. Compute a and b, then min(bills[b >= a]).
bills <- seq(3000, 5000, by = 10)
a <- plan_cost(100, bills, 3000)
b <- plan_cost(40, bills, 5000, employer_hsa = 500)
min(bills[b >= a])