
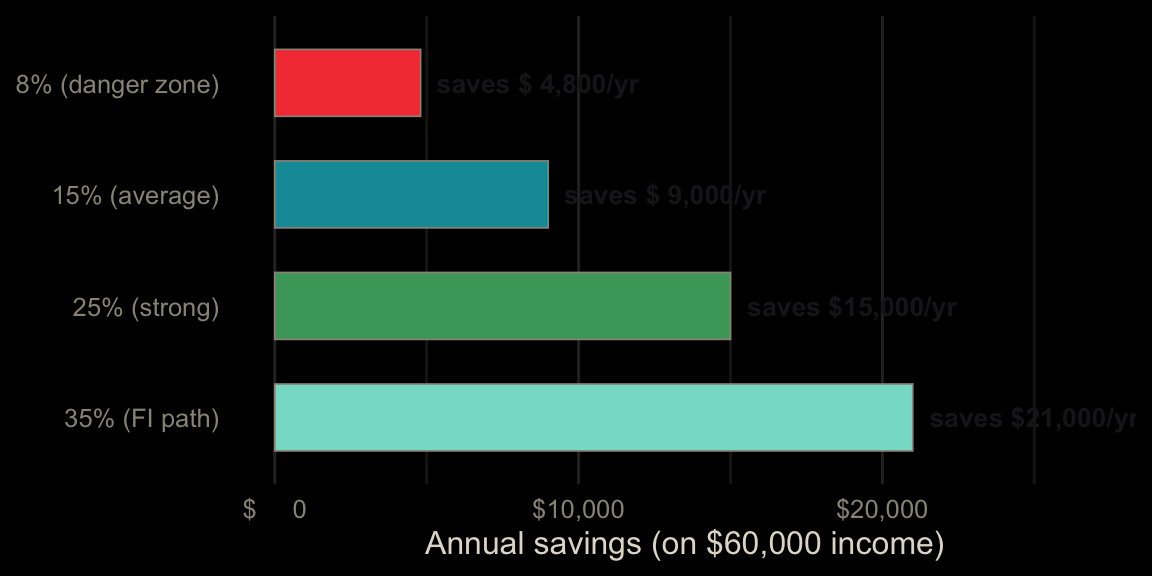
Each topic starts with a real scenario and a bar model, then three levels of exercises. Level 1 (Guided) fills in the blanks of a finished function. Level 2 (Practice) applies it to new numbers. Level 3 (Challenge) asks a new question with little scaffolding. The R and Python exercises run in your browser: click Run Code to try, Submit Answer to check, and use the hint or solution if you get stuck. Excel exercises have a solution you can reveal.
The savings rate is the slice of your income bar that goes to savings. Every dollar goes to either spending or savings, so the rate measures how big the savings slice is.
Formula: Savings Rate = (Income − Spending) ÷ Income × 100
Example: you take home $5,000 and spend $3,500. (5,000 − 3,500) ÷ 5,000 = 30% savings rate.
How to read this result: a 30% rate means 30 cents of every dollar you bring home stays with you. If the rate is negative, you are spending more than you earn and the gap is coming from savings or debt.
Fill in the blanks to finish savings_rate(), then find the savings rate when you take home $5,000 and spend $3,500.
Put income in A2 (5000) and spending in B2 (3500). Find the savings rate in C2.
=(A2 - B2) / A2 * 100This returns 30.
What you save is what you earn minus what you spend.
def savings_rate(income, spending):
    return ((income - spending) / income) * 100

savings_rate(5000, 3500)
What you save is what you earn minus what you spend.
savings_rate <- function(income, spending) {
  ((income - spending) / income) * 100
}
savings_rate(5000, 3500)Flip the formula. To save 25% of a $5,000 paycheck, what is the most you can spend? Spending = Income × (1 − Rate).
Put income in A2 (5000) and the target rate in B2 (0.25). Find the spending limit in C2.
=A2 * (1 - B2)This returns $3,750.
Write 25% as 0.25. The share you can spend is 1 - target_rate.
def spending_limit(income, target_rate):
    return income * (1 - target_rate)

spending_limit(5000, 0.25)
Write 25% as 0.25. The share you can spend is 1 - target_rate.
spending_limit <- function(income, target_rate) {
  income * (1 - target_rate)
}
spending_limit(5000, 0.25)Label each spending level on a $5,000 income with the book’s tier: under 10% is “Danger zone”, 10% to under 20% “Average”, 20% to under 30% “Strong”, and 30% or more “FI path”. Spending levels: $4,700, $4,250, $3,750, $3,250, and $5,200.
Put spending in A2:A6, the rate in B2:B6, and the tier in C2:C6.
In B2, filled down: =(5000-A2)/5000*100. In C2, filled down:
=IFS(B2 < 10, "Danger zone", B2 < 20, "Average", B2 < 30, "Strong", TRUE, "FI path")The tiers are Danger zone, Average, Strong, FI path, Danger zone. The last one spends more than it earns (-4%).
np.select() checks conditions in order: [rate < 10, rate < 20, rate < 30] with labels ["Danger zone", "Average", "Strong"] and default="FI path". Finish with .tolist().
levels["rate"] = savings_rate(5000, levels["spending"])
rate = levels["rate"]
levels["tier"] = np.select(
    [rate < 10, rate < 20, rate < 30],
    ["Danger zone", "Average", "Strong"],
    default="FI path"
)
levels["tier"].tolist()
case_when() checks in order: rate < 10 ~ "Danger zone", then rate < 20, then rate < 30, then .default = "FI path". Finish with pull(tier).
levels |>
  mutate(
    rate = savings_rate(5000, spending),
    tier = case_when(
      rate < 10 ~ "Danger zone",
      rate < 20 ~ "Average",
      rate < 30 ~ "Strong",
      .default = "FI path"
    )
  ) |>
pull(tier)The book compares two savers at a 7% return. One earns $40,000 and saves 40% ($16,000 a year). The other earns $120,000 and saves 10% ($12,000 a year). The bigger saver reaches $500,000 first. We can solve for the number of years directly.
Formula: Years = ln(1 + Target × r ÷ Annual Savings) ÷ ln(1 + r)
Example: ln(1 + 500,000 × 0.07 ÷ 16,000) ÷ ln(1.07) = 17.1 years, so the balance passes $500k during year 18. At $12,000 a year it takes 20.2 years, so year 21.
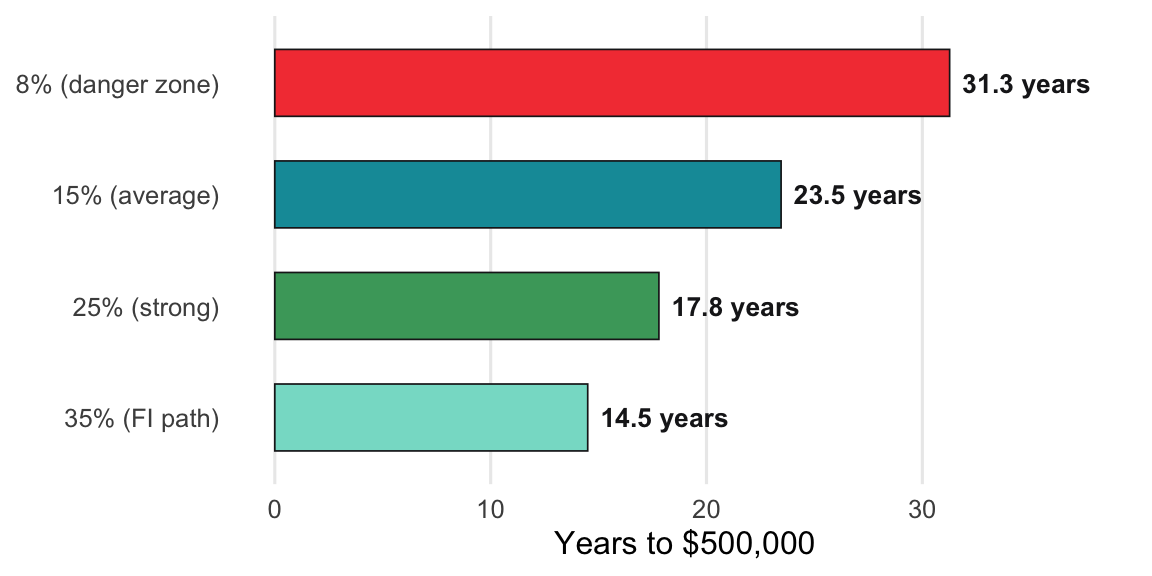
How to read this result: the answer is the number of years of steady saving needed, not counting anything you already have. Raising the savings rate shortens the timeline much more at low rates than at high ones.
Fill in the blanks to finish years_to_target(), then find how long $16,000 a year at 7% takes to reach $500,000.
Put yearly savings in A2 (16000), the target in B2 (500000), and the return in C2 (0.07). Find the years in D2.
=NPER(C2, -A2, 0, B2)This returns about 17.1 years.
The formula is ln(1 + Target × r ÷ Annual Savings) ÷ ln(1 + r).
import math
def years_to_target(annual_savings, target, rate=0.07):
    return math.log(1 + target * rate / annual_savings) / math.log(1 + rate)

years_to_target(16000, 500000)
The formula is ln(1 + Target × r ÷ Annual Savings) ÷ ln(1 + r).
years_to_target <- function(annual_savings, target, rate = 0.07) {
  log(1 + target * rate / annual_savings) / log(1 + rate)
}
years_to_target(16000, 500000)A higher earner saves $12,000 a year (10% of $120,000). In which year does the balance pass $500,000?
Change A2 to 12000 and round up.
=ROUNDUP(NPER(C2, -A2, 0, B2), 0)This returns 21, four years after the $40,000 earner saving 40%.
Round up with math.ceil(); the balance passes the target during that year.
math.ceil(years_to_target(12000, 500000))Round up with ceiling(); the balance passes the target during that year.
ceiling(years_to_target(12000, 500000))On a $60,000 income, what is the smallest whole-percent savings rate (from 5% to 50%) that reaches $500,000 within 20 years at 7%? Give it as a decimal.
Find the yearly savings needed, divide by income, and round up to the next whole percent.
=ROUNDUP(PMT(7%, 20, 0, -500000) / 60000, 2)PMT() says you need $12,196 a year, which is 20.3% of income, so 21%.
Yearly savings is 60000 * r. Use min(r for r in rates if years_to_target(60000 * r, 500000) <= 20).
rates = [r / 100 for r in range(5, 51)]
min(r for r in rates if years_to_target(60000 * r, 500000) <= 20)
years_to_target() is vectorized: pass 60000 * rates, then use min(rates[...]).
rates <- seq(0.05, 0.50, by = 0.01)
years <- years_to_target(60000 * rates, 500000)
min(rates[years <= 20])