---
title: "Penguins EDA"
format:
html:
code-fold: true
---
## Penguin Size and Mass by Sex and Species
```{r}
library(palmerpenguins)
library(dplyr)
library(ggplot2)
df <- palmerpenguins::penguins
```
```{r}
df %>%
group_by(species, sex) %>%
summarise(
across(
where(is.numeric),
\(x) mean(x, na.rm = TRUE)
)
) %>%
knitr::kable()
```
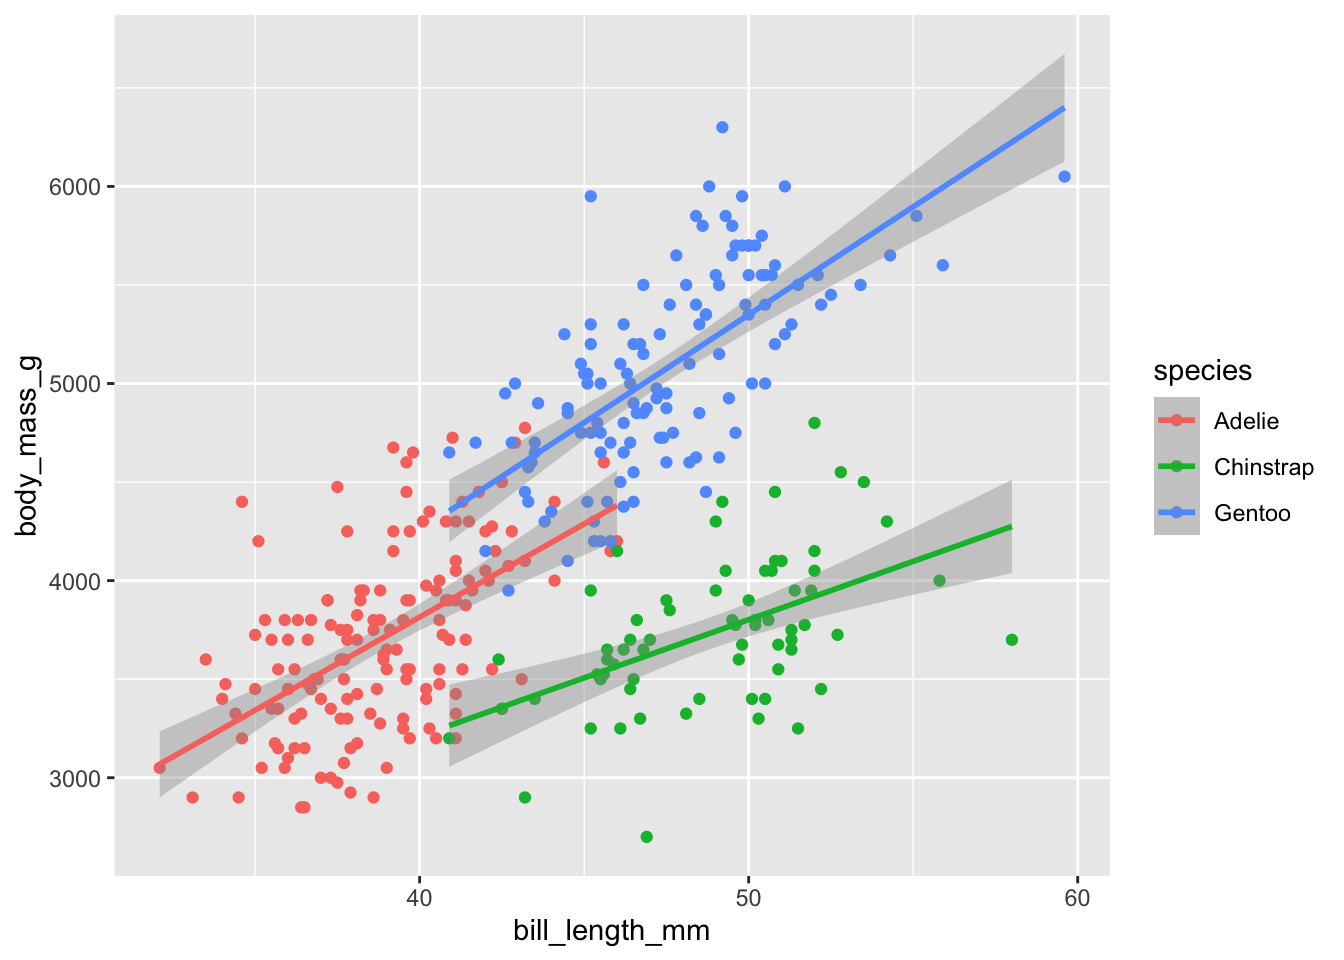
## Penguin Size vs Mass by Species
```{r}
df %>%
ggplot(aes(x = bill_length_mm, y = body_mass_g, color = species)) +
geom_point() +
geom_smooth(method = "lm")
```EDA in R
The eda-basic.qmd file includes some standard data pipeline functions for exploratory data analysis.
Expand the section below to view the source file:
View eda-basic.qmd
I’ve also included the code from the eda-basic.qmd file in the sections below.
Load data
library(palmerpenguins)
library(dplyr)
library(ggplot2)

df <- palmerpenguins::penguins
Manipulate and summarize
df %>%
  dplyr::group_by(species, sex) %>%
  dplyr::summarise(
    dplyr::across(
      dplyr::where(is.numeric),
      \(x) mean(x, na.rm = TRUE)
      )
    ) %>%
knitr::kable()| species | sex | bill_length_mm | bill_depth_mm | flipper_length_mm | body_mass_g | year |
|---|---|---|---|---|---|---|
| Adelie | female | 37.25753 | 17.62192 | 187.7945 | 3368.836 | 2008.055 |
| Adelie | male | 40.39041 | 19.07260 | 192.4110 | 4043.493 | 2008.055 |
| Adelie | NA | 37.84000 | 18.32000 | 185.6000 | 3540.000 | 2007.000 |
| Chinstrap | female | 46.57353 | 17.58824 | 191.7353 | 3527.206 | 2007.971 |
| Chinstrap | male | 51.09412 | 19.25294 | 199.9118 | 3938.971 | 2007.971 |
| Gentoo | female | 45.56379 | 14.23793 | 212.7069 | 4679.741 | 2008.069 |
| Gentoo | male | 49.47377 | 15.71803 | 221.5410 | 5484.836 | 2008.066 |
| Gentoo | NA | 45.62500 | 14.55000 | 215.7500 | 4587.500 | 2008.400 |
Visualize
df %>%
  ggplot2::ggplot(
    ggplot2::aes(
      x = bill_length_mm,
      y = body_mass_g,
      color = species)) +
  ggplot2::geom_point() +
  ggplot2::geom_smooth(method = "lm")