%%{init: {'theme': 'base', 'themeVariables': {'fontFamily': 'monospace'}}}%%

sequenceDiagram
    participant User as User's<br>Browser
    participant Shiny as Shiny App<br>(app.R)
    participant API as plumber2 API<br>(plumber.R)
    participant Model as Vetiver<br>Model

    User->>Shiny: Clicks "Predict" button

    Note over Shiny: Collect inputs:<br>bill_length=45<br>species=Adelie<br>sex=Male

    Shiny->>Shiny: Create data.frame

    Shiny->>API: HTTP POST /predict<br>{"bill_length_mm":45,...}

    Note over API: body parsed<br>by plumber2
    API->>API: prep_pred_data()

    API->>Model: predict(v, data)
    Note over Model: Linear<br>regression:<br>4180.797<br>grams
    Model-->>API: 4180.797

    API-->>Shiny: HTTP 200 OK<br>{".pred":[4180.797]}

    Note over Shiny: Extract value<br>Format as text

    Shiny-->>User: Display:<br>"4180.8 grams"
R App Logging
This lab covers how to use logging and monitoring to track events inside data science projects (specifically inside a Shiny application), and what you can do with logs and metrics when they are created.
Overview
For a refresher, I’ve included a diagram of the Shiny App and API (using the plumber2 version) from the previous lab (i.e., the user inputs are sent to the API with the Predict button):
The files for the application and API can be found in the following location:
The API
_labs/lab04/R/api/
              ├── api.Rproj
              ├── model.R
              ├── models/
              │   └── penguin_model/
              ├── my-db.duckdb
              ├── plumber.R
              ├── renv/
              └── renv.lock
model.R
The model.R file creates our vetiver model:
- Creates the
my-db.duckdbfile (with a subset thepalmerpenguins::penguinsdata). - Converts the
lm()model object tovetivermodel.
- The model is stored in the
models/folder withpins::board_folder()andvetiver::vetiver_pin_write().
This script only needs to be run once (or whenever the model changes).
plumber.R
The plumber.R file contains the same API we created in plumber2, updated to use plumber2 syntax (api(), api_get(), api_post(), api_run()). Launching the API in Positron displays the documentation and handlers:
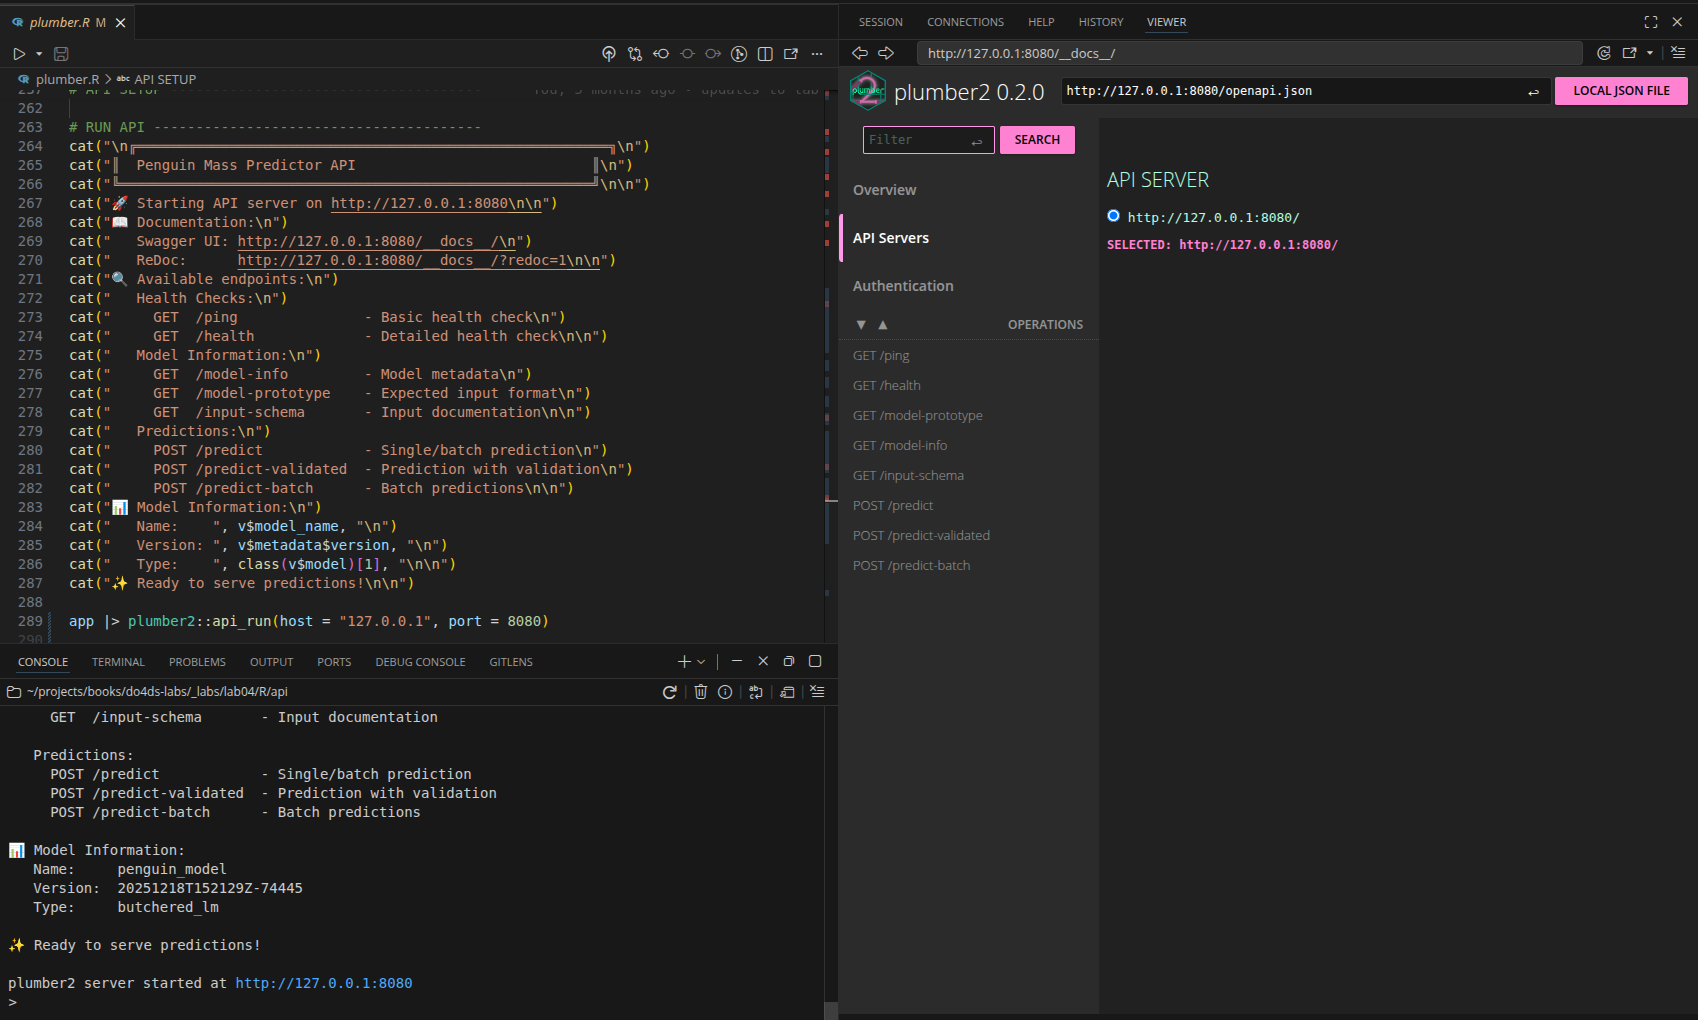
plumber2 API with vetiver modelThe App
_labs/lab04/R/app/
              ├── app.R
              ├── app.Rproj
              ├── README.md
              ├── renv/
              ├── renv.lock
              └── shiny_app.log
Below we load the packages for app design (bslib, bsicons), making the API request (httr2), and logging and monitoring (logger and jsonlite).
I chose the logger package instead of the example from the text (log4r) because I’m more familiar with it’s features.
library(shiny)
library(bslib)
library(bsicons)
library(httr2)
library(logger)
library(jsonlite)
Configure logging
Below we’ll configure the log level and assign the log_appender() with the appender_tee().1
logger also gives us control over the format of the log file with log_formatter() (I’ve found using the glue or sprintf formatter makes the logs more UI friendly).
logger::log_threshold(level = "DEBUG")
logger::log_appender(appender = appender_tee(file = "shiny_app.log"))
logger::log_formatter(logger::formatter_glue_or_sprintf)
App startup
We’ll start by logging the application startup within an observer to access session data (high priority to run early).
  observe({
    logger::log_info("Shiny app started - Session: {session$token} - Host: {session$clientData$url_hostname}")
  }, priority = 1000)
This log records when a new user session begins with the session token and client information for user tracking and session management.
User interactions
We’ll also track user interactions (but throttle to avoid excessive logging).2
observe({
  logger::log_debug("User input changed - Session: {session$token} - bill_length: {input$bill_length} - species: {input$species} - sex: {input$sex}")
}) |>
  throttle(2000)
This log captures user input changes for debugging user interaction flows and input validation issues.
Session token
We’ll display Session Token (a subset of session$token as log_status) in the upper right-hand corner of the UI.

UI
A custom div() is a good option here (with some minimal styling):
  div(
    style = "position: fixed; top: 10px; right: 10px; z-index: 1000; color: #fff;",
    strong("Session", textOutput("log_status", inline = TRUE))
  )
Server
This output is generated from substr(session$token, 1, 8):
  output$log_status <- renderText({
    paste("Token:", substr(session$token, 1, 8))
  })
Params and Predictions
The parameter display and predictions from the API remain largely unchanged here, other than to make room for the System Status column and card.
UI
The params and predictions are displayed in two bslib::cards() and include a value_box() and bs_icon() for the response from the API.
show/hide UI Penguin Parameters
  layout_columns(
    card(
      card_header("Penguin Parameters"),
      card_body(
        verbatimTextOutput(outputId = "vals")
      )
    ),
    card(
      card_header("Predicted Mass"),
      card_body(
        value_box(
          showcase_layout = "left center",
          title = "Grams",
          value = textOutput(outputId = "pred"),
          showcase = bs_icon("graph-up"),
          max_height = "200px",
          min_height = "200px",
        )
      )
    ),
    col_widths = c(6, 6),
    row_heights = c(3, 1),
  )
Note that I’ve added values for col_widths and row_heights.
Server
Penguin Parameters
In the server, we create the reactive vals() to be displayed in the Penguin Parameters section. I’ve included warning and error logs for input validation, and a single debugging log to examine the data sent to the API:
vals <- reactive({
bill_length <- input$bill_length
species <- input$species
sex <- input$sex
if (bill_length < 30 || bill_length > 60) {
logger::log_warn(
"Bill length out of typical range - Session: {session$token} - bill_length: {bill_length}"
)
}
if (is.null(species) || is.null(sex)) {
logger::log_error(
"Missing required inputs - Session: {session$token} - species_null: {is.null(species)} - sex_null: {is.null(sex)}"
)
return(NULL)
}
data <- data.frame(
bill_length_mm = bill_length,
species = species,
sex = tolower(sex)
)
logger::log_debug(
"Input data prepared - Session: {session$token} - data: {jsonlite::toJSON(data, auto_unbox = TRUE)}"
)
return(data)
})- 1
-
Raw reactive values
- 2
-
Logs incorrect input values that can lead to bad predictions or user confusion.
- 3
-
Logs critical input validation failures that prevent the application from functioning.
- 4
-
Convert reactives into a
data.frame.
- 5
- Logs formatted input data structure sent to the API.
- 6
-
Returns
data.frame
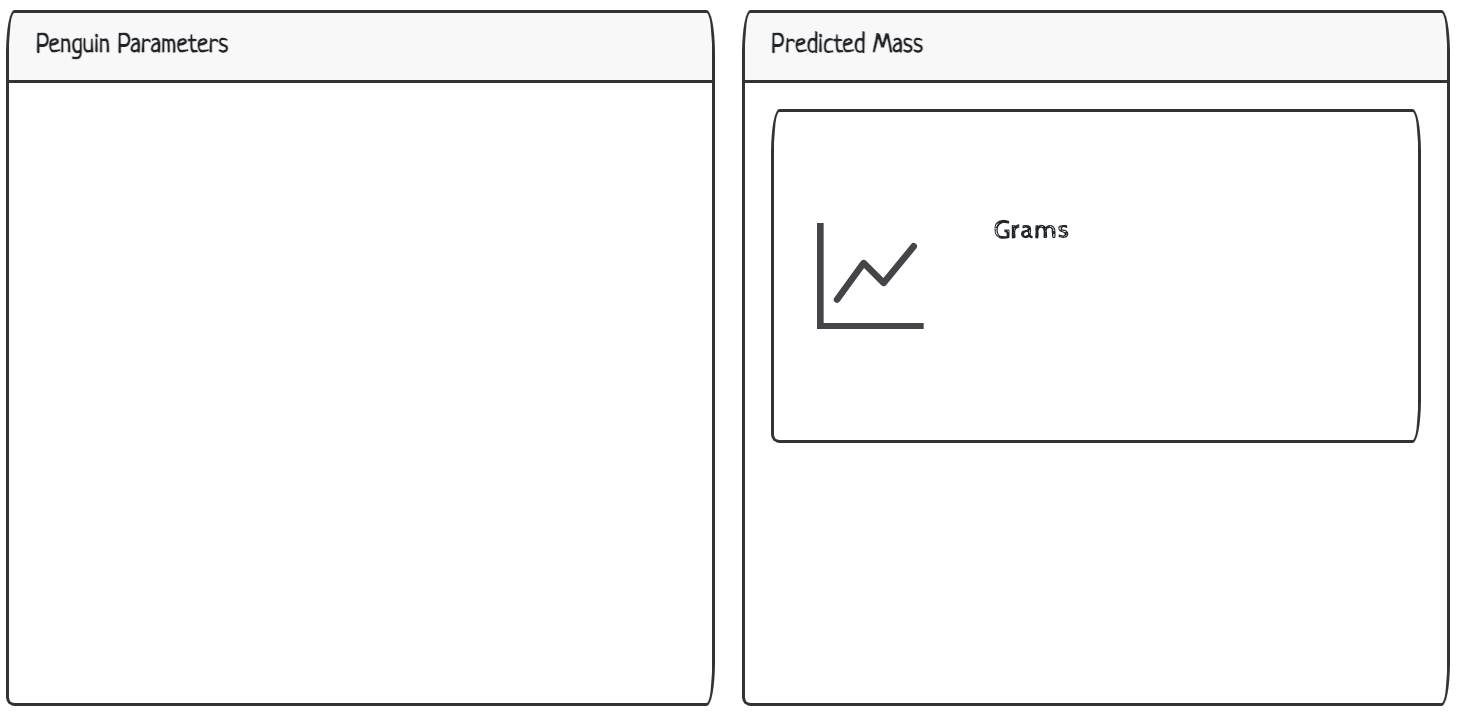
The vals() are printed to the UI in a data.frame:

Predicted Mass
I’ve added logs to the predictions reactive values below. As you can see, the majority of the logs are errors and warning, but I’ve also included notifications (showNotification()) for major events, too.
pred <- reactive({
request_start <- Sys.time()
request_data <- vals()
if (is.null(request_data)) {
logger::log_error(
"Cannot make prediction with invalid inputs - Session: {session$token}"
)
return("❌ Invalid inputs")
}
logger::log_info(
"Starting prediction request - Session: {session$token} - request_data: {jsonlite::toJSON(request_data, auto_unbox = TRUE)}"
)
tryCatch({
showNotification(
"Predicting penguin mass...",
type = "default",
duration = 3
)
response <- httr2::request(api_url) |>
httr2::req_method("POST") |>
httr2::req_body_json(request_data, auto_unbox = TRUE) |>
httr2::req_timeout(30) |>
httr2::req_perform()
response_time <- as.numeric(
difftime(Sys.time(), request_start, units = "secs")
)
response_data <- httr2::resp_body_json(response)
prediction_value <- if (is.list(response_data$.pred)) {
as.numeric(response_data$.pred[[1]])
} else {
as.numeric(response_data$.pred[1])
}
logger::log_info(
"Prediction successful - Session: {session$token} - response_time_sec: {round(response_time, 3)} - prediction: {prediction_value}"
)
if (response_time > 5) {
logger::log_warn(
"Slow API response - Session: {session$token} - response_time_sec: {response_time}"
)
}
showNotification(
"✅ Prediction successful!",
type = "message",
duration = 3
)
return(prediction_value)
}, error = function(e) {
error_msg <- conditionMessage(e)
response_time <- as.numeric(
difftime(Sys.time(), request_start, units = "secs")
)
logger::log_error(
"Prediction request failed - Session: {session$token} - error: {error_msg} - response_time_sec: {round(response_time, 3)}"
)
if (grepl("Connection refused|couldn't connect", error_msg, ignore.case = TRUE)) {
user_msg <- "API not available - is the server running on port 8080?"
logger::log_error("API connection refused - Session: {session$token}")
} else if (grepl("timeout|timed out", error_msg, ignore.case = TRUE)) {
user_msg <- "Request timed out - API may be overloaded"
logger::log_warn("API timeout occurred - Session: {session$token}")
} else {
user_msg <- paste("API Error:", substr(error_msg, 1, 50))
logger::log_error(
"Unknown API error - Session: {session$token} - error: {error_msg}"
)
}
showNotification(
paste("❌", user_msg),
type = "error",
duration = 5
)
return(paste("❌", user_msg))
})
}) |>
bindEvent(input$predict, ignoreInit = TRUE)- 1
-
Record API request start time
- 2
-
Reactive values from UI
- 3
-
Logs when/if the prediction requests fail because of data validation issues (critical application logic problems).
- 4
-
Logs initiation of prediction request w/ input parameters for request tracing and/or debugging.
- 5
-
Handles API communication failures (i.e., network issues, timeouts, etc) and provides meaningful error messages to users instead of crashing the application.
- 6
-
Notification for predicting penguin mass
- 7
-
httr2API request;auto_unbox = TRUEsends scalar values (e.g.,45not[45]) matching theplumber2body parser - 8
-
Record API response time
- 9
- API prediction response
- 10
- Extracts prediction value
- 11
- Logs successful predictions and performance metrics/results
- 12
-
Logs performance issues that could impact user experience and/or indicate need for system optimization.
- 13
-
Notification for successful prediction
- 14
-
Prediction values
- 15
-
tryCatch()error message
- 16
-
API Response time
- 17
-
Logs complete prediction failures with diagnostic information for troubleshooting critical application functionality.
- 18
-
Logs when the API is unreachable, indicating critical system failure.
- 19
- Logs API timeout events that suggest network issues or API overload.
- 20
- Logs unexpected API errors that don’t match known failure patterns.
- 21
-
Notification for error
- 22
- Trigger when Predict button is clicked.
The tryCatch() handles all possible API communication failures (network issues, timeouts, malformed responses, etc.) and provides meaningful error messages (instead of crashing the application).
After clicking Predict, the response from the API displays the predicted penguin mass in grams:
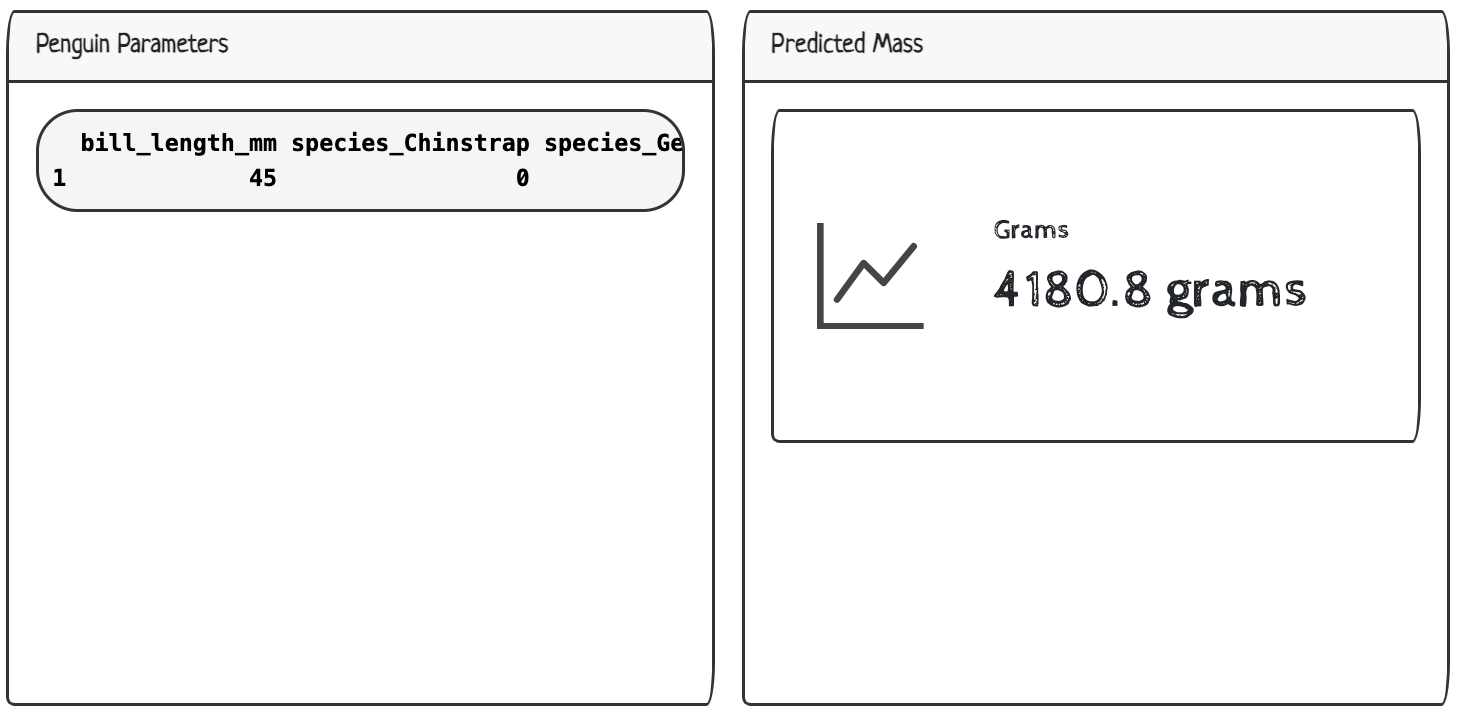
System Status
In the System Status display, we’ll 1) send a ping to the API and return the result as API Status, 2) print a subset of Recent Logs from the log file specified above in the logger::log_appender() function, and 3) include a timestamp displaying when the log file was Last updated.
UI
We can make room for a System Status section in the UI as a card() using layout_columns() (as long as we set the col_widths and a fixed height). The div() for the logs also gets some custom styling:
layout_columns(
card(
card_header("System Status"),
card_body(
h5("API Status:"),
textOutput("api_health"),
h5("Recent Logs:"),
div(
style = "font-family: 'Ubuntu Mono', monospace; font-size: 13px; background-color: #f8f9fa; padding: 10px; border-radius: 5px;",
verbatimTextOutput("recent_logs", placeholder = TRUE)
),
h6("Last updated:",
textOutput("log_timestamp", inline = TRUE)
),
style = "max-height: 350px; overflow-y: auto;"
)
),
col_widths = c(12),
height = "300px"
)- 1
-
Results from
pingsent to API
- 2
-
Log display from
shiny_log.logfile - 3
-
Last modification time of
shiny_log.logfile
- 4
-
Full width
- 5
- Fixed height
We’ll cover how to include each output in the System Status below.
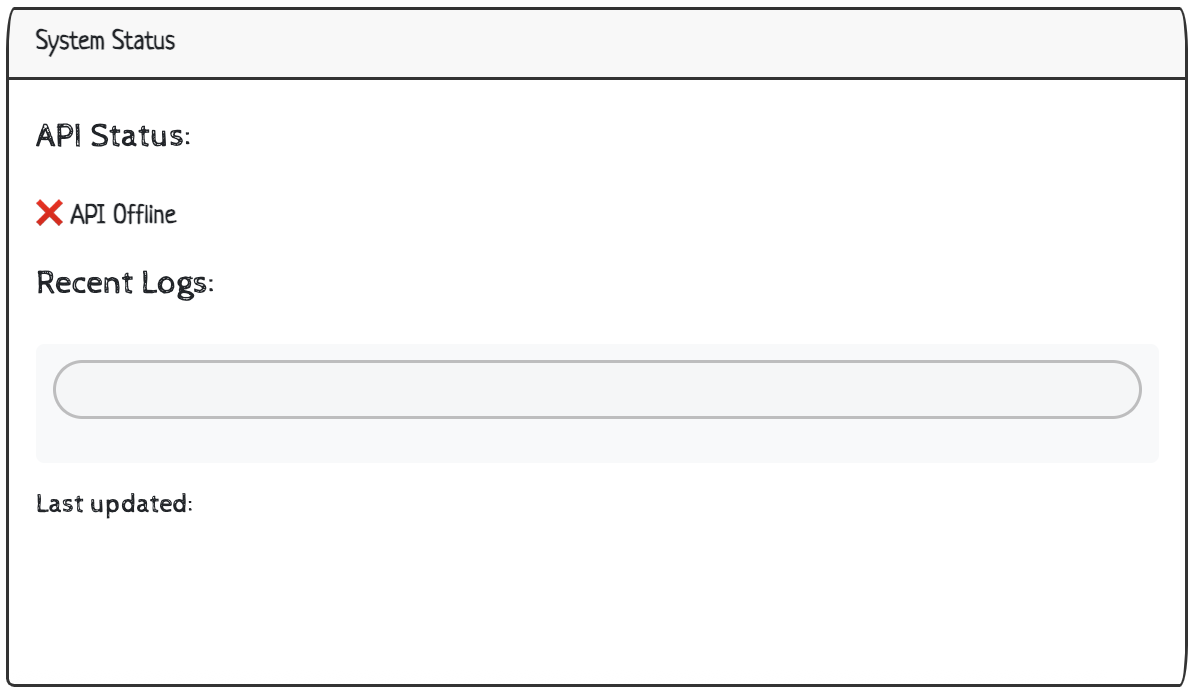
API Status
The status of the ping sent to the API can return one of three results:
✅ API Online(response = 200)⚠️ API Issues(non-200 status)❌ API Offline(non-response)
api_health <- reactive({
tryCatch({
logger::log_debug("Checking API health - Session: {session$token}")
response <- httr2::request("http://127.0.0.1:8080/ping") |>
httr2::req_timeout(5) |>
httr2::req_perform()
if (httr2::resp_status(response) == 200) {
logger::log_info("API health check successful - Session: {session$token}")
return("✅ API Online")
} else {
logger::log_warn("API health check returned non-200 status - Session: {session$token} - status: {httr2::resp_status(response)}")
return("⚠️ API Issues")
}
}, error = function(e) {
logger::log_error("API health check failed - Session: {session$token} - error: {conditionMessage(e)}")
return("❌ API Offline")
})
})- 1
-
Logs when health checks are initiated to track frequency and timing.
- 2
-
pingsent to API
- 3
-
Logs the external API is responding normally.
- 4
-
Logs to API degradation or partial failures that may impact user experience.
- 5
- Logs complete API connectivity failures that render the application non-functional.
The tryCatch() prevents the application from crashing when the external API is unreachable or returns unexpected responses. This ensures ‘graceful’ failures of our health check display.
When we initially launch, we see the offline status is accurate (the API isn’t running):
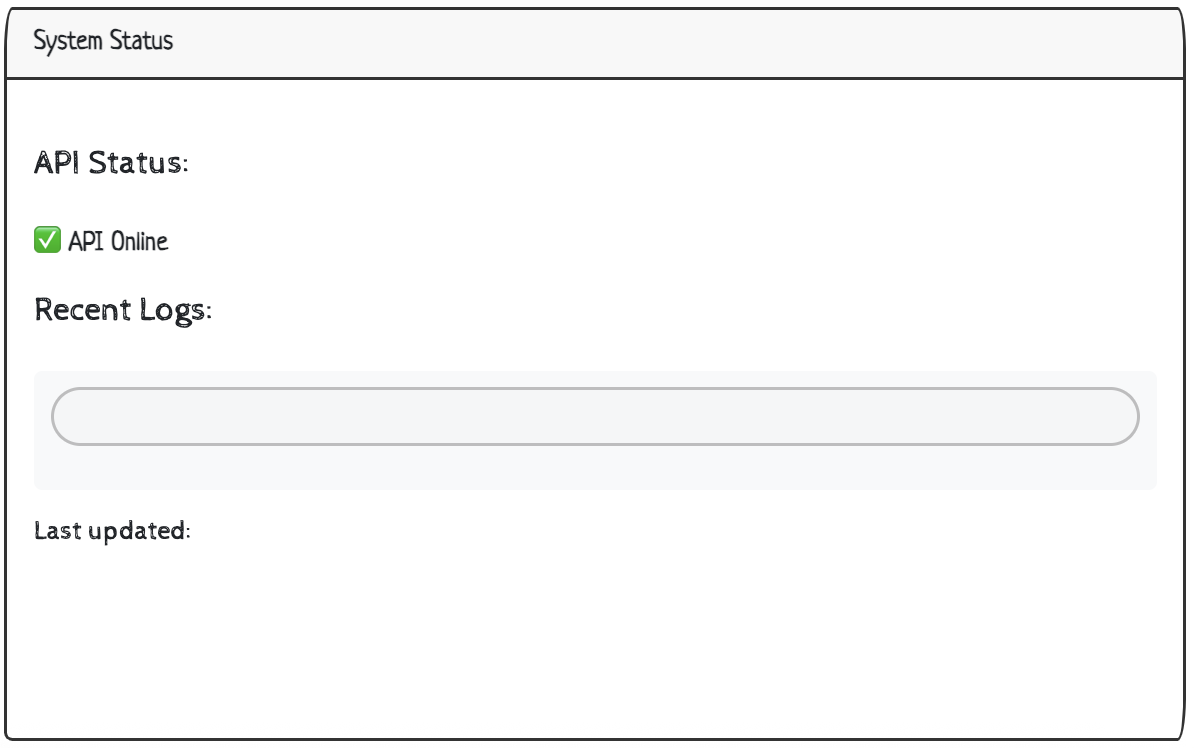
When we run the API, we can see the ping responds with an online status:
Recent Logs
All the events captured with logger::log_*() functions are written to the log file (shiny_log.log). To display the most recent logs in the UI, we can use Shiny’s reactiveFileReader() and configure it to poll our log file every 1 second (1000ms) for changes:
%%{init: {'theme': 'base', 'themeVariables': {'fontFamily': 'monospace'}}}%%

flowchart TD
     subgraph User["Log Generation"]
        Q("User<br>inputs")
        R("API<br>calls")
        S("System<br>events")
        T("<strong>logger::log_</strong>*<br>functions")
      end

    Q --> T
    R --> T
    S --> T
    T -- "<em>Written to</em>"--> A

     subgraph FileSys["File System"]
        A("File: <strong>shiny_app.log</strong>")
        A1("Modification<br>Time")
        A2("Log<br>Contents")
     end

    A --> A1 & A2
    A -."<em>changes trigger</em>".-> B

    subgraph ReactFile["Reactive File"]
        B("<strong>reactiveFileReader() </strong>")
        C{"Log file<br>exists?"}
        D("<strong>lines<br>last_mod<br>total_lines</strong>")
        E("<strong>lines</strong>:<strong>character(0)</strong><br><strong>last_mod</strong>:<strong>Sys.time()</strong><br><strong>total_lines</strong>:<strong>0</strong>")
    end

    B --"<em>checks every 1 second</em>"--> C
    C -- Yes (returns list)--> D
    C -- No (returns empty list)--> E


    classDef log fill:#5B8C5A,stroke:#000000,stroke-width:1px,color:#ffffff
    class A,B,Q,R,S log

    classDef outcome fill:#E8A33D,stroke:#000000,stroke-width:1px,color:#ffffff
    class D,E,A1,A2 outcome
    style T fill:#D2562B,stroke:#000000,stroke-width:1px,color:#ffffff
    style C fill:#D2562B,stroke:#000000,stroke-width:1px,color:#ffffff
    style User fill:#fbf7ec,stroke:#5B8C5A,color:#1B2A41
    style FileSys fill:#fbf7ec,stroke:#5B8C5A,color:#1B2A41
    style ReactFile fill:#fbf7ec,stroke:#2A6F77,color:#1B2A41
The reactive returned from reactiveFileReader() will contain a list with the log line (lines), the time this file was last modified (last_mod), and a count of the total number of lines in the log file (total_lines).
log_file_content <- reactiveFileReader(
intervalMillis = 1000,
session = session,
filePath = "shiny_app.log",
readFunc = function(filePath) {
if (file.exists(filePath)) {
lines <- readLines(filePath, warn = FALSE)
mod_time <- file.mtime(filePath)
list(
lines = lines,
last_mod = mod_time,
total_lines = length(lines)
)
} else {
list(
lines = character(0),
last_mod = Sys.time(),
total_lines = 0
)
}
}
)- 1
- Read all lines and get file modification time.
- 2
-
Return both content and timestamp.
- 3
- Return empty list.
To make this display more manageable, we’ll limit the number of extracted logs to the five most recent lines (unless there are less than five total lines in the log file). We’ll also format the logs to be displayed in the verbatimTextOutput() and include a message if the log file is empty.
%%{init: {'theme': 'base', 'themeVariables': {'fontFamily': 'monospace'}}}%%

flowchart TD
  A("<strong>reactiveFileReader()</strong> ")

 subgraph LogProc["Log Processing"]
        H("Reads <strong>shiny_app.log</strong>")
        I{"More than 5 lines in <strong>total_lines</strong>?"}
        J("Print last 5 lines")
        K("Print all lines")
        L("Format: <strong>paste(lines,</strong><br><strong>collapse = '\\n')</strong>")
        M("Return:<br><strong>'No logs available'</strong>")
  end

    A --> H
    H --> I
    I -- "<em>Yes</em" --> J
    I -- "<em>No</em>" --> K
    J --> L
    K --> L
    H -- "<em>No lines</em>"--> M

 subgraph UI["UI Rendering"]
     N("<strong>log_file_content()</strong>")
     subgraph P["Display in <strong>div</strong>"]
         O("<strong>verbatimTextOutput(<br>recent_logs)</strong>")
     end
  end

  L & M --> N
  N --> P

    style A fill:#5B8C5A,stroke:#000000,stroke-width:1px,color:#ffffff

    classDef log fill:#5B8C5A,stroke:#000000,stroke-width:1px,color:#ffffff
    class A log

    classDef outcome fill:#E8A33D,stroke:#000000,stroke-width:1px,color:#ffffff
    class O outcome
    style H fill:#D2562B,stroke:#000000,stroke-width:1px,color:#ffffff
    style I fill:#D2562B,stroke:#000000,stroke-width:1px,color:#ffffff
    style J fill:#1B2A41,stroke:#000000,stroke-width:1px,color:#ffffff
    style K fill:#1B2A41,stroke:#000000,stroke-width:1px,color:#ffffff
    style L fill:#2A6F77,stroke:#000000,stroke-width:1px,color:#ffffff
    style M fill:#2A6F77,stroke:#000000,stroke-width:1px,color:#ffffff
    style N fill:#2A6F77,stroke:#000000,stroke-width:1px,color:#ffffff
    style LogProc fill:#fbf7ec,stroke:#5B8C5A,color:#1B2A41
    style UI fill:#fbf7ec,stroke:#2A6F77,color:#1B2A41
    style P fill:#fbf7ec,stroke:#2A6F77,color:#1B2A41
output$recent_logs <- renderText({
log_data <- log_file_content()
if (length(log_data$lines) > 0) {
recent_lines <- if (log_data$total_lines > 5) {
tail(log_data$lines, 5)
} else {
log_data$lines
}
logger::log_debug("Updating recent logs display - Session: {session$token} - showing {length(recent_lines)} lines")
paste(recent_lines, collapse = "\n")
} else {
"No logs available"
}
})- 1
-
Get last 5 lines of log file or complete log file
- 2
-
Log that we’re updating the display (at
DEBUGlevel to avoid spam)
- 3
- Format the recent logs before displaying in the UI.
If the API is running, the log file will contain the status of the health check and the app start-up/initialization message:
INFO [2025-09-09 13:22:10] Shiny app started - Session: 8f018f03ac7f1339dc2f826077156264 - Host: localhost
INFO [2025-09-09 13:22:10] API health check successful - Session: 8f018f03ac7f1339dc2f826077156264
INFO [2025-09-09 13:27:40] Shiny application initialized - timestamp: 2025-09-09 13:27:40.00443 - r_version: R version 4.5.1 (2025-06-13)
INFO [2025-09-09 13:27:41] Shiny app started - Session: 40ba19c3b213c5aa6c8589dc15aa4bd8 - Host: localhost
INFO [2025-09-09 13:27:41] API health check successful - Session: 40ba19c3b213c5aa6c8589dc15aa4bd8
We can these logs show up in the UI:

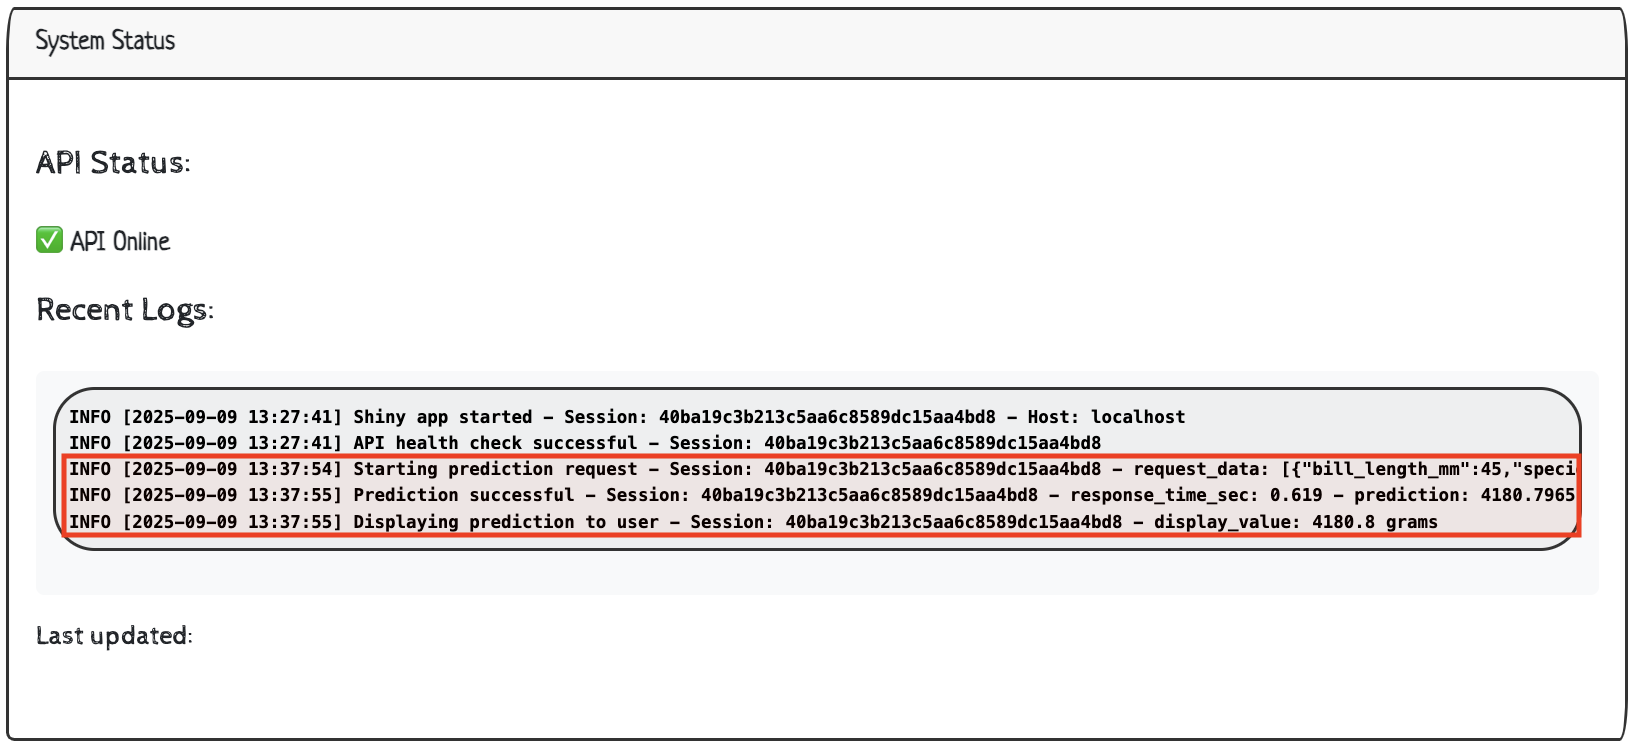
When a user clicks on Predict, the values are sent in a request to the API, a response is returned, and the log file is updated with:
INFO [2025-09-09 13:37:54] Starting prediction request - Session: 40ba19c3b213c5aa6c8589dc15aa4bd8 - request_data: {"bill_length_mm":45,"species":"Adelie","sex":"male"}
INFO [2025-09-09 13:37:55] Prediction successful - Session: 40ba19c3b213c5aa6c8589dc15aa4bd8 - response_time_sec: 0.619 - prediction: 4180.7965
INFO [2025-09-09 13:37:55] Displaying prediction to user - Session: 40ba19c3b213c5aa6c8589dc15aa4bd8 - display_value: 4180.8 grams
We can also see out UI updates with the recent logs:
Finally, we should see the log file included in our Shiny app directory:
app/
├── app.R
├── R.Rproj
├── README.md
├── renv
├── renv.lock
└── shiny_app.log
2 directories, 5 files- 1
- New log file!
Last updated
The final Last updated section includes the time and date the log_file_content() reactive was last updated.
output$log_timestamp <- renderText({
  log_data <- log_file_content()
  format(log_data$last_mod, "%Y-%m-%d %H:%M:%S")
})
Finishing touches
To finish off our app, we’ll include a README.md with instructions for launching the API and application together and capture dependencies with renv.
install.packages('renv')
renv::init()renv::snapshot()appender_tee()determines where the logs will be stored and “appends log messages to both console and a file.”↩︎“Throttling delays invalidation if the throttled reactive recently (within the time window) invalidated. New r invalidations do not reset the time window. This means that if invalidations continually come from r within the time window, the throttled reactive will invalidate regularly, at a rate equal to or slower than the time window. - see the
shiny::throttle()documentation for more info.”↩︎