The last chapter left one question open: how much of your money should go into each kind of index fund? That split is called your asset allocation. It’s how you divide your investments between stocks, bonds, and cash, and it does more to decide how your money grows (and how bumpy the ride feels) than which specific funds you pick.
You don’t have to get this perfect. You have to pick a split that makes sense for your age, write it down, and stick with it when the market gets scary.
Each of the three main types of investments (called asset classes) does a different job:
The tradeoff is simple: more stocks means more growth and more bumps; more bonds means fewer bumps and less growth. The Investing Basics chapter called this risk vs. return. Asset allocation is where you choose your spot on that line.
Your biggest advantage when you’re starting out is time. Money you invest in your twenties won’t be needed for 40 years or more, which is long enough to ride out several crashes. That’s why almost every expert agrees young investors should hold mostly stocks.
They don’t agree on how much is “mostly,” or on whether you need bonds at all.
John Bogle is linked to a well known rule of thumb: hold roughly your age in bonds (20% bonds at 20, 40% at 40). He called it a rough starting point, to be adjusted for your goals, your comfort with risk, and other income like Social Security 1. He later said younger investors could reasonably hold 80% to 85% stocks 2.
Ramit Sethi recommends 80% to 90% stocks and 10% to 20% bonds for people in their twenties and thirties, or a target date fund that picks the split for you 3.
JL Collins recommends 100% stocks while you’re building wealth, and adding bonds only when you’re close to living off your investments 4.
Ben Felix has discussed research by Scott Cederburg that goes further: across many countries and long time periods, a portfolio of 100% stocks spread across the US and the rest of the world did better over a lifetime than mixes with bonds, and ran out of money less often in retirement. Felix calls it “a super interesting finding,” but warns that the result is “sensitive to the assumptions” behind it 5.
Morgan Housel goes the other way. He keeps more cash than most advisors would recommend, because it lets him sleep at night and avoid selling in a panic. He calls this being reasonable rather than perfectly rational 6.
What they agree on: a young investor should hold mostly stocks, use low cost index funds, and choose a split they won’t abandon in a crash. The difference between 80% and 100% stocks matters much less than staying invested.
If you want a starting point, 80% to 90% stocks is a reasonable split for someone in their twenties, and it’s close to what a target date fund would give you. If you know you can watch your account drop by a third without selling, 100% stocks is a defensible choice.
The previous chapter covered the other part of the split: how much of your stock money goes into US companies vs. companies in the rest of the world. The experts disagree there too. Bogle and Collins kept most or all of it in the US; Felix and the Cederburg research favor spreading it across the world. A split anywhere from 60/40 to 80/20 (US/international) is common and reasonable. The Cederburg research Felix discusses goes further, with about a third in the US and two thirds abroad 7.
A target date fund is a single fund that holds US stocks, international stocks, and bonds, and picks the split for you. You choose the fund by the year you expect to retire (a “2070 fund,” for example), and it starts out mostly in stocks. As that year gets closer, the fund slowly moves money from stocks into bonds. That planned shift over time is called a glide path.
Target date funds solve the hardest problem in investing: doing nothing. You never have to rebalance or decide when to add bonds, and they’re often the default choice in a 401(k). Sethi recommends them for exactly that reason 8.
They have two downsides. First, check the expense ratio. Index based target date funds from big providers cost around 0.10% or less, but some 401(k) plans offer versions that charge much more. Second, they add bonds earlier than some research says you need to. The Cederburg study found that an all stock portfolio ran out of money less often in retirement than a typical target date fund 9. For most beginners, the simplicity is worth it.
A target date fund is designed to be your whole portfolio. If you add other funds next to it, you’ll change the split it was built to manage. Pick one target date fund or build your own split; don’t mix the two.
If you’d rather choose your own split, you only need three funds:
This is called the three fund portfolio, and it’s popular with the Bogleheads, a community of investors who follow Bogle’s ideas 10. Together, those three funds own nearly every public company in the world and a large share of the US bond market, for a fee of around 0.05%. You set the percentages once; for example, 60% US stocks, 30% international stocks, and 10% bonds. If you decide you don’t want bonds, drop the third fund.
JL Collins takes simplicity a step further. He recommends a single total US stock market fund while you’re building wealth, and adds a bond fund only when you’re close to living off your investments 11.
Your split won’t stay where you set it. If stocks have a great year, they’ll grow into a bigger share of your portfolio than you planned; after a crash, they’ll shrink into a smaller one. Rebalancing means moving money back to your target split.
You don’t have to watch it closely. Check once a year, and rebalance if any part has drifted more than about 5 percentage points from your target 12. The easiest way is to send new contributions to whatever is below its target, so you don’t have to sell anything. In a 401(k) or IRA, selling doesn’t trigger taxes, so you can also just move money between funds.
Rebalancing has a hidden benefit: it makes you buy stocks after they’ve fallen, which is the opposite of what fear tells you to do. The math section below shows how.
Asset allocation math is about two things: what a split does in a good year and a bad year, and how much to move when you rebalance.
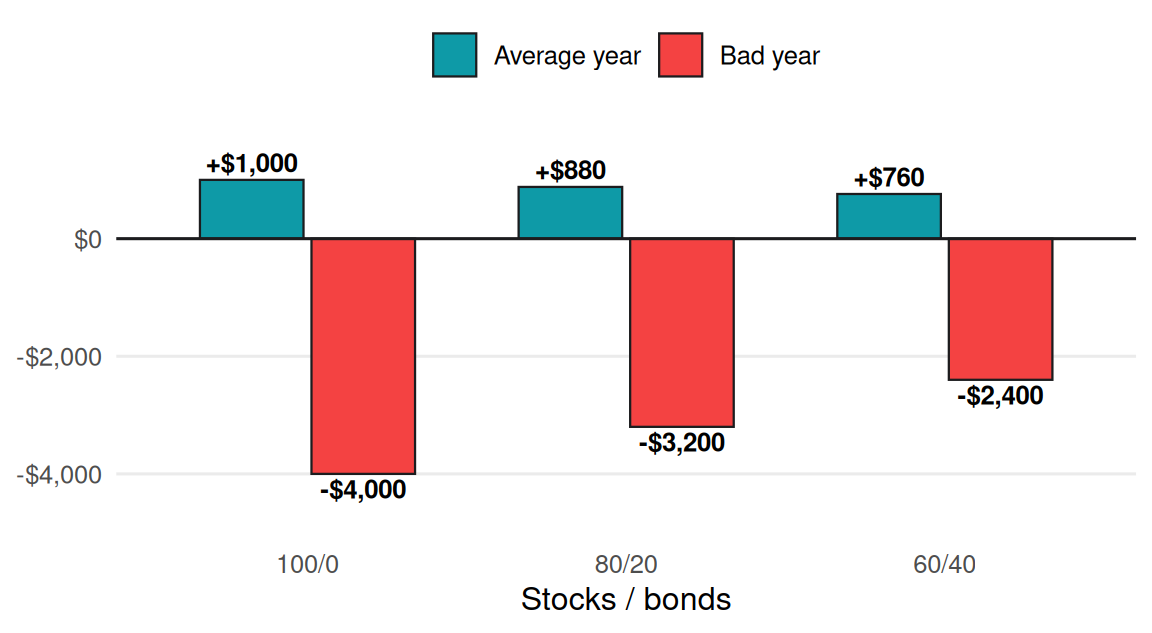
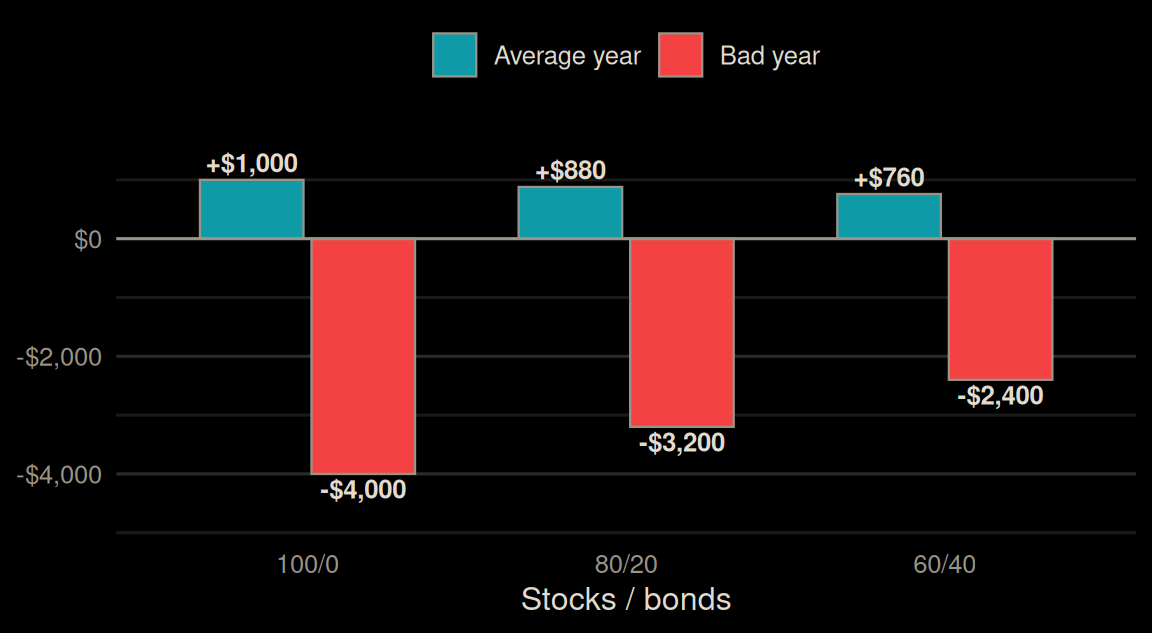
Imagine $10,000 split three different ways. For this example, assume stocks earn 10% in an average year and lose 40% in a bad year, and bonds earn 4% in an average year and break even in a bad year. These are round numbers for illustration, not predictions. For a real example, in 2008 the S&P 500 lost about 37% including dividends, while broad US investment grade bond indexes gained roughly 4% to 5% (First Trust).
Each bar is a weighted average: the stock return times the share in stocks, plus the bond return times the share in bonds. Adding bonds shrinks the blue bars a little and the red bars a lot.
Formula: Portfolio return = (Stock % × Stock return) + (Bond % × Bond return)
Example: An 80/20 split in a bad year: (0.80 × −40%) + (0.20 × 0%) = −32%, or −$3,200 on $10,000. In an average year: (0.80 × 10%) + (0.20 × 4%) = 8.8%, or +$880.
Check: a weighted average always lands between its parts: −32% sits between −40% and 0%, and 8.8% sits between 4% and 10%.
Assuming Stock % is in B2, Stock return is in C2, and Bond return is in D2:
=B2 * C2 + (1 - B2) * D2import polars as pl
def portfolio_return(stock_pct, stock_return, bond_return):
return stock_pct * stock_return + (1 - stock_pct) * bond_return
# 100/0, 80/20, and 60/40 in an average year and a bad year
pl.DataFrame({"stocks": [1.0, 0.8, 0.6]}).with_columns(
average=portfolio_return(pl.col("stocks"), 0.10, 0.04),
bad=portfolio_return(pl.col("stocks"), -0.40, 0.0),
)| stocks | average | bad |
|---|---|---|
| f64 | f64 | f64 |
| 1.0 | 0.1 | -0.4 |
| 0.8 | 0.088 | -0.32 |
| 0.6 | 0.076 | -0.24 |
import pandas as pd

def portfolio_return(stock_pct, stock_return, bond_return):
    return stock_pct * stock_return + (1 - stock_pct) * bond_return

# 100/0, 80/20, and 60/40 in an average year and a bad year
mix = pd.DataFrame({"stocks": [1.0, 0.8, 0.6]})
mix.assign(
    average=portfolio_return(mix["stocks"], 0.10, 0.04),
    bad=portfolio_return(mix["stocks"], -0.40, 0.0),
)
#>    stocks  average   bad
#> 0     1.0    0.100 -0.40
#> 1     0.8    0.088 -0.32
#> 2 0.6 0.076 -0.24portfolio_return <- function(stock_pct, stock_return, bond_return) {
stock_pct * stock_return + (1 - stock_pct) * bond_return
}
# 100/0, 80/20, and 60/40 in an average year and a bad year
splits <- c(1, 0.8, 0.6)
data.frame(
stocks = splits,
average = portfolio_return(splits, stock_return = 0.10, bond_return = 0.04),
bad = portfolio_return(splits, stock_return = -0.40, bond_return = 0)
)
#> # A tibble: 3 × 3
#> stocks average bad
#> <dbl> <dbl> <dbl>
#> 1 1 0.1 -0.4
#> 2 0.8 0.088 -0.32
#> 3 0.6 0.076 -0.24portfolio_return <- function(stock_pct, stock_return, bond_return) {
stock_pct * stock_return + (1 - stock_pct) * bond_return
}
# 100/0, 80/20, and 60/40 in an average year and a bad year
mix <- data.table::data.table(stocks = c(1, 0.8, 0.6))
mix[, `:=`(
average = portfolio_return(stocks, stock_return = 0.10, bond_return = 0.04),
bad = portfolio_return(stocks, stock_return = -0.40, bond_return = 0)
)]
mix[]
#> # A tibble: 3 × 3
#> stocks average bad
#> <dbl> <dbl> <dbl>
#> 1 1 0.1 -0.4
#> 2 0.8 0.088 -0.32
#> 3 0.6 0.076 -0.24Think of your portfolio as one bar split into stocks and bonds. Start with $10,000 at 80/20. Then stocks drop 30%. The bar gets shorter, and the stock part shrinks more than the bond part. Rebalancing moves just enough from bonds to stocks to get back to 80/20.
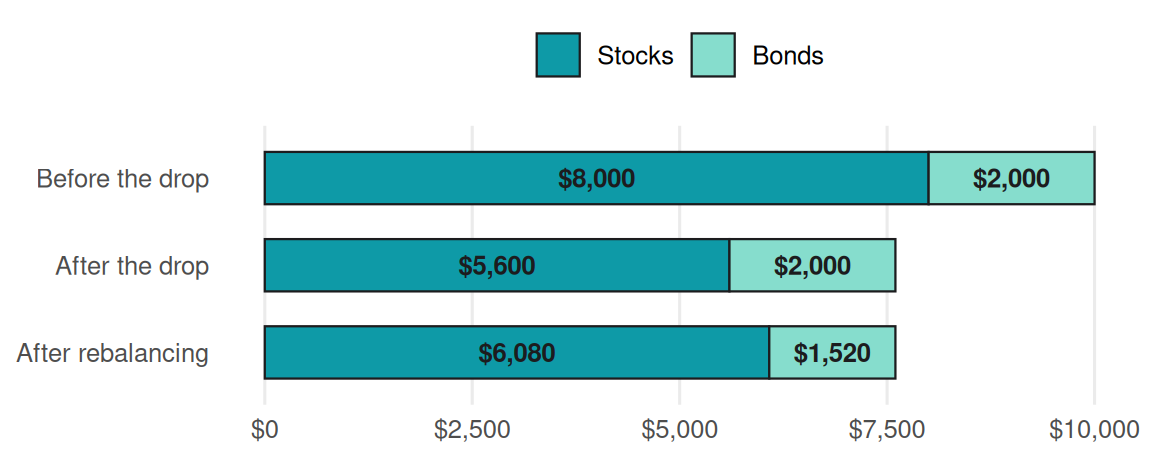
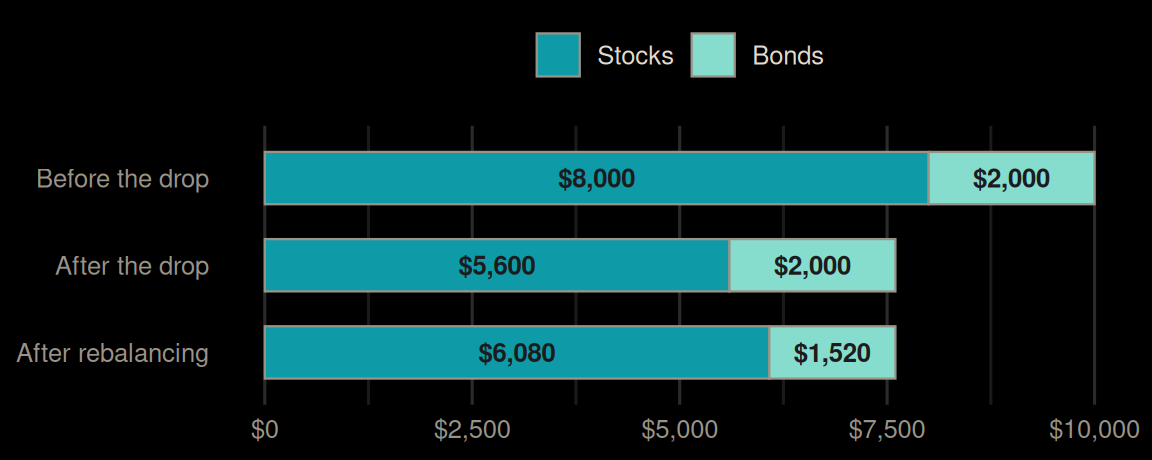
After the drop, the total is $7,600 and stocks are only about 74% of it. The target for stocks is 80% of the new total; the difference between that target and what you have is the amount to move.
Formula: Amount to move = (Target % × Total) − Current amount
Example: (0.80 × $7,600) − $5,600 = $480 moved from bonds into stocks. You’re buying stocks while they’re down, which is exactly what rebalancing is for.
Check: after the move you have $5,600 + $480 = $6,080 in stocks, and $6,080 ÷ $7,600 = 80%, back on target.
Assuming Target % is in B2, Stocks is in C2, and Bonds is in D2:
=B2 * (C2 + D2) - C2def rebalance_amount(target_pct, total, current_amount):
return target_pct * total - current_amount
# $5,600 in stocks and $2,000 in bonds after a 30% stock drop
rebalance_amount(target_pct=0.80, total=5600 + 2000, current_amount=5600)
#> 480.0rebalance_amount <- function(target_pct, total, current_amount) {
target_pct * total - current_amount
}
# $5,600 in stocks and $2,000 in bonds after a 30% stock drop
rebalance_amount(target_pct = 0.80, total = 5600 + 2000, current_amount = 5600)
#> [1] 480A positive answer means buy that much of the asset; a negative answer means sell that much.
This chapter closes the investing part of the book. The next part turns to the two things that quietly take money out of every plan: taxes and the risks you insure against.
Common Sense on Mutual Funds (10th Anniversary ed.). Bogle, John C. 2010.↩︎
How Many Index Funds Should You Own?. The Motley Fool. 2014.↩︎
Asset Allocation by Age (+ Specific Recommendations). Sethi, Ramit. 2025.↩︎
The Simple Path to Wealth. Collins, J. L. 2016.↩︎
Episode 350: Scott Cederburg: A Critical Assessment of Lifecycle Investment Advice. Felix, Ben and Cederburg, Scott. 2025.↩︎
The Psychology of Money: Timeless Lessons on Wealth, Greed, and Happiness. Housel, Morgan. 2020. Chapter 20.↩︎
Episode 350: Scott Cederburg: A Critical Assessment of Lifecycle Investment Advice. Felix, Ben and Cederburg, Scott. 2025.↩︎
Asset Allocation by Age (+ Specific Recommendations). Sethi, Ramit. 2025.↩︎
Episode 350: Scott Cederburg: A Critical Assessment of Lifecycle Investment Advice. Felix, Ben and Cederburg, Scott. 2025.↩︎
The Bogleheads’ Guide to the Three-Fund Portfolio. Larimore, Taylor. 2018.↩︎
The Simple Path to Wealth. Collins, J. L. 2016.↩︎
Asset Allocation by Age (+ Specific Recommendations). Sethi, Ramit. 2025.↩︎