6 Savings Strategies
How much should you save? The honest answer is: as much as you can sustain. This chapter covers common targets and how to choose one that matches your goals.
- Pay-yourself-first
- Sinking funds for known future expenses
- The savings rate as the single most important number
6.1 Math for Saving
Your Savings Rate (Your Most Important Metric)
Ben Felix and John Bogle both stress this above all else.
Formula: (Savings + Investments) ÷ Gross Income
Example: You save $500 and invest $700 from a $5,000 gross income. → 1,200 ÷ 5,000 = 24% savings rate.
Benchmarks to know:
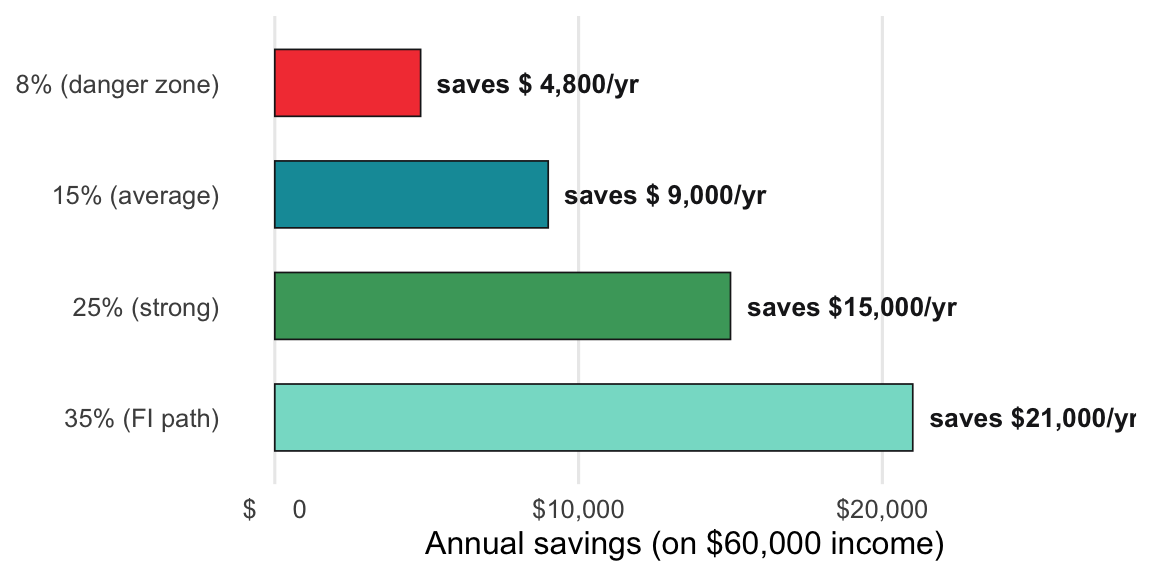
- <10%: Danger zone; build aggressively
- 10-20%: Average; you’ll retire eventually
- 20-30%: Strong; you’re building real wealth
- 30%+: Path to early financial independence
Your savings rate is the single lever that determines how fast wealth accumulates. The chart below shows how dramatically the annual savings amount changes as the rate moves from the danger zone to the financial independence path — all on the same $60,000 income.
The formula just names the savings slice as a fraction of the whole income bar.
Formula: Savings Rate = (Income − Spending) ÷ Income × 100
Example: you take home $5,000 and spend $3,500. → (5,000 − 3,500) ÷ 5,000 = 30%.
show/hide
savings_rate <- function(income, spending) {
  ((income - spending) / income) * 100
}

# $5,000 take-home, $3,500 spent
savings_rate(income = 5000, spending = 3500)
#> [1] 30
show/hide
def savings_rate(income, spending):
    return ((income - spending) / income) * 100

# $5,000 take-home, $3,500 spent
savings_rate(income=5000, spending=3500)
#> 30.0