%%{init: {'theme': 'neutral', 'themeVariables': { 'fontFamily': 'monospace', "fontSize":"14px", 'ganttNumberSectionStyles': 4}}}%%

flowchart LR

    Expenses(["Monthly<br>Expenses"])

    subgraph Fixed["<strong>FIXED EXPENSES</strong>"]
        Rent("Rent/Mortgage")
        Insurance("Insurance<br>Premiums")
        Subs("Subscriptions")
        Loans("Loan<br>Payments")
    end

    subgraph Variable["<strong>VARIABLE EXPENSES</strong>"]
        Groceries("Groceries")
        Utilities("Utilities")
        Gas("Gas/Transport")
        Dining("Dining<br>Out")
    end

    subgraph Periodic["<strong>PERIODIC EXPENSES</strong>"]
        Taxes("Property<br>Taxes")
        CarMaint("Car<br>Maintenance")
        Gifts("Gifts/Holidays")
        Medical("Medical Costs")
    end

    Expenses --> Fixed
    Expenses --> Variable
    Expenses --> Periodic

    style Expenses fill:#48a56a,color:#F5F2E8,stroke:#1C1C1E,stroke-width:2px

    style Fixed fill:#0e9aa7,color:#F5F2E8,stroke:#1C1C1E,stroke-width:2px
    style Rent fill:#86ddcd,color:#1C1C1E,stroke:#1C1C1E,stroke-width:2px
    style Insurance fill:#86ddcd,color:#1C1C1E,stroke:#1C1C1E,stroke-width:2px
    style Subs fill:#86ddcd,color:#1C1C1E,stroke:#1C1C1E,stroke-width:2px
    style Loans fill:#86ddcd,color:#1C1C1E,stroke:#1C1C1E,stroke-width:2px

    style Variable fill:#F5F2E8,color:#1C1C1E,stroke:#1C1C1E,stroke-width:2px
    style Groceries fill:#F5F2E8,color:#1C1C1E,stroke:#1C1C1E,stroke-width:2px
    style Utilities fill:#F5F2E8,color:#1C1C1E,stroke:#1C1C1E,stroke-width:2px
    style Gas fill:#F5F2E8,color:#1C1C1E,stroke:#1C1C1E,stroke-width:2px
    style Dining fill:#F5F2E8,color:#1C1C1E,stroke:#1C1C1E,stroke-width:2px

    style Periodic fill:#f44242,color:#F5F2E8,stroke:#1C1C1E,stroke-width:2px
    style Taxes fill:#f44242,color:#F5F2E8,stroke:#1C1C1E,stroke-width:2px
    style CarMaint fill:#f44242,color:#F5F2E8,stroke:#1C1C1E,stroke-width:2px
    style Gifts fill:#f44242,color:#F5F2E8,stroke:#1C1C1E,stroke-width:2px
    style Medical fill:#f44242,color:#F5F2E8,stroke:#1C1C1E,stroke-width:2px
3 Budgeting
Most people hate budgeting because they’re approaching it with some bad assumptions. Traditional budgets typically fail because they assume humans will robotically track every penny and restrict every joy, all with a kind of mindless automation. But a good budget shouldn’t make you feel constrained; it should make you feel intentional about how you allocate your financial resources.1
3.1 The Budget Mindset Shift
A good budget builds in flexibility, not rigidity. When you’re just getting started, budgeting can be overwhelming.
“A budget tells your money where to go instead of wondering where it went.” - Ramit Sethi
Just to be clear: building a budget (especially the first time) is time-consuming. As with most time-consuming tasks, you might find yourself wondering if you really need a budget. Trust me—you do. Everyone does. Reframe the following thoughts that might interfere with your budgeting practice:
| Thought | Reframe as |
|---|---|
| I have to spend a [relatively large amount] on [thing(s) I need]. | My needs cost [amount]. |
| I can only spend [relatively small amount] on [thing(s) I really want]. | My wants cost [amount]. |
| I spent [unexpectedly large amount] on [thing(s) I really want]. | I chose to spend more on my wants this month, so I need to adjust my other categories. |
| I spent [unexpectedly large amount] on [thing(s) I don’t really need or want]?!? | I need to adjust my other categories and figure out how to avoid this spending in the future. |
Morgan Housel’s insight is powerful here: “room for error is the most underrated financial concept.”
3.2 Expense Categories
The first skill in budgeting is correctly categorizing your money. Most people lump everything together and then get overwhelmed by how to allocate or account for their spending. Generally, expenses can all fit into one of three categories:
| Category | Definition | Strategy |
|---|---|---|
| Fixed | Costs that remain the same each month, such as rent, mortgage payments, or subscription services. | Lock these in and forget them (minimize them once, then automate). Biggest leverage point: housing. |
| Variable | Costs that change from month to month, such as groceries, utilities, and entertainment. | This is the category where most budgeting efforts fail. Use categories with limits, not line-by-line tracking. |
| Periodic | Costs that occur less frequently than monthly, such as annual insurance premiums, holiday gifts, or car maintenance. | These are silent budget killers. Set aside 1/12 of the annual cost for these each month. |
How to approach expense categories
The math is the same, but the psychology differs. Fixed expenses reward ruthlessness—John Bogle’s principle of low-cost simplicity2 applies here. Lock in the lowest rate possible (usually your housing cost, which Brian Preston prioritizes early in Section 3.5 below), then automate and stop thinking about it. This creates room for error elsewhere, as Morgan Housel emphasizes: the less mental energy you waste on fixed costs, the more cushion you have to recover from unexpected swings.
Variable expenses demand a different discipline. Ramit Sethi’s Conscious Spending Plan3 teaches us that guilt-free spending on categories works better than line-by-line scrutiny. Instead of tracking every grocery receipt, set a monthly limit for groceries and let yourself spend freely within it. This is evidence-based: Ben Felix’s research shows that behavioral compliance matters more than perfect optimization.4
Periodic expenses are the outliers. Because they’re lumpy and personal (one person budgets for pet care, another for annual car maintenance) you can’t borrow someone else’s number. The 1/12 rule (setting aside one-twelfth of the annual cost each month) transforms an invisible crisis into visible planning.
Example periodic expense: car insurance
If your car insurance is $1,200/year, don’t get blindsided every six months. Save $100/month into a “Car Insurance” sub-account. When the bill arrives, the money is already there. Repeat for every periodic expense:
- Christmas/gifts: $600/year → $50/month
- Car maintenance: $1,200/year → $100/month
- Annual vacation: $2,400/year → $200/month
This single technique eliminates 80% of budget emergencies.
3.3 Types of Budgets
Two dominant frameworks exist: zero-based and percentage. Either one will work; just pick the one that matches your personality. Zero-based budgets offer tight control and are detail-oriented, making them ideal for anyone rebuilding from debt or with irregular income. Percentage budgets are for big-picture thinkers, stable income earners, and people who hate detailed tracking.
Zero-Based Budgeting
Every dollar gets a job. Income minus all allocations equals zero. Assume you have a monthly income of $5000:
| Category | Amount |
|---|---|
| Rent | $1,500 |
| Groceries | $500 |
| Transport | $300 |
| Investments | $1,000 |
| Savings | $500 |
| Fun Money | $700 |
| Other | $500 |
| Total | $5,000 |
| Remaining | $0 |
Zero-based budgets provide maximum awareness, make every dollar spent/saved/invested intentional, and immediately expose leaks. However, these are high-maintenance, can feel a little restrictive, and require monthly re-budgeting.
Percentage-Based Budgeting
Allocate by percentages, not dollars. This is the foundation of Sethi’s Conscious Spending Plan5 and another popular framework (50/30/20).
| Bucket | Conscious Spending Plan (Sethi) | 50/30/20 Rule |
|---|---|---|
| Fixed Costs | 50–60% | 50% Needs |
| Investments | 10%+ | 20% Savings/Debt |
| Savings Goals | 5–10% | (combined above) |
| Guilt-Free Spending | 20–35% | 30% Wants |
Percentages are great because they’re the proportion of your earnings assigned to each category, which means they scale to any income and, after you’ve categorized your expenses, they are low maintenance. However, they are also less granular, can mask overspending in certain categories, and require you to be brutally honest about the category boundaries.
Which Should You Choose?
%%{init: {'theme': 'neutral', 'themeVariables': { 'fontFamily': 'monospace', "fontSize":"14px", 'ganttNumberSectionStyles': 4}}}%%

flowchart TD
    Choose(["I Need<br>A Budget"]) --> Question1{"In Debt or<br/>Just Starting?"}
    Question1 -->|Yes| ZeroBased("Zero-Based<br/>for 6-12 months")
    Question1 -->|No| Question2{"Love Spreadsheets<br/>& Details?"}
    Question2 -->|Yes| Hybrid["Hybrid Approach"]
    Question2 -->|No| Percentage["Percentage-Based<br/>Conscious Spending"]
    ZeroBased --> Eventually["Graduate to Percentage<br/>Once Stable"]


    style Choose fill:#48a56a,color:#F5F2E8,stroke:#1C1C1E,stroke-width:2px
    style Question1 fill:#f0cfcf,color:#1C1C1E,stroke:#1C1C1E,stroke-width:2px
    style Question2 fill:#f0cfcf,color:#1C1C1E,stroke:#1C1C1E,stroke-width:2px
    style ZeroBased fill:#0e9aa7,color:#F5F2E8,stroke:#1C1C1E,stroke-width:2px
    style Hybrid fill:#86ddcd,color:#1C1C1E,stroke:#1C1C1E,stroke-width:2px
    style Percentage fill:#86ddcd,color:#1C1C1E,stroke:#1C1C1E,stroke-width:2px
    style Eventually fill:#86ddcd,color:#1C1C1E,stroke:#1C1C1E,stroke-width:2px
3.4 Build a Budgeting Tool
Applications like Microsoft Excel or Google Sheets offer tools and templates to customize each sheet/tab to fit your needs (search for “budget template”). Most personal finance blogs also offer a free downloadable classic envelope spreadsheet. For hands-on work with a real bank export, see Tracking Spending.
Using Spreadsheets
The bank_statement dataset introduced in Tracking Spending is the foundation for the examples that follow. A well-structured spreadsheet maps those transactions into tabs that mirror your budget categories:
%%{init: {'theme': 'neutral', 'themeVariables': { 'fontFamily': 'monospace', "fontSize":"14px", 'ganttNumberSectionStyles': 4}}}%%

flowchart LR
    Spreadsheet(["Budget<br>Spreadsheet"]) --> Tab1[Tab 1: Income]
    Spreadsheet --> Tab2[Tab 2: Fixed Expenses]
    Spreadsheet --> Tab3[Tab 3: Variable Expenses]
    Spreadsheet --> Tab4[Tab 4: Sinking Funds]
    Spreadsheet --> Tab5[Tab 5: Net Worth Tracker]
    Spreadsheet --> Tab6[Tab 6: Summary Dashboard]

    Tab6 --> Metrics("Key Metrics:<br/>Savings Rate<br/>Fixed Cost %<br/>Monthly Cash Flow")
    style Spreadsheet fill:#48a56a,color:#F5F2E8,stroke:#1C1C1E,stroke-width:2px
    style Tab1 fill:#0e9aa7,color:#F5F2E8,stroke:#1C1C1E,stroke-width:2px
    style Tab2 fill:#0e9aa7,color:#F5F2E8,stroke:#1C1C1E,stroke-width:2px
    style Tab3 fill:#0e9aa7,color:#F5F2E8,stroke:#1C1C1E,stroke-width:2px
    style Tab4 fill:#0e9aa7,color:#F5F2E8,stroke:#1C1C1E,stroke-width:2px
    style Tab5 fill:#0e9aa7,color:#F5F2E8,stroke:#1C1C1E,stroke-width:2px
    style Tab6 fill:#0e9aa7,color:#F5F2E8,stroke:#1C1C1E,stroke-width:2px
    style Metrics fill:#86ddcd,color:#1C1C1E,stroke:#1C1C1E,stroke-width:2px
What Actually Matters
Don’t overthink this. The best budgeting tool is the one you’ll actually use.
Features that matter:
- Automatic transaction imports (saves hours per month)
- Easy categorization (you’ll do this weekly)
- A clear summary view (your dashboard)
- Goal tracking (motivation matters)
Features that don’t matter as much: fancy graphs, AI insights, social features. Substance over style.
3.5 The Financial Order of Operations
Once you know your income, categorized your expenses, and picked a budgeting framework, the next question is: where should the leftover money actually go? Brian Preston (The Money Guy Show) answers this with the Financial Order of Operations (FOO) — a fixed sequence of nine steps, each one funded before moving to the next.6
| Step | Priority | Why it comes first |
|---|---|---|
| 1 | Deductibles covered | Cash on hand for your insurance deductibles avoids new debt from a routine claim. |
| 2 | Employer match | Free money from a 401(k)/403(b) match beats any other use of the next dollar. |
| 3 | High-interest debt | Toxic-rate debt compounds faster than any investment; see Managing Debt. |
| 4 | Emergency reserves | 3–6 months of essential expenses in cash; see Emergency Fund. |
| 5 | Roth IRA / HSA | Tax-free growth, funded while your income still qualifies. |
| 6 | Max-out retirement | Push tax-advantaged retirement accounts to their annual limits. |
| 7 | Hyperaccumulation | Taxable brokerage investing once retirement accounts are maxed. |
| 8 | Prepaid future expenses | Kids’ education, a down payment, or other planned large costs. |
| 9 | Low-interest debt | Extra payments on mortgages, once everything above is funded. |
The FOO doesn’t replace your budget; it tells you what to do with the money your budget frees up, one step at a time. Steps 3 and 4 — high-interest debt and emergency reserves — are covered in depth in the next two chapters, and always come before anything else on this list beyond the employer match.
3.6 Budgeting Math
Here’s the secret most personal finance content avoids: budgeting requires only middle-school math. Each calculation below pairs a visual with a formula and code so the idea, the rule, and the implementation are always together.
Percentages (Your Most-Used Skill)
Think of your monthly income as a single horizontal bar. Every category of spending is a labeled slice of that bar. Asking “what percentage is rent?” is just asking: how wide is the rent slice compared to the whole bar?
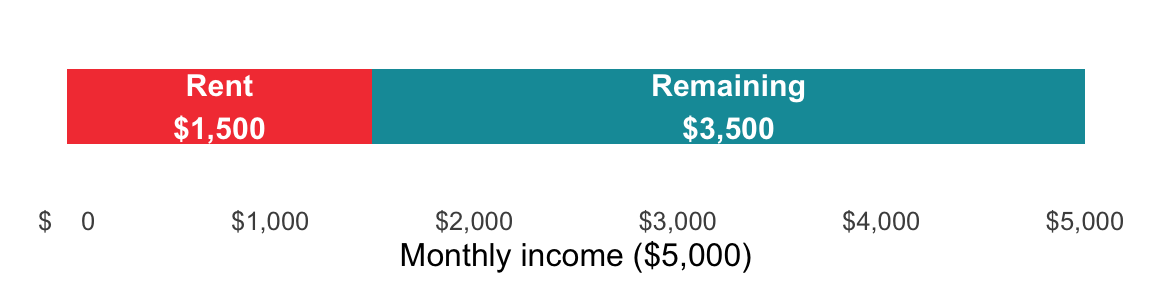
The formula follows directly from the bar: divide the slice width by the total bar width, then multiply by 100 to express it as a percentage.
Formula: (Expense ÷ Income) × 100
Example: Rent is $1,500, income is $5,000. → (1,500 ÷ 5,000) × 100 = 30% of income on rent.
Practice until you can do this in your head for the big categories.
NoteR vs Python: function bodies and return values
Two more syntax differences become visible the moment you write a function with a body.
Code block structure
R wraps the body in curly braces {}. Indentation is purely stylistic.
Python uses a colon and an indented body. Indentation is part of the syntax (inconsistent indentation raises IndentationError).
percent_of_income <- function(expense, income) {
  (expense / income) * 100
}
def percent_of_income(expense, income):
return (expense / income) * 100Return values
R automatically returns the last evaluated expression. The return() function is optional.
Python requires an explicit return statement; otherwise the function returns None.
double_fun <- function(x) x * 2def double_fun(x):
return x * 2percent_of_income <- function(expense, income) {
(expense / income) * 100
}Rent of $1,500 against $5,000 take-home pay
percent_of_income(expense = 1500, income = 5000)
#> [1] 30
def percent_of_income(expense, income):
return (expense / income) * 100Rent of $1,500 against $5,000 take-home pay
percent_of_income(expense=1500, income=5000)
#> 30.0
Assuming Expense is in cell B2 and Income is in cell C2:
=(B2 / C2) * 100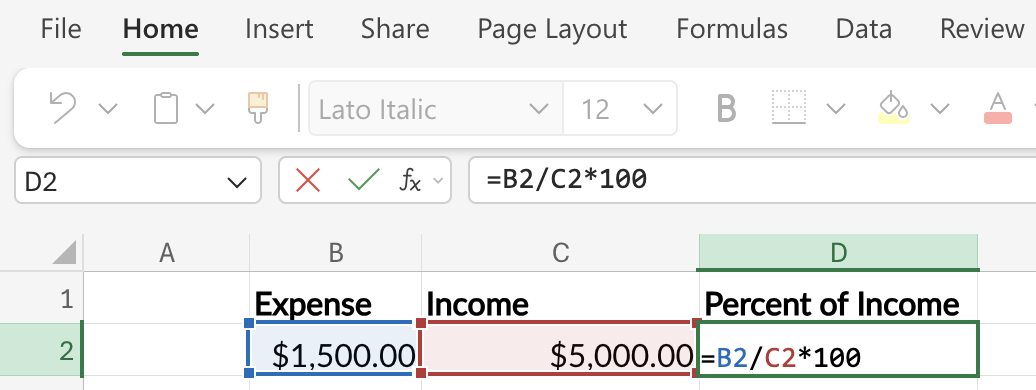
Or, more simply, enter =B2 / C2 and format the cell as a Percentage using the button in the toolbar.
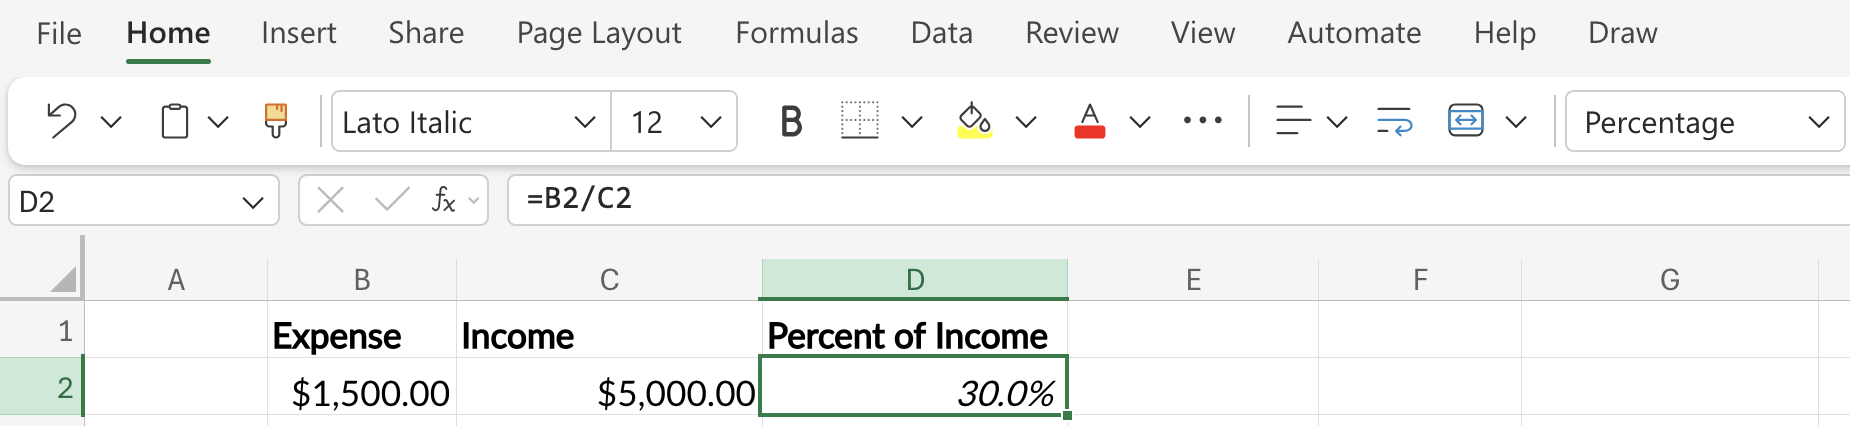
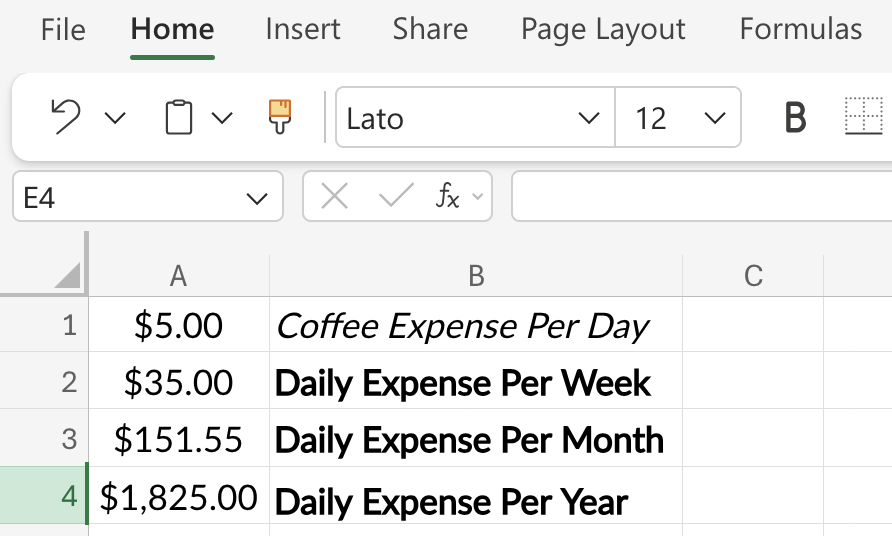
Annualizing and Monthly-izing
A $5 daily coffee doesn’t feel expensive. The chart below makes the annual version visible — the same habit at four different time scales.
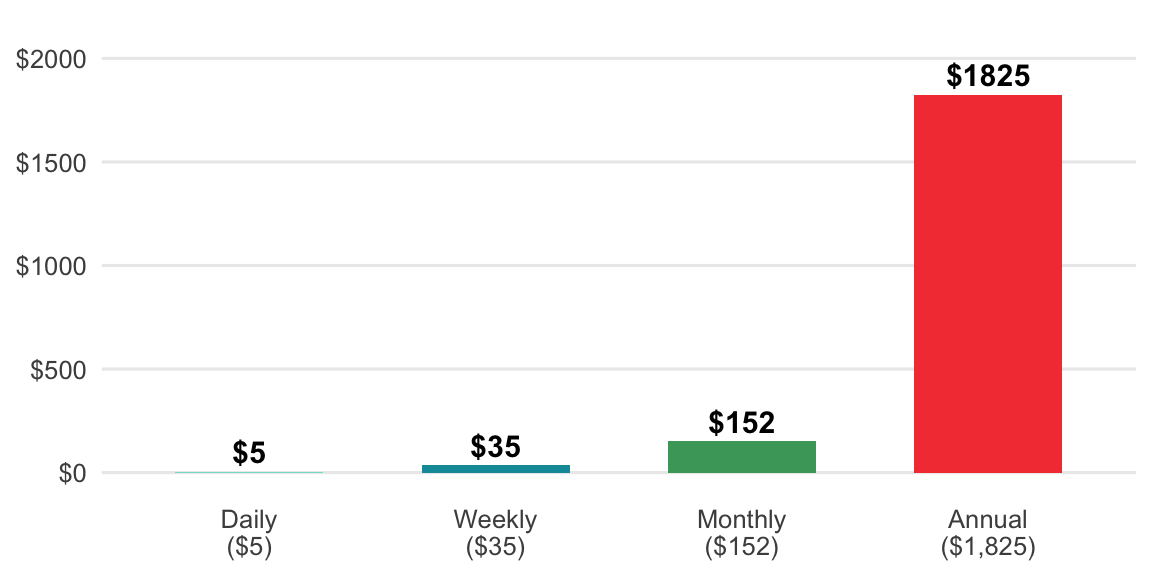
Each bar is the previous bar scaled by the number of periods it contains. The annual bar is 365× the daily bar; the monthly bar is ≈ 4.33× the weekly bar. Those multipliers are the formula.
Daily habit → Weekly: Multiply by 7
Weekly → Monthly: Multiply by 4.33 (not 4)
Monthly → Annual: Multiply by 12
Or you can directly convert a daily habit into the total cost per year:
Daily habit → Annual: Multiply by 365
See how much an annual subscription is costing per month:
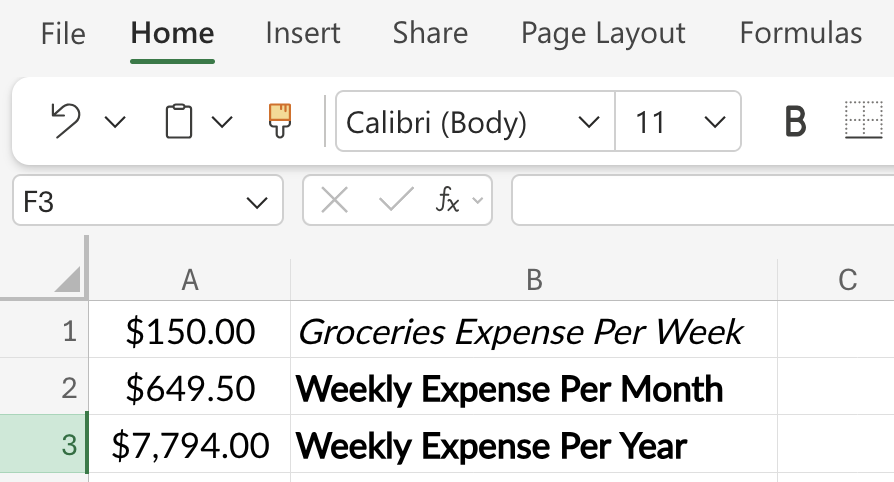
Annual → Monthly: Divide by 12
Example: A $5 daily coffee → $5 × 365 = $1,825/year. Suddenly it’s a real number you can evaluate.
to_annual <- function(amount, period = c("daily", "weekly", "monthly")) {
  period  <- match.arg(period)
  factors <- c(daily = 365, weekly = 52, monthly = 12)
  amount * factors[[period]]
}
to_monthly <- function(amount, period = c("daily", "weekly", "annual")) {
period <- match.arg(period)
factors <- c(daily = 30.44, weekly = 4.33, annual = 1 / 12)
amount * factors[[period]]
}$5/day coffee over the course of a year:
to_annual(amount = 5, period = "daily")
#> [1] 1825
$150 per week on groceries over the course of a month.
to_monthly(amount = 150, period = "weekly")
#> [1] 649.5
def to_annual(amount, period="daily"):
factors = {"daily": 365, "weekly": 52, "monthly": 12}
return amount * factors[period]def to_monthly(amount, period="daily"):
factors = {"daily": 30.44, "weekly": 4.33, "annual": 1 / 12}
return amount * factors[period]$5/day coffee over the course of a year:
print(to_annual(amount=5,period="daily"))
#> 1825
$150 per week on groceries over the course of a month.
print(to_monthly(amount=150,period="weekly"))
#> 649.5
Let’s start with the daily value in cell A1, then convert it to the cost per week in cell A2:
=A1 * 7Next we can convert the week to the monthly cost in cell A3:
=A2 * 4.33Finally, we get the annual cost in cell A4:
=A1 * 365Format cells A1 - A4 as Currency or Accounting.
To convert a weekly value in cell A1 to a monthly value, place the following formula in cell A2:
=A1 * 4.33To convert the monthly cost to an annual cost, enter the following in cell A3:
=A2 * 12Format cells A1 - A3 as Currency or Accounting.
Opportunity Cost Math
This is Felix’s signature framework. Every dollar spent isn’t just that dollar; it’s what that dollar could have become.
The chart below shows what happens when you choose the used car ($15,000) over the new one ($40,000) and invest the $25,000 difference at 7% per year. Each bar is the previous one grown by one year’s return.
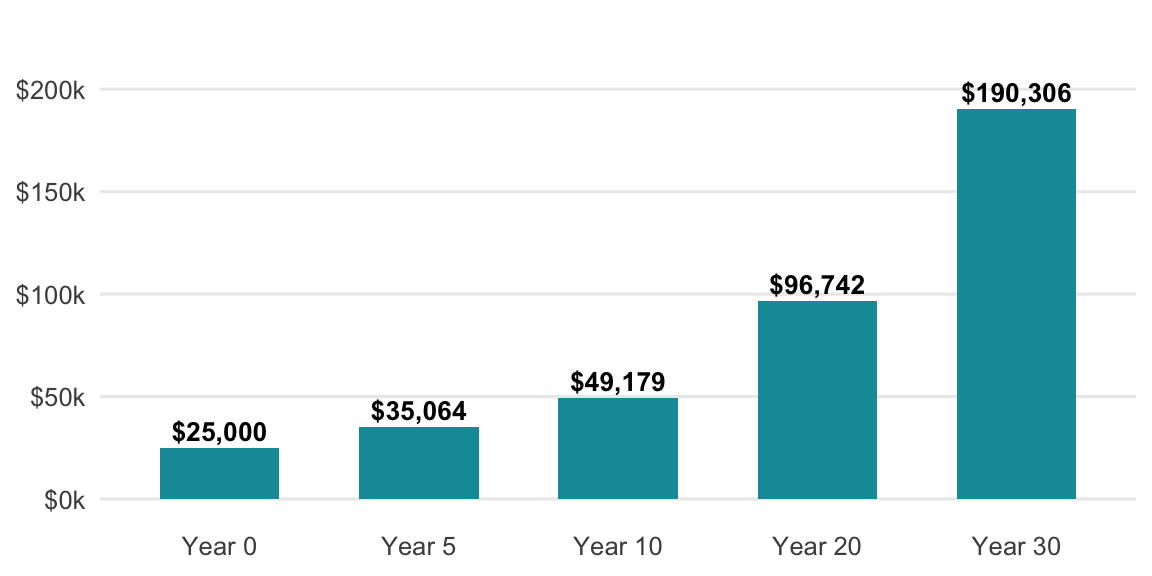
Each bar is the previous one multiplied by (1 + 0.07). After n multiplications, the pattern becomes the formula.
Formula: amount × (1 + r)^n
Example: $25,000 × (1.07)^30 = ~$190,000.
Below is an opportunity cost function that takes the dollar amount, the rate of return, over a proposed number of years
opportunity_cost <- function(amount, rate, years) {
  amount * (1 + rate)^years
}
$25,000 gap between two car choices, invested at 7% for 30 years
opportunity_cost(amount = 25000, rate = 0.07, years = 30)
#> [1] 190306.4
Below is an opportunity cost function that takes the dollar amount, the rate of return, over a proposed number of years
def opportunity_cost(amount, rate, years):
    return amount * (1 + rate) ** years
$25,000 gap between two car choices, invested at 7% for 30 years
opportunity_cost(amount=25000, rate=0.07, years=30)
#> 190306.37606655105
Assuming the initial amount is in cell A2, the annual rate (as a decimal, e.g., 0.07) is in B2, and the number of years is in C2:
=A2*(1+B2)^C2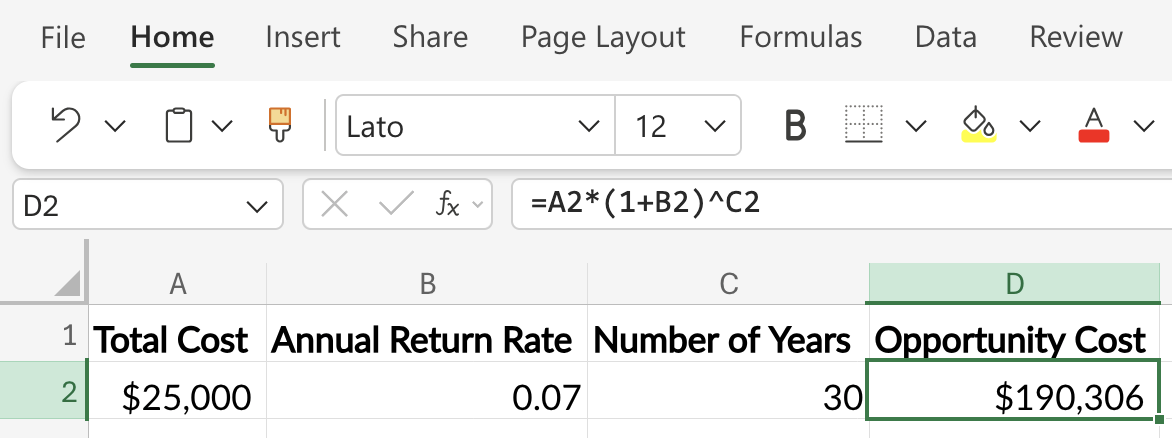
That’s not a car payment difference; that’s a retirement chapter.
Break-Even and Payback Calculations
Useful for evaluating subscriptions, refinances, and big purchases.
Each month, the cumulative savings bar grows by the monthly savings amount. Break-even is the first month that bar meets the upfront cost line.
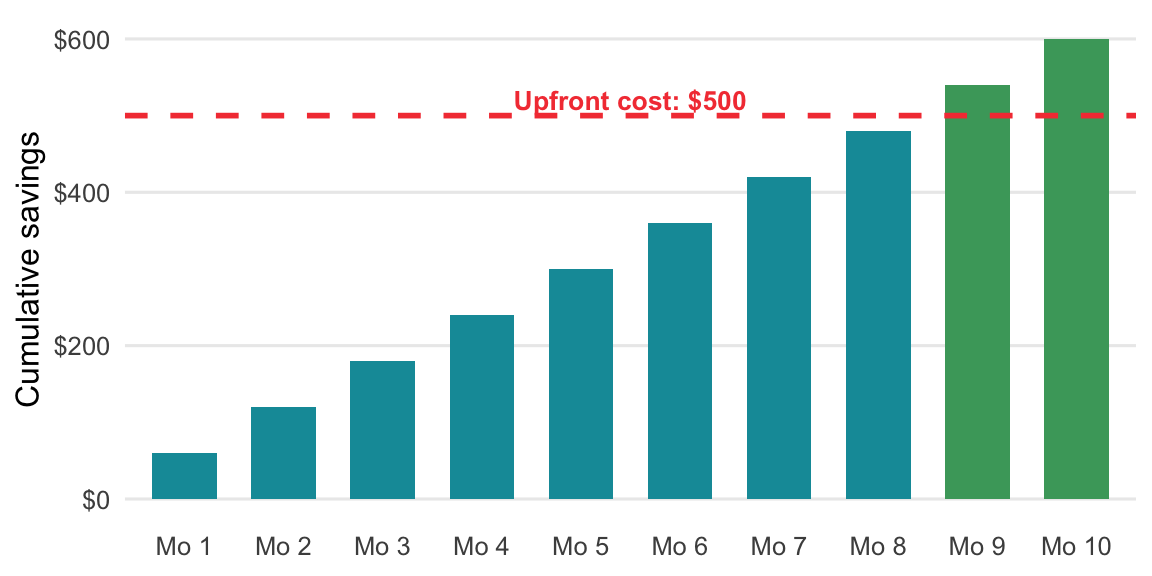
The formula names the crossover point: the month when cumulative savings first equals the upfront cost.
Formula: Upfront cost ÷ Monthly savings = months to break even
Example: $500 ÷ $60 = 8.3 months to break even.
months_to_break_even <- function(upfront_cost, monthly_savings) {
  upfront_cost / monthly_savings
}
A $500 membership that saves $60/month
months_to_break_even(upfront_cost = 500, monthly_savings = 60)
#> [1] 8.333333
def months_to_break_even(upfront_cost, monthly_savings):
return upfront_cost / monthly_savingsA $500 membership that saves $60/month
months_to_break_even(upfront_cost=500, monthly_savings=60)
#> 8.333333333333334
Assuming the upfront cost is in cell A2 and the monthly savings amount is in cell B2:
=A2 / B2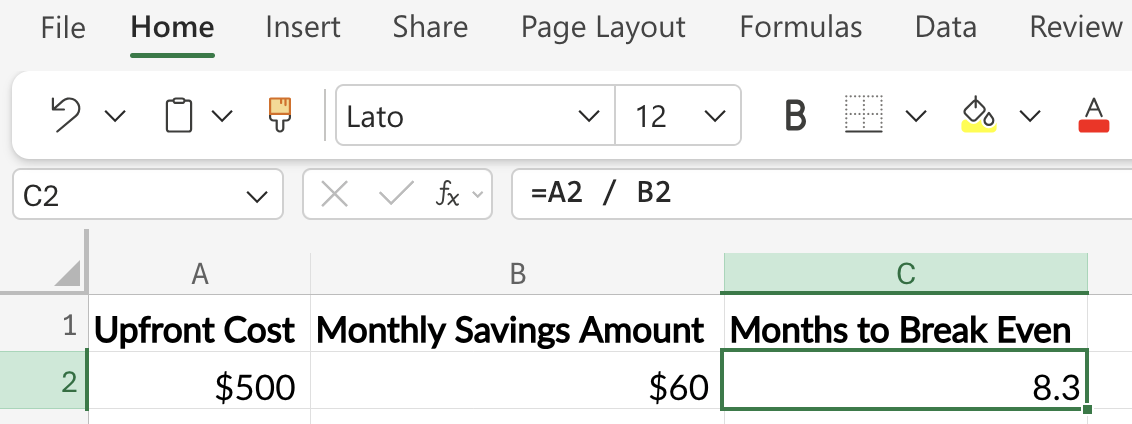
That $500 membership is worth it if you’ll use it longer than 8.33 months.
3.7 Putting It All Together
%%{init: {'theme': 'neutral', 'themeVariables': { 'fontFamily': 'monospace', "fontSize":"16px", 'primaryColor':'#0e9aa7', 'primaryBorderColor':'#1C1C1E', 'secondBkgColor':'#f44242', 'tertiaryColor':'#48a56a'}}}%%

flowchart TD
    Start(["Start:<br>Build Your Budget"]) --> S1("<b>SETUP PHASE</b><br><br>1. Track Spending<br>2. Categorize Expenses<br>3. Calculate Savings Rate<br>4. Choose Framework")

    S1 --> I1("<b>IMPLEMENTATION PHASE</b><br><br>5. Set Up Sinking Funds<br>6. Automate Everything")

    I1 --> O1("<b>ONGOING PHASE</b><br><br>7. Weekly Review<br>Monthly Adjust<br>8. Quarterly Recalibrate")

    O1 --> End(["Result:<br>Intentional Budget"])

    style Start fill:#48a56a,color:#F5F2E8,stroke:#1C1C1E,stroke-width:2px
    style S1 fill:#0e9aa7,color:#F5F2E8,stroke:#1C1C1E,stroke-width:3px
    style I1 fill:#f44242,color:#F5F2E8,stroke:#1C1C1E,stroke-width:3px
    style O1 fill:#86ddcd,color:#1C1C1E,stroke:#1C1C1E,stroke-width:3px
    style End fill:#48a56a,color:#F5F2E8,stroke:#1C1C1E,stroke-width:2px
3.8 Key takeaways
A budget is just a plan for your money in advance. Good budgets:
- Match your personality. Don’t fight your nature; work with it.
- Automate the boring stuff. Investments, bills, sinking funds: set and forget.
- Leave room for joy. Sethi’s guilt-free spending isn’t optional; it’s what makes budgets sustainable.
- Track one number above all: the important number is your savings rate (which we will cover in Savings). Everything else is detail.
- Builds in margin for error. Housel’s principle, “reality is messier than spreadsheets.”
Budgeting math isn’t hard. The categories aren’t complicated. The tools are abundant. What’s actually required is the decision to be intentional, and the patience to let small, consistent allocations compound into a life of financial freedom.
As Bogle reminded us about investing, the same applies to budgeting: don’t do something, just stand there. Set up the system, then let it work.
I’ve included frameworks from Sethi, Housel, Bogle, and Felix because they are designed for how humans actually behave.↩︎
Bogle advocated for keeping investment costs and financial friction as low as possible. This principle extends directly to fixed expenses: minimize them once through comparison shopping and negotiation, then automate to avoid repeated mental costs. See Bogleheads.↩︎
Sethi’s Conscious Spending Plan divides spending into fixed costs, savings, guilt-free spending (wants), and investments. The key insight is that tracking categories rather than individual transactions reduces decision fatigue and improves compliance. Learn more at the Conscious Spending Basics guide.↩︎
Felix’s evidence-based approach to investing and personal finance emphasizes that behavioral factors—consistency, habit, and guilt-free compliance—outweigh optimization. A budget you follow imperfectly beats one you abandon. See PWL Capital research.↩︎
This plan is covered on his website and in this Reddit post↩︎
See the full guide at moneyguy.com/guide/foo (Preston 2024).↩︎