%%{init: {'theme': 'neutral', 'themeVariables': { 'fontFamily': 'monospace', "darkMode":false, "fontSize":"16px"}}}%%

flowchart TD
    HomeCosts("True Cost<br>of Ownership") --> Mortgage("Mortgage<br>Interest")
    HomeCosts --> PropTax("Property Taxes<br>1-2% annually")
    HomeCosts --> Maintenance("Maintenance<br>~1% annually")
    HomeCosts --> Insurance("Insurance")
    HomeCosts --> Closing("Closing<br>Costs 3-5%")
    HomeCosts --> Opportunity2("Down Payment<br>Opportunity Cost")

    Mortgage --> UnrecovCost("Unrecoverable Costs<br>~5% of home<br>value per year")
    PropTax --> UnrecovCost
    Maintenance --> UnrecovCost
    Insurance --> UnrecovCost
    Closing --> UnrecovCost
    Opportunity2 --> UnrecovCost
    style HomeCosts fill:#48a56a,color:#F5F2E8,stroke:#1C1C1E,stroke-width:2px
    style Mortgage fill:#0e9aa7,color:#F5F2E8,stroke:#1C1C1E,stroke-width:2px
    style PropTax fill:#0e9aa7,color:#F5F2E8,stroke:#1C1C1E,stroke-width:2px
    style Maintenance fill:#0e9aa7,color:#F5F2E8,stroke:#1C1C1E,stroke-width:2px
    style Insurance fill:#0e9aa7,color:#F5F2E8,stroke:#1C1C1E,stroke-width:2px
    style Closing fill:#0e9aa7,color:#F5F2E8,stroke:#1C1C1E,stroke-width:2px
    style Opportunity2 fill:#0e9aa7,color:#F5F2E8,stroke:#1C1C1E,stroke-width:2px
    style UnrecovCost fill:#f44242,color:#F5F2E8,stroke:#1C1C1E,stroke-width:2px
16 Major Purchases
A house is where most people accidentally undo years of saving. The mechanics aren’t complicated; the discipline is.
- Renting vs. buying
- The true cost of owning (the sticker price is the smallest piece)
- Monthly mortgage payments and how interest is front-loaded
16.1 Owning vs. Renting: The Most Debated Question
This is where Ben Felix’s research is genuinely groundbreaking. The conventional wisdom (“renting is throwing money away”) is one of the most persistent myths in personal finance.
The Real Math
Felix has produced extensive analysis showing that renting and investing the difference often matches or beats homeownership, once you account for the full cost of owning.
Felix’s “5% Rule”
A simplified version of Felix’s framework: the unrecoverable costs of owning are roughly 5% of the home’s value per year (property tax ~1%, maintenance ~1%, and cost of capital ~3%, which is the interest and investment return you give up on the money tied up in the house). The math section below walks through the formula and the code.
Rule of thumb: Multiply the home’s value by 5% and divide by 12. If you can rent an equivalent property for less than that, renting and investing the difference is likely the better financial choice.
When Buying Makes Sense
Buying isn’t bad, but it should be a lifestyle decision more than a financial one. Buy when:
- You’re confident you’ll stay 7+ years (closing costs need time to amortize)
- You have a stable income and adequate emergency fund
- You value the autonomy, stability, and control
- The local rent-to-price ratio favors buying
- You won’t be “house poor” (housing costs should stay under 28-30% of gross income)
When Renting Makes Sense
- You may move within 5-7 years
- Your career requires geographic flexibility
- Local home prices are stretched relative to rents
- You’d rather invest the difference in a diversified portfolio
- You value flexibility, lower maintenance burden, and predictable costs
The key insight from Felix: renting is not “throwing money away” any more than buying groceries is throwing money away. You’re paying for shelter either way. The question is which form of shelter delivers better financial and lifestyle outcomes for your situation.
Putting the pieces together, here is how I’d walk through the decision:
%%{init: {'theme': 'neutral', 'themeVariables': { 'fontFamily': 'monospace', "darkMode":false, "fontSize":"16px"}}}%%

flowchart TD
    Start(["Rent or buy?"]) --> Stay{"Will you stay<br>7+ years?"}
    Stay -->|"No"| RentFlex("Rent and keep<br>your flexibility")
    Stay -->|"Yes"| Rule{"Is rent below the<br>5% rule figure?"}
    Rule -->|"Yes"| RentInvest("Rent and invest<br>the difference")
    Rule -->|"No"| Ready{"Stable income and<br>an emergency fund?"}
    Ready -->|"Yes"| Buy("Buying can make<br>financial sense")
    Ready -->|"No"| Build("Build your<br>cushion first")
    style Start fill:#48a56a,color:#F5F2E8,stroke:#1C1C1E,stroke-width:2px
    style Stay fill:#f0cfcf,color:#1C1C1E,stroke:#1C1C1E,stroke-width:2px
    style Rule fill:#f0cfcf,color:#1C1C1E,stroke:#1C1C1E,stroke-width:2px
    style Ready fill:#f0cfcf,color:#1C1C1E,stroke:#1C1C1E,stroke-width:2px
    style RentFlex fill:#0e9aa7,color:#F5F2E8,stroke:#1C1C1E,stroke-width:2px
    style RentInvest fill:#0e9aa7,color:#F5F2E8,stroke:#1C1C1E,stroke-width:2px
    style Buy fill:#48a56a,color:#F5F2E8,stroke:#1C1C1E,stroke-width:2px
    style Build fill:#f44242,color:#F5F2E8,stroke:#1C1C1E,stroke-width:2px
Mortgage Amortization: The Front-Loaded Interest Reality
Mortgages are structured so you pay mostly interest in early years. Understanding this changes how you think about moving and refinancing.
Key insight: On a 30-year mortgage at 6%, more than 80% of your first year’s payments go to interest, not principal.
Rough breakdown of where payments go:
| Years | Approx. % to Interest | Approx. % to Principal |
|---|---|---|
| 1-5 | 70-80% | 20-30% |
| 6-15 | 50-70% | 30-50% |
| 16-25 | 25-50% | 50-75% |
| 26-30 | 5-25% | 75-95% |
This is why moving every 5 years is so financially destructive: you’re essentially renting from the bank while paying ownership costs on top.
16.2 Math for Major Purchases
Big purchases are where small percentage differences turn into tens of thousands of dollars. Each calculation below is written as an R and Python function, following the same pattern introduced in the Budgeting chapter.
The Rent-vs-Buy 5% Rule
The 5% rule isn’t magic; it’s the sum of three real costs that every homeowner pays whether they realize it or not. The chart splits those costs for a $500,000 home.
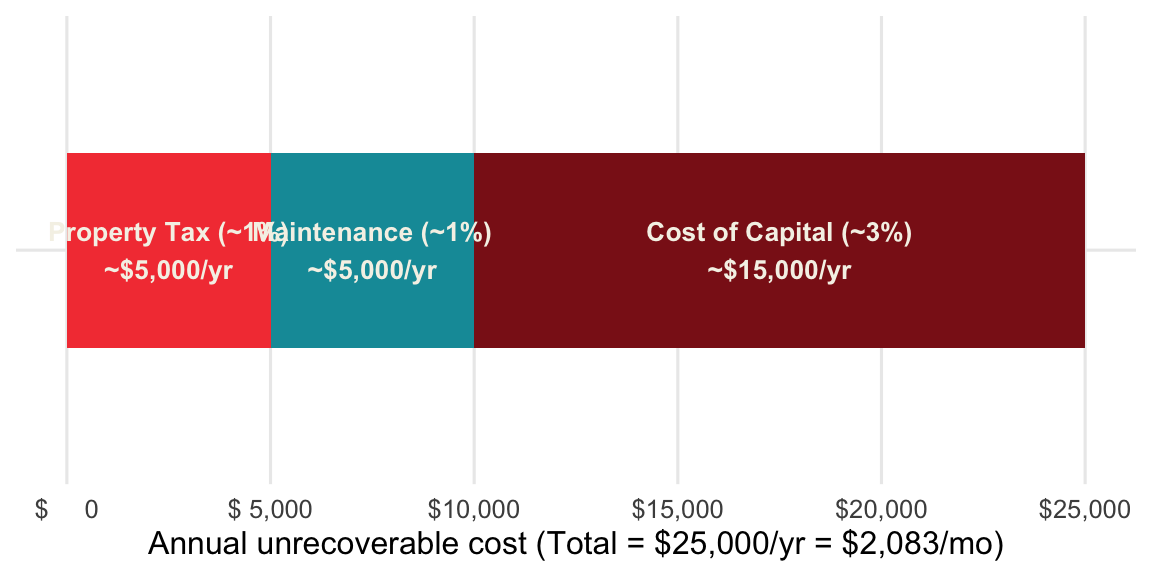
Add the three percentage slices together and you get 5% of home value per year; divide by 12 to get the monthly ownership cost threshold.
Formula: Monthly cost of owning ≈ (Home Value × 0.05) ÷ 12
Example: a $500,000 home → (500,000 × 0.05) ÷ 12 = $2,083/month. Rent below that, and renting-and-investing-the-difference tends to win.
In R, rent_buy_threshold() turns the 5% rule into a monthly rent figure.
show/hide
rent_buy_threshold <- function(home_value, unrecoverable_rate = 0.05) {
  (home_value * unrecoverable_rate) / 12
}

# $500,000 home at the standard 5% unrecoverable rate
rent_buy_threshold(home_value = 500000)
#> [1] 2083.333
The Python version of rent_buy_threshold() works the same way:
show/hide
def rent_buy_threshold(home_value, unrecoverable_rate=0.05):
    return (home_value * unrecoverable_rate) / 12

# $500,000 home at the standard 5% unrecoverable rate
rent_buy_threshold(home_value=500000)
#> 2083.3333333333335
Assuming the home value is in A2 and the unrecoverable rate (0.05) is in B2:
=(A2*B2)/12The Monthly Mortgage Payment
This is the standard amortization formula behind every mortgage calculator. The same loan produces very different monthly payments depending on how many months you spread it over.
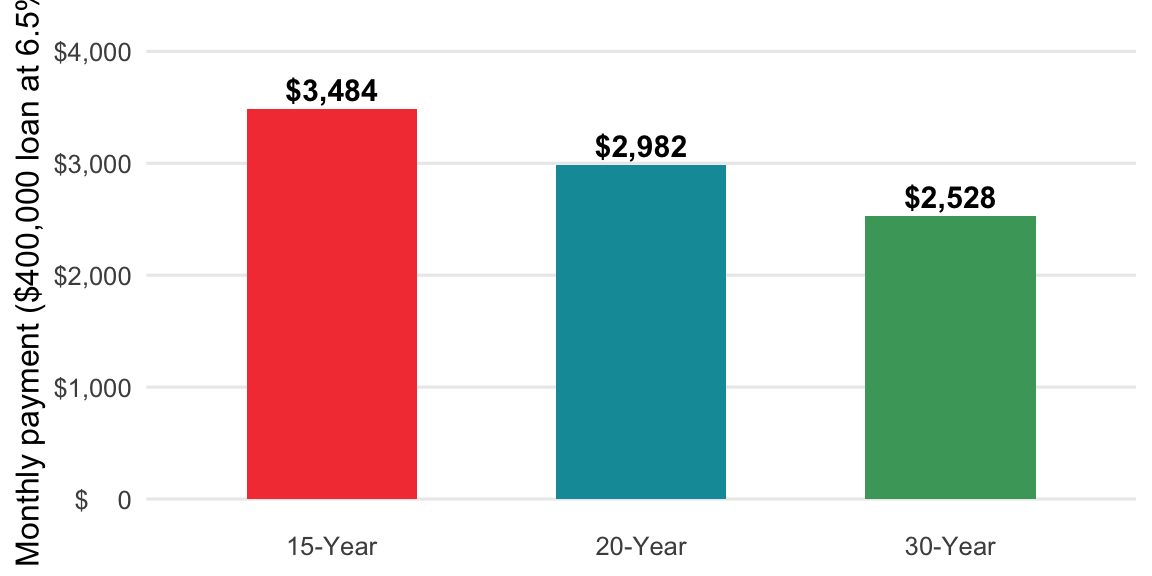
The formula allocates the principal plus all future interest into equal monthly installments; shorter terms mean higher bars because more principal must be retired each month.
Formula: M = P × [ r(1 + r)^n ] ÷ [ (1 + r)^n − 1 ]
Where: P = the loan principal, r = the monthly interest rate (annual ÷ 12), n = the total number of payments (years × 12).
Example: a $480,000 loan (a $600,000 home with 20% down) at 6% for 30 years → ~$2,878/month.
In R, mortgage_payment() implements the amortization formula.
show/hide
mortgage_payment <- function(principal, annual_rate, years) {
  r <- annual_rate / 12
  n <- years * 12
  principal * (r * (1 + r)^n) / ((1 + r)^n - 1)
}

# $480,000 loan at 6% over 30 years
mortgage_payment(principal = 480000, annual_rate = 0.06, years = 30)
#> [1] 2877.843
The Python version of mortgage_payment() works the same way:
show/hide
def mortgage_payment(principal, annual_rate, years):
    r = annual_rate / 12
    n = years * 12
    return principal * (r * (1 + r) ** n) / ((1 + r) ** n - 1)

# $480,000 loan at 6% over 30 years
mortgage_payment(principal=480000, annual_rate=0.06, years=30)
#> 2877.8425207332334
Assuming the loan amount is in A2, the annual rate is in B2 (as a decimal), and the years are in C2:
=A2*((B2/12)*(1+B2/12)^(C2*12))/((1+B2/12)^(C2*12)-1)Excel’s built-in PMT() function does the same job (it returns a negative number because it treats the payment as money going out, so we flip the sign):
=-PMT(B2/12, C2*12, A2)Where the First Year’s Payments Go
The front-loaded-interest reality, in numbers: in month one your interest is simply the balance times the monthly rate, and only the rest reduces the principal. Early mortgage payments are mostly interest, which is why moving after a few years means you’ve barely touched the principal.
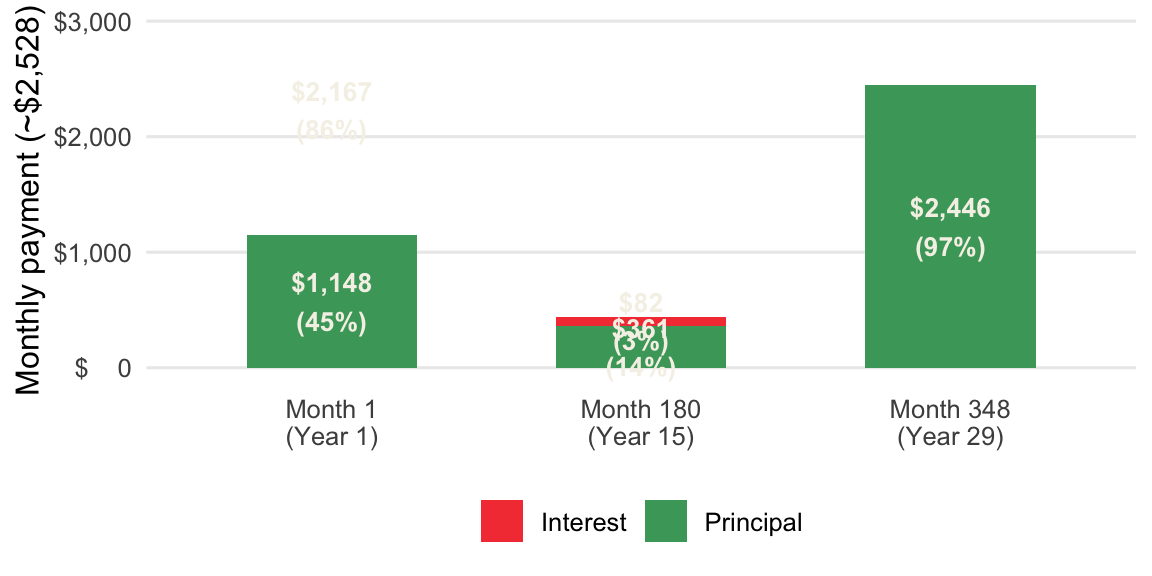
Each month’s interest is just the outstanding balance times the monthly rate; the principal is what’s left over after interest is paid.
Formula:
- First-month interest = Principal × (annual rate ÷ 12)
- First-month principal = Monthly Payment − First-month interest
Example: on that $480,000 loan, month-one interest is $2,400 of the ~$2,878 payment, about 83% interest, leaving only ~$478 toward principal.
In R, first_payment_split() shows how much of the first payment is interest and how much is principal.
show/hide
first_payment_split <- function(principal, annual_rate, years) {
  payment  <- mortgage_payment(principal, annual_rate, years)
  interest <- principal * (annual_rate / 12)
  data.frame(
    payment      = payment,
    interest     = interest,
    principal    = payment - interest,
    pct_interest = (interest / payment) * 100
  )
}

# first payment on a $480,000 loan at 6% over 30 years
first_payment_split(principal = 480000, annual_rate = 0.06, years = 30)
#> # A tibble: 1 × 4
#>   payment interest principal pct_interest
#>     <dbl>    <dbl>     <dbl>        <dbl>
#> 1   2878.     2400      478.         83.4
The Python version of first_payment_split() works the same way:
show/hide
def first_payment_split(principal, annual_rate, years):
    payment = mortgage_payment(principal, annual_rate, years)
    interest = principal * (annual_rate / 12)
    return {
        "payment": payment,
        "interest": interest,
        "principal": payment - interest,
        "pct_interest": (interest / payment) * 100,
    }

# first payment on a $480,000 loan at 6% over 30 years
first_payment_split(principal=480000, annual_rate=0.06, years=30)
#> {'payment': 2877.8425207332334, 'interest': 2400.0, 'principal': 477.8425207332334, 'pct_interest': 83.39580719616701}
Assuming the loan amount is in A2, the annual rate is in B2, and the years are in C2, the monthly payment goes in D2:
=-PMT(B2/12, C2*12, A2)The first month’s interest goes in E2:
=A2*B2/12The principal portion goes in F2:
=D2-E2And the percent of the payment that is interest goes in G2 (format the cell as a Percentage):
=E2/D216.3 Recap
- Renting isn’t throwing money away. You pay for shelter either way. The real question is which option leaves you better off for your situation.
- Use the 5% rule as a quick test. Multiply the home’s value by 5% and divide by 12. On a $500,000 home that’s about $2,083 a month. If you can rent a comparable place for less, renting and investing the difference usually wins.
- Owning costs more than the mortgage. Property tax, maintenance, and the return you give up on your down payment add up to roughly 5% of the home’s value each year.
- Early mortgage payments are mostly interest. In the first year, more than 80% of each payment goes to interest, which is why moving after a few years leaves you with barely any principal paid down.
- Buy for lifestyle reasons, not just math. Buy when you plan to stay 7 or more years, your income is stable, you have an emergency fund, and your housing costs stay under 28 to 30% of your gross income.
A house is the biggest purchase most people ever make, so run the numbers before you fall in love with a floor plan.