%%{init: {'theme': 'neutral', 'themeVariables': { 'fontFamily': 'monospace', "fontSize":"16px"}}}%%

flowchart LR
    Tracking(["<strong>TRACKING</strong>"]) --"<em>Where money<br>actually went</em>"--> Compare{"<strong>COMPARE</strong><br/><em>plan vs.<br>reality</em>"}
    Budgeting(["<strong>BUDGETING</strong>"]) --"<em>Where money<br>should go</em>"--> Compare


    Compare --> Insights("Insights &<br>Adjustments")
    Insights --"<em>Feedback</em>"--> Budgeting

    style Budgeting fill:#48a56a,color:#F5F2E8,stroke:#1C1C1E,stroke-width:2px
    style Tracking fill:#48a56a,color:#F5F2E8,stroke:#1C1C1E,stroke-width:2px
    style Compare fill:#f0cfcf,color:#1C1C1E,stroke:#1C1C1E,stroke-width:2px
    style Insights fill:#86ddcd,color:#1C1C1E,stroke:#1C1C1E,stroke-width:2px
2 Tracking Spending
You only manage what you measure. This chapter covers how to capture every dollar that leaves your accounts and turn those transactions into insights.
- Capturing every transaction
- Working with digital bank exports
- Categorizing what you’ve captured
- Reviewing on a monthly cadence
- Spotting “leak” categories (subscriptions, delivery fees, impulse buys)
Tracking is the recording side of personal finance. In the next chapter, we’ll cover budgeting, which is the allocation side (i.e., where money is supposed to go). Without tracking, a budget is a guess; with tracking, a budget becomes a feedback loop.
2.1 Capturing Transactions
Below are a few time-tested ways to capture your spending. If you’re reading this, you’ll also know there’s a sea of apps and digital tools for tracking your spending. It’s important to know people were tracking their spending before the internet, personal computers, and calculators. Regardless of the method you choose, the important thing is to pick one, run it for a full month, then decide whether it works for you.
A spending journal
A small notebook, kept in a pocket or bag. Every time money leaves your hands, you write one line: amount, place, category. At week’s end, you tally. This is the oldest method on the list (Benjamin Franklin kept one). Its strength is the moment of awareness it forces. Writing “$6 / Starbucks / coffee” by hand is a small pause that an automatically recorded card swipe will never give you.
Checkbook registers
Every paper checkbook used to come with a register that recorded each transaction on its own line, with a running balance. Registers work for any account where you can list debits and credits. One page per month is plenty. The habit of writing each entry keeps you disciplined and honest about the balance.
Cash envelope system
If you’re a fan of low-tech solutions, you can withdraw monthly amounts in cash for groceries, dining, gas and fun money, then split them into labeled physical envelopes. When an envelope is empty, that category is done for the month. Depression-era families used envelopes because they had to. The system has stuck around because the physical, finite nature of cash slows spending more reliably than any reminder ever will.1
Bank statements
Today, we make purchases digitally (via debit and credit cards), so every transaction is already captured. The work shifts from capture to review: once a month, pull the bank and card statements, go through them line by line, and assign each transaction to a category. This is the modern equivalent of the register above, except that the bank has done much of the work.
2.2 Categorizing Transactions
Categorizing transactions can get complicated, but it doesn’t need to be. Downloading a bank statement is easy, but today, transactions might be handled by multiple services (Amazon, PayPal, Venmo, etc.). Transactions like these can be difficult to reconcile, so I recommend starting with about 10 buckets and a small, stable list.
A working starter set:
Housing (rent/mortgage, utilities, insurance)
Transportation (car payment, fuel, maintenance, transit)
Food — groceries
Food — dining out
Subscriptions (everything recurring and digital)
Personal (clothes, haircuts, gym)
Health & insurance
Gifts & giving
Fun money (don’t break this down further — protect it from over-tracking)
Other / one-offs
Two rules that save hours of bookkeeping:
When in doubt, “Other”. Don’t invent a new category for a single transaction. Review the “Other” bucket at month-end and only promote a new category once you’ve seen the same kind of transaction three months in a row.
Keep the categories stable. Changing categories every month destroys the comparisons that make tracking useful in the first place. A stable set of categories will outlast any rotating set of “smart” categorizations.
2.3 Using Spreadsheets
Digital tracking is the bank-statement method above, but some of the work is done for you. Most banks allow you to export your monthly statement, and they typically include at least three columns: Date, Description, and Amount (negative for money going out, positive for money coming in).
Not all exported bank statements include a category, but you can add it yourself, and we’ll do it in buidling categories section below.
Create the bank_statement data in R:
show/hide R bank_statement
r_bank_statement <- tibble::tibble(
  Date = as.Date(c(
    "2026-01-02", "2026-01-02", "2026-01-03", "2026-01-03",
    "2026-01-04", "2026-01-04", "2026-01-05", "2026-01-06",
    "2026-01-07", "2026-01-08", "2026-01-09", "2026-01-10",
    "2026-01-11", "2026-01-12", "2026-01-13", "2026-01-14",
    "2026-01-15"
  )),
  Description = c(
    "Employer Payroll",       "Rent",
    "Comcast Internet",       "Trader Joe's",
    "Shell Gas",              "Netflix",
    "Starbucks",              "PG&E Electric",
    "AT&T Wireless",          "Spotify",
    "Whole Foods",            "Chipotle",
    "Geico Auto Insurance",   "NYTimes Digital",
    "Shell Gas",              "Costco",
    "24 Hour Fitness"
  ),
  Amount = c(
     2400.00, -1500.00,
      -75.00,   -82.45,
      -45.20,   -15.99,
       -6.75,  -142.30,
      -85.00,   -10.99,
      -64.12,   -14.50,
     -125.00,   -17.00,
      -42.80,  -156.78,
      -39.99
  )
)
We’ll use knitr::kable() to make the output pretty:
show/hide
r_bank_statement |> knitr::kable()| Date | Description | Amount |
|---|---|---|
| 2026-01-02 | Employer Payroll | 2400.00 |
| 2026-01-02 | Rent | -1500.00 |
| 2026-01-03 | Comcast Internet | -75.00 |
| 2026-01-03 | Trader Joe’s | -82.45 |
| 2026-01-04 | Shell Gas | -45.20 |
| 2026-01-04 | Netflix | -15.99 |
| 2026-01-05 | Starbucks | -6.75 |
| 2026-01-06 | PG&E Electric | -142.30 |
| 2026-01-07 | AT&T Wireless | -85.00 |
| 2026-01-08 | Spotify | -10.99 |
| 2026-01-09 | Whole Foods | -64.12 |
| 2026-01-10 | Chipotle | -14.50 |
| 2026-01-11 | Geico Auto Insurance | -125.00 |
| 2026-01-12 | NYTimes Digital | -17.00 |
| 2026-01-13 | Shell Gas | -42.80 |
| 2026-01-14 | Costco | -156.78 |
| 2026-01-15 | 24 Hour Fitness | -39.99 |
Create the bank_statement data in Python (with polars):
show/hide Python bank_statement
import polars as pl

py_bank_statement = pl.DataFrame({
    "Date": [
        "2026-01-02", "2026-01-02", "2026-01-03", "2026-01-03",
        "2026-01-04", "2026-01-04", "2026-01-05", "2026-01-06",
        "2026-01-07", "2026-01-08", "2026-01-09", "2026-01-10",
        "2026-01-11", "2026-01-12", "2026-01-13", "2026-01-14",
        "2026-01-15"
    ],
    "Description": [
        "Employer Payroll",     "Rent",
        "Comcast Internet",     "Trader Joe's",
        "Shell Gas",            "Netflix",
        "Starbucks",            "PG&E Electric",
        "AT&T Wireless",        "Spotify",
        "Whole Foods",          "Chipotle",
        "Geico Auto Insurance", "NYTimes Digital",
        "Shell Gas",            "Costco",
        "24 Hour Fitness"
    ],
    "Amount": [
         2400.00, -1500.00,
          -75.00,   -82.45,
          -45.20,   -15.99,
           -6.75,  -142.30,
          -85.00,   -10.99,
          -64.12,   -14.50,
         -125.00,   -17.00,
          -42.80,  -156.78,
          -39.99
    ]
}).with_columns(pl.col("Date").str.to_date())
show/hide
py_bank_statement
shape: (17, 3)
| Date | Description | Amount |
|---|---|---|
| date | str | f64 |
| 2026-01-02 | "Employer Payroll" | 2400.0 |
| 2026-01-02 | "Rent" | -1500.0 |
| 2026-01-03 | "Comcast Internet" | -75.0 |
| 2026-01-03 | "Trader Joe's" | -82.45 |
| 2026-01-04 | "Shell Gas" | -45.2 |
| 2026-01-04 | "Netflix" | -15.99 |
| 2026-01-05 | "Starbucks" | -6.75 |
| 2026-01-06 | "PG&E Electric" | -142.3 |
| 2026-01-07 | "AT&T Wireless" | -85.0 |
| 2026-01-08 | "Spotify" | -10.99 |
| 2026-01-09 | "Whole Foods" | -64.12 |
| 2026-01-10 | "Chipotle" | -14.5 |
| 2026-01-11 | "Geico Auto Insurance" | -125.0 |
| 2026-01-12 | "NYTimes Digital" | -17.0 |
| 2026-01-13 | "Shell Gas" | -42.8 |
| 2026-01-14 | "Costco" | -156.78 |
| 2026-01-15 | "24 Hour Fitness" | -39.99 |
The bank_statement can also be copied + pasted into Excel:
![]()
bank_statement in ExcelExcel also has a handy table format, which give many tools for sorting and analyzing data.2 I’ll go into using tables more on the accompanying website for the book.
Once your transactions sit in columns and rows, it’s much easier to answer tracking questions like:
- What is the total spent on subscriptions?
- What percentage of my income is going to fixed costs?
- What was my biggest variable category last month?
Bogle would approve of building a custom spreadsheet because simplicity wins. A well-built spreadsheet beats most apps because it forces you to engage with your numbers.
TipR vs Python: data frames and pipes
Two ideas the categorization code above relies on:
Data frames
R’s data.frame is built into the base language; the tibble is the modern replacement (used throughout this book).
Python has no built-in data frame — you need a library; we use polars (pl.DataFrame).
df <- tibble::tibble(x = 1:5)import polars as pl
df = pl.DataFrame({"x": [1, 2, 3, 4, 5]})Pipes / chaining
R has a native pipe |> (also %>% from magrittr/dplyr) for left-to-right reading: data flows from one function into the next.
Python has no native pipe; the same effect comes from chaining method calls, which polars is designed for.
df |> dplyr::filter(x > 2)df.filter(pl.col("x") > 2)2.3.1 Building Categories
The bank_statement dataset above includes the columns typically found in a real bank export (Date, Description, and Amount). To get to a Category column, we have to map descriptions to the buckets. A small lookup of keyword patterns does the job in one pass.
In R, a lookup table can be created using dplyr:
show/hide R categorize transactions
r_bank_statement <- r_bank_statement |>
  dplyr::mutate(
    Category = dplyr::case_when(
      grepl("Payroll",                                   Description) ~ "Income",
      grepl("Rent",                                      Description) ~ "Housing",
      grepl("Comcast|PG&E|AT&T",                         Description) ~ "Utilities",
      grepl("Trader Joe|Whole Foods|Costco",             Description) ~ "Groceries",
      grepl("Shell",                                     Description) ~ "Transportation",
      grepl("Starbucks|Chipotle",                        Description) ~ "Dining",
      grepl("Netflix|Spotify|NYTimes|24 Hour Fitness",   Description) ~ "Subscriptions",
      grepl("Geico",                                     Description) ~ "Insurance",
      TRUE                                                            ~ "Other"
    )
  )

r_bank_statement |> knitr::kable()| Date | Description | Amount | Category |
|---|---|---|---|
| 2026-01-02 | Employer Payroll | 2400.00 | Income |
| 2026-01-02 | Rent | -1500.00 | Housing |
| 2026-01-03 | Comcast Internet | -75.00 | Utilities |
| 2026-01-03 | Trader Joe’s | -82.45 | Groceries |
| 2026-01-04 | Shell Gas | -45.20 | Transportation |
| 2026-01-04 | Netflix | -15.99 | Subscriptions |
| 2026-01-05 | Starbucks | -6.75 | Dining |
| 2026-01-06 | PG&E Electric | -142.30 | Utilities |
| 2026-01-07 | AT&T Wireless | -85.00 | Utilities |
| 2026-01-08 | Spotify | -10.99 | Subscriptions |
| 2026-01-09 | Whole Foods | -64.12 | Groceries |
| 2026-01-10 | Chipotle | -14.50 | Dining |
| 2026-01-11 | Geico Auto Insurance | -125.00 | Insurance |
| 2026-01-12 | NYTimes Digital | -17.00 | Subscriptions |
| 2026-01-13 | Shell Gas | -42.80 | Transportation |
| 2026-01-14 | Costco | -156.78 | Groceries |
| 2026-01-15 | 24 Hour Fitness | -39.99 | Subscriptions |
NoteRe-using categories in R
For repeated use, the case_when() pipeline above can be wrapped into a reusable function that accepts a lookup table, making it easy for users add or edit keyword patterns:
df=data.framewith aDescriptioncolumn
rules=data.framewithPatternandCategorycolumns
show/hide R apply_rules() function
# Apply keyword rules to categorize transactions
apply_rules <- function(df, rules) {
  df$Category <- "Other"
  for (i in seq_len(nrow(rules))) {
    unmatched <- df$Category == "Other"
    hits <- grepl(rules$Pattern[i], df$Description, ignore.case = TRUE) & unmatched
    df$Category[hits] <- rules$Category[i]
  }
  df
}
Create a data.frame with Pattern and Category:
show/hide R apply_rules() demo
r_rules <- data.frame(
  Pattern  = c("Payroll", "Rent", "Comcast|PG&E|AT&T",
               "Trader Joe|Whole Foods|Costco", "Shell",
               "Starbucks|Chipotle",
               "Netflix|Spotify|NYTimes|24 Hour Fitness", "Geico"),
  Category = c("Income", "Housing", "Utilities", "Groceries",
               "Transportation", "Dining", "Subscriptions", "Insurance")
)

r_rules |>
knitr::kable()| Pattern | Category |
|---|---|
| Payroll | Income |
| Rent | Housing |
| Comcast|PG&E|AT&T | Utilities |
| Trader Joe|Whole Foods|Costco | Groceries |
| Shell | Transportation |
| Starbucks|Chipotle | Dining |
| Netflix|Spotify|NYTimes|24 Hour Fitness | Subscriptions |
| Geico | Insurance |
Pass the same keyword lookup as rules and the function returns the data frame with a Category column appended:
show/hide R apply_rules() demo
apply_rules(r_bank_statement, r_rules) |>
knitr::kable()| Date | Description | Amount | Category |
|---|---|---|---|
| 2026-01-02 | Employer Payroll | 2400.00 | Income |
| 2026-01-02 | Rent | -1500.00 | Housing |
| 2026-01-03 | Comcast Internet | -75.00 | Utilities |
| 2026-01-03 | Trader Joe’s | -82.45 | Groceries |
| 2026-01-04 | Shell Gas | -45.20 | Transportation |
| 2026-01-04 | Netflix | -15.99 | Subscriptions |
| 2026-01-05 | Starbucks | -6.75 | Dining |
| 2026-01-06 | PG&E Electric | -142.30 | Utilities |
| 2026-01-07 | AT&T Wireless | -85.00 | Utilities |
| 2026-01-08 | Spotify | -10.99 | Subscriptions |
| 2026-01-09 | Whole Foods | -64.12 | Groceries |
| 2026-01-10 | Chipotle | -14.50 | Dining |
| 2026-01-11 | Geico Auto Insurance | -125.00 | Insurance |
| 2026-01-12 | NYTimes Digital | -17.00 | Subscriptions |
| 2026-01-13 | Shell Gas | -42.80 | Transportation |
| 2026-01-14 | Costco | -156.78 | Groceries |
| 2026-01-15 | 24 Hour Fitness | -39.99 | Subscriptions |
polars closely mirrors the dplyr code:
show/hide py categorize transactions
py_bank_statement = py_bank_statement.with_columns(
    Category = pl.when(pl.col("Description").str.contains("Payroll")).then(pl.lit("Income"))
        .when(pl.col("Description").str.contains("Rent")).then(pl.lit("Housing"))
        .when(pl.col("Description").str.contains("Comcast|PG&E|AT&T")).then(pl.lit("Utilities"))
        .when(pl.col("Description").str.contains("Trader Joe|Whole Foods|Costco")).then(pl.lit("Groceries"))
        .when(pl.col("Description").str.contains("Shell")).then(pl.lit("Transportation"))
        .when(pl.col("Description").str.contains("Starbucks|Chipotle")).then(pl.lit("Dining"))
        .when(pl.col("Description").str.contains("Netflix|Spotify|NYTimes|24 Hour Fitness")).then(pl.lit("Subscriptions"))
        .when(pl.col("Description").str.contains("Geico")).then(pl.lit("Insurance"))
        .otherwise(pl.lit("Other"))
)

py_bank_statement
shape: (17, 4)
| Date | Description | Amount | Category |
|---|---|---|---|
| date | str | f64 | str |
| 2026-01-02 | "Employer Payroll" | 2400.0 | "Income" |
| 2026-01-02 | "Rent" | -1500.0 | "Housing" |
| 2026-01-03 | "Comcast Internet" | -75.0 | "Utilities" |
| 2026-01-03 | "Trader Joe's" | -82.45 | "Groceries" |
| 2026-01-04 | "Shell Gas" | -45.2 | "Transportation" |
| 2026-01-04 | "Netflix" | -15.99 | "Subscriptions" |
| 2026-01-05 | "Starbucks" | -6.75 | "Dining" |
| 2026-01-06 | "PG&E Electric" | -142.3 | "Utilities" |
| 2026-01-07 | "AT&T Wireless" | -85.0 | "Utilities" |
| 2026-01-08 | "Spotify" | -10.99 | "Subscriptions" |
| 2026-01-09 | "Whole Foods" | -64.12 | "Groceries" |
| 2026-01-10 | "Chipotle" | -14.5 | "Dining" |
| 2026-01-11 | "Geico Auto Insurance" | -125.0 | "Insurance" |
| 2026-01-12 | "NYTimes Digital" | -17.0 | "Subscriptions" |
| 2026-01-13 | "Shell Gas" | -42.8 | "Transportation" |
| 2026-01-14 | "Costco" | -156.78 | "Groceries" |
| 2026-01-15 | "24 Hour Fitness" | -39.99 | "Subscriptions" |
NoteRe-using categories in Python
For use in a Shiny app, the when().then() chain above can be wrapped into a reusable function that accepts a rules table — making it easy to let users add or edit keyword patterns at runtime:
df=data.framewith aDescriptioncolumn
rules=data.framewithPatternandCategorycolumns
show/hide Python apply_rules() function
# Apply keyword rules to categorize transactions.

def apply_rules(df, rules):
    df = df.with_columns(pl.lit("Other").alias("Category"))
    for row in rules.iter_rows(named=True):
        df = df.with_columns(
            pl.when(
                pl.col("Description").str.contains(row["Pattern"])
                & (pl.col("Category") == "Other")
            )
            .then(pl.lit(row["Category"]))
            .otherwise(pl.col("Category"))
            .alias("Category")
        )
    return df
Pass the same keyword lookup as rules and the function returns the data frame with a Category column appended:
show/hide Python apply_rules() demo
py_rules = pl.DataFrame({
    "Pattern":  ["Payroll", "Rent", "Comcast|PG&E|AT&T",
                 "Trader Joe|Whole Foods|Costco", "Shell",
                 "Starbucks|Chipotle",
                 "Netflix|Spotify|NYTimes|24 Hour Fitness", "Geico"],
    "Category": ["Income", "Housing", "Utilities", "Groceries",
                 "Transportation", "Dining", "Subscriptions", "Insurance"]
})

apply_rules(py_bank_statement, py_rules)
shape: (17, 4)
| Date | Description | Amount | Category |
|---|---|---|---|
| date | str | f64 | str |
| 2026-01-02 | "Employer Payroll" | 2400.0 | "Income" |
| 2026-01-02 | "Rent" | -1500.0 | "Housing" |
| 2026-01-03 | "Comcast Internet" | -75.0 | "Utilities" |
| 2026-01-03 | "Trader Joe's" | -82.45 | "Groceries" |
| 2026-01-04 | "Shell Gas" | -45.2 | "Transportation" |
| 2026-01-04 | "Netflix" | -15.99 | "Subscriptions" |
| 2026-01-05 | "Starbucks" | -6.75 | "Dining" |
| 2026-01-06 | "PG&E Electric" | -142.3 | "Utilities" |
| 2026-01-07 | "AT&T Wireless" | -85.0 | "Utilities" |
| 2026-01-08 | "Spotify" | -10.99 | "Subscriptions" |
| 2026-01-09 | "Whole Foods" | -64.12 | "Groceries" |
| 2026-01-10 | "Chipotle" | -14.5 | "Dining" |
| 2026-01-11 | "Geico Auto Insurance" | -125.0 | "Insurance" |
| 2026-01-12 | "NYTimes Digital" | -17.0 | "Subscriptions" |
| 2026-01-13 | "Shell Gas" | -42.8 | "Transportation" |
| 2026-01-14 | "Costco" | -156.78 | "Groceries" |
| 2026-01-15 | "24 Hour Fitness" | -39.99 | "Subscriptions" |
In Excel, the IFS() function is the direct analog of case_when()/when().then().
- If the statement is laid out with
Datein columnA,Descriptionin columnB, andAmountin columnC. TypeCategoryin cellD1, then paste the formula below intoD2:
=IFS(
  ISNUMBER(SEARCH("Payroll", B2)), "Income",
  ISNUMBER(SEARCH("Rent", B2)), "Housing",
  OR(ISNUMBER(SEARCH("Comcast",B2)), ISNUMBER(SEARCH("PG&E",B2)), ISNUMBER(SEARCH("AT&T",B2))), "Utilities",
  OR(ISNUMBER(SEARCH("Trader Joe",B2)), ISNUMBER(SEARCH("Whole Foods",B2)), ISNUMBER(SEARCH("Costco",B2))), "Groceries",
  ISNUMBER(SEARCH("Shell", B2)), "Transportation",
  OR(ISNUMBER(SEARCH("Starbucks",B2)), ISNUMBER(SEARCH("Chipotle",B2))), "Dining",
  OR(ISNUMBER(SEARCH("Netflix",B2)), ISNUMBER(SEARCH("Spotify",B2)),
     ISNUMBER(SEARCH("NYTimes",B2)), ISNUMBER(SEARCH("24 Hour Fitness",B2))), "Subscriptions",
  ISNUMBER(SEARCH("Geico", B2)), "Insurance",
  TRUE, "Other"
)- Then copy
D2down through every transaction row (selectD2, double-click the small square in the bottom-right corner, or useCtrl+Dafter selectingD2:D{last_row}).
![]()
IFS() in ExcelTo add a new merchant when one shows up: edit the formula in D2, then re-fill down. Keep the new merchant near the bottom of its category group so the existing patterns still resolve first.
Each month, add a new pattern when you see a real transaction that didn’t match. The goal isn’t to classify every edge case up front; the lookup handles 90%+ of your monthly transactions automatically, leaving only the unusual ones to triage by hand.
TipR vs Python: booleans, logicals, and vectorization
The categorization code above uses all three of these ideas at once to create the keyword test:
We use
grepl()/str.contains()) to return a true/false result for every row at onceThen logical-OR alternation chooses between merchants
The final fall-through catches anything that didn’t match
Below is a quick summary of these topics in R and Python.
Boolean values
R writes them TRUE / FALSE (sometimes abbreviated T/F).
Python writes them True / False, capitalized, no abbreviation.
flag <- TRUEflag = TrueLogical operators
R uses &, |, ! for vectorized element-wise logic (and &&, || for scalar logic).
c(TRUE, FALSE) & c(TRUE, TRUE) # vectorized
TRUE && FALSE  # scalar
Python uses and, or, not for scalar logic, and &, |, ~ for vectorized logic in numpy/polars expressions.
True and False # scalar

# vectorized:
df.filter((pl.col("a") > 0) & (pl.col("b") < 10))
Vectorization
In R, vectors are first-class, so most operations apply element-wise by default.
In Python, native list is not vectorized; for that you reach for numpy arrays or polars Series / expressions.
c(1, 2, 3) * 2
# returns c(2, 4, 6)
import polars as pl
pl.Series([1, 2, 3]) * 2
# returns Series [2, 4, 6]2.4 The Monthly Review
Tracking is only valuable if you actually look at the totals. A monthly review is a thirty-minute habit, scheduled on the same day each month (i.e., the day after your statements close is a natural anchor).
The ritual has four steps:
- Pull the bank and credit-card statements for the month.
- Categorize every line into your buckets, using whichever capture method you’ve chosen.
- Compare category totals to your budget. Where did you go over budget? Where did you come in under budget?
- Pick one change for next month. One. The point is sustainable adjustment, not perfection.
Over a year, twelve small adjustments compound into a budget that actually fits your life. That’s the real return on tracking: the calibration loop, not the spreadsheet itself.
2.5 Online Subscriptions
This is the most overlooked category in personal finance. Streaming, apps, software, memberships, deliveries; they’re individually small but collectively enormous and can silently drain your accounts.
%%{init: {'theme': 'neutral', 'themeVariables': { 'fontFamily': 'monospace', "fontSize":"16px"}}}%%

flowchart TD
    Subscriptions(["<strong>Monthly<br>Subscriptions</strong>"]) --> Audit("Quarterly<br>Audit")
    Audit --> Use{"Used in<br>the last 30<br>days?"}
    Use -->|Yes| Worth{"Worth the<br>cost?"}
    Use -->|No| Cancel(["Cancel<br>Today"])
    Worth -->|Yes| Keep(["Keep"])
    Worth -->|No| Cancel
    Cancel --"<em>Redirect to</em>"--> Redirect("<strong>Investments</strong>")

    style Subscriptions fill:#48a56a,color:#F5F2E8,stroke:#1C1C1E,stroke-width:2px
    style Audit fill:#0e9aa7,color:#F5F2E8,stroke:#1C1C1E,stroke-width:2px
    style Use fill:#f0cfcf,color:#1C1C1E,stroke:#1C1C1E,stroke-width:2px
    style Worth fill:#f0cfcf,color:#1C1C1E,stroke:#1C1C1E,stroke-width:2px
    style Cancel fill:#f44242,color:#F5F2E8,stroke:#1C1C1E,stroke-width:2px
    style Keep fill:#48a56a,color:#F5F2E8,stroke:#1C1C1E,stroke-width:2px
    style Redirect fill:#86ddcd,color:#1C1C1E,stroke:#1C1C1E,stroke-width:2px
The Subscription Reality Check
The average household spends $200–$300/month on subscriptions, often without realizing it.3 At $250/month invested at a 7% real return over 30 years, that’s roughly $300,000 in lost wealth.
Action steps:
- Pull your last 3 months of bank/card statements
- List every recurring charge
- Cancel anything you haven’t actively used in 30 days
- Set a calendar reminder every 90 days to repeat this
- Use one card exclusively for subscriptions to track them easily
This isn’t deprivation; it’s the Sethi principle in action: cut mercilessly on what you don’t love so you can spend freely on what you do.
2.6 Math for tracking spending
Below are some tips and tools for tracking spending. Some can be used to easily categorize purchases; others can be used to check how much you’re spending on subscriptions.
The Subscription Audit Math
A $20/month subscription feels trivial. The chart below shows what that $240/year could have become if invested instead — each bar is a year when you could have stopped and kept the difference.
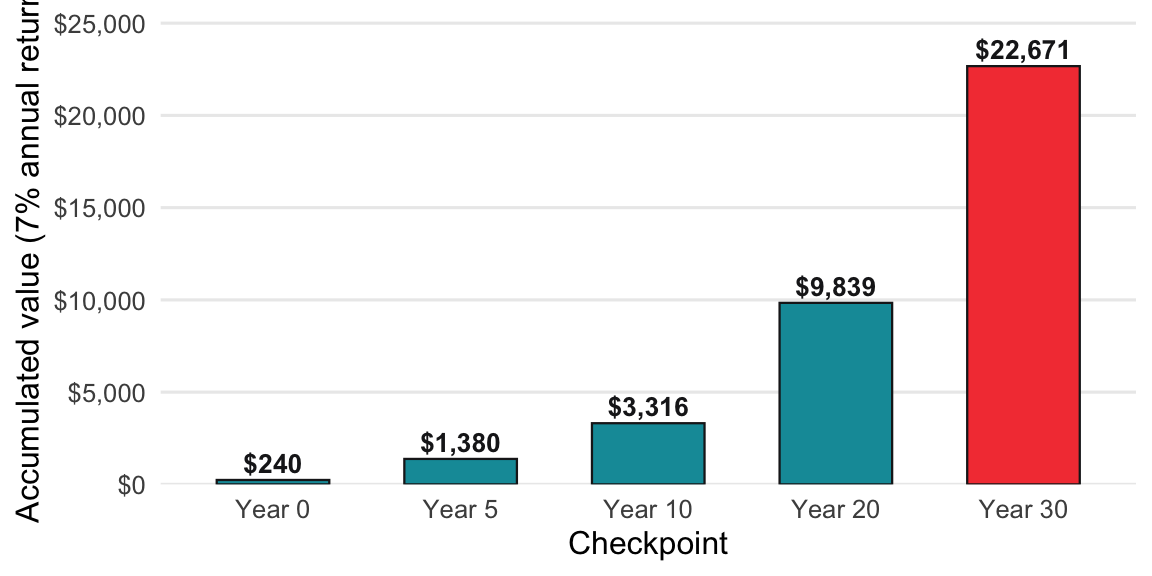
The formula is just compound growth applied to the annual cost: multiply each year’s $240 by the accumulated growth factor.
Formula: Monthly Subscription × 12 × (1.07)^n = Opportunity cost in n years
Example: A $20/month subscription you don’t really use, over 30 years:
- Annual cost: $240
- Invested at 7% real return for 30 years: ~$24,000
That “small” $20/month is a $24,000 decision. Audit accordingly.
In R, this is a simple function definition with the formula.
show/hide
subscription_opportunity_cost <- function(monthly_cost, years, rate = 0.07) {
  annual_cost <- monthly_cost * 12
  annual_cost * ((1 + rate)^years - 1) / rate
}
Now lets consider a $20/month subscription for 30 years at 7%:
show/hide
subscription_opportunity_cost(monthly_cost = 20, years = 30)
#> [1] 22670.59
Python is similar:
show/hide
def subscription_opportunity_cost(monthly_cost, years, rate=0.07):
    annual_cost = monthly_cost * 12
    return annual_cost * ((1 + rate) ** years - 1) / rate
The same $20/month subscription for 30 years at 7%:
show/hide
subscription_opportunity_cost(monthly_cost=20, years=30)
#> 22670.58871769843
In Excel, create a new sheet with the inputs:
| Monthly cost | Number of Years | Annual Return (as decimal) | Opportunity Cost |
|---|---|---|---|
| $20 | 30 | 0.07 | Formula below |
The formula (given this setup) is below:
=(A2*12)*((1+C2)^B2-1)/C2A2*12 converts the monthly cost to annual; the rest is the future-value-of-an-annuity formula using the rate in C2 and the time horizon in B2.
![]()
2.7 Key takeaways
Tracking is the recording side of personal finance; without it, your budget is just a guess. Five rules keep it sustainable:
Pick one capture method and run it for a month. Spending journal, checkbook register, cash envelopes, or pulling bank statements — any of them work. Switching every week works for nobody.
Keep your categories small and stable. Six to ten buckets are plenty. Stability is what makes month-to-month comparisons meaningful; rotating “smart” categories destroys the very signal you’re trying to build.
Schedule a monthly review and limit yourself to one change. Pull the statements, categorize them, compare them against your budget, and pick the single biggest leak to plug. Twelve small adjustments per year compound into a budget that actually fits your life.
Audit subscriptions every quarter. They’re individually small, collectively enormous, and trivially canceled. A $20/month service you don’t really use is roughly a $24,000 decision over thirty years (see the audit math above), so Sethi’s “cut mercilessly on what you don’t love” lands hardest here.
Simplicity wins. As Bogle would have it for investing, the same applies to tracking: a spreadsheet you’ll actually open beats any app you won’t.
The point of tracking isn’t a perfect ledger; it’s the feedback loop. When you can see where your money actually went, next month’s allocation in Budgeting becomes a decision rather than a guess.
Stashing cash around the house was actually quite common for people who lived through the depression. Read more here.↩︎
Read the Overview of Excel tables on the Microsoft documentation.↩︎
These numbers are reported on Next Gen Personal Finance and CBS News↩︎