%%{init: {'theme': 'neutral', 'themeVariables': { 'fontFamily': 'monospace', "fontSize":"13px"}}}%%
flowchart TD
    subgraph Inputs["Inputs"]
        subgraph Variables["mod_var_input"]
        var_input[/"<code>input$x</code><br><code>input$y</code><br><code>input$z</code>"/]
        end
        subgraph Aesthetics["mod_aes_input"]
        aes_input[/"<code>input$alpha</code><br><code>input$size</code>"/]
        plot_title[/"<code>input$plot_title</code>"/]
        end

    end
    subgraph React["Server"]
        subgraph Display["mod_scatter_display"]
        var_inputs>"<code>var_inputs</code> "]
        aes_inputs>"<code>aes_inputs</code> "]
        inputs>"<code>inputs()</code>"]
        end
    end
    subgraph Output["Output"]
        output[\"output$scatterplot"\]
    end

    var_input <--> |"Pre-selected<br>values"|var_inputs
    aes_input <--> |"Pre-selected<br>values"|aes_inputs
    plot_title -.-> |"User<br>input"|aes_inputs
    var_inputs & aes_inputs <--> |"Assembled into.."|inputs
    inputs <--> |"Rendered as..."|output

    style var_input stroke:#333,stroke-width:1px,rx:5,ry:5
    style aes_input stroke:#333,stroke-width:1px,rx:5,ry:5
17 Testing modules
In the previous chapters we covered using fixtures and helpers to our test suite. In this chapter, we’re going briefly discuss some tips for testing modules with Shiny’s testServer() function–specifically, how to verify modules are collecting and returning values correctly.
17.1 Integration tests
Integration tests verify that functions and components work together, and often involves instantiating multiple objects to interact with each other in a single test. In Shiny apps, integration tests typically involve using testServer() function to test reactive interactions between modules.
Launch app with the shinypak package:
launch('17_test-modules')For example, to confirm that the UI module functions are working (i.e., that user-inputs are updating in the application), we need to test the following changes:
- Input values collected in the UI are returned from
mod_var_inputandmod_aes_inputmodules
- The returned values are passed into
mod_scatter_displayand rendered in the UI
17.2 Testing return values
We’ll start with a test for the mod_var_input_server() function. Let’s simplify the diagram above to visualize what we’re attempting to capture in this test:
%%{init: {'theme': 'neutral', 'themeVariables': { 'fontFamily': 'monospace', "fontSize":"16px"}}}%%
flowchart
    subgraph VarModule["Variable Module"]
        VarInputs[/"Selected<br>Variables"/]
    end
    subgraph AesModule["Aesthetic Module"]
        AesInputs[/"Selected<br>Aesthetics"/]
    end
    subgraph GraphDisplay["Display Module"]
        ScatterDiplay[\"Graph Display"\]
    end

    VarInputs -.->|"Returns x, y<br>and color"|ScatterDiplay
    AesInputs -.->|"Returns size, <br>alpha and title"|ScatterDiplay
Based on our diagram, we’ll write feature, background, and scenario for the default values:
describe(
  "Feature: Scatter Plot Configuration in Movie Review Application
      As a user
      I want the initial graph pre-configured with variables,
      So that I can change the inputs and see a meaningful visualization.",
  code = {
    describe(
      "Background: Initial scatter plot x, y, color values
         Given the movie review application is loaded
         And the initial x-axis value is [IMDB Rating]
         And the initial y-axis value is [Audience Score]
         And the initial color value is [MPAA Rating]",
      code = {
        it("Scenario: Changing scatter plot x, y, and color values
             Given the movie review application is loaded
             When I choose the [Critics Score] for the x-axis
             And I choose the [Runtime] for the y-axis
             And I choose the [Title type] for color
             Then the scatter plot should show [Critics score] on the x-axis
             And the scatter plot should show [Runtime] on the y-axis
             And the points on the scatter plot should be colored by [Title type]",
          code = {

         shiny::testServer(app = mod_var_input_server, expr = {

           # test code -----

         })
       })
    })
})
Inside testServer():
- We can create a list of initial graph inputs (
test_vals), then - Pass identical values to
session$setInputs(), and - Confirm the returned object with
session$returned()vs.test_vals,1 and finally
- We’ll end the test by flushing the reactives set by
session$setInputs()2
testServer(app = mod_var_input_server, expr = {
test_vals <- list(
x = "audience_score",
y = "imdb_rating",
z = "mpaa_rating")
test_logger(start = "RETURNED", msg = "test_vals vs. session$returned()")
session$setInputs(
x = "audience_score",
y = "imdb_rating",
z = "mpaa_rating")
expect_equal(
object = session$returned(),
expected = test_vals)
test_logger(end = "RETURNED", msg = "test_vals vs. session$returned()")
session$flushReact()
})- 1
-
Create output values for comparison
- 2
-
Set each input using
setInputs(input = ) - 3
-
Confirm returned values against
test_vals
- 4
- Flush reactives
The test above confirms the initial values can be returned from mod_var_input_server() and the result of running test_active_file() on test-mod_var_input.R is below:
[ FAIL 0 | WARN 0 | SKIP 0 | PASS 0 ]
TEST: START [2025-02-06 08:43:46] RETURNED = test_vals vs. session$returned()
[ FAIL 0 | WARN 0 | SKIP 0 | PASS 1 ]
TEST: END [2025-02-06 08:43:47] RETURNED = test_vals vs. session$returned()
17.3 Testing module inputs
Now that we’ve confirmed the variable input module is returning the initial values from the UI, we want to make sure the reactive values are passed correctly into the graph display module. We’ll update our diagram for the module input arguments:
%%{init: {'theme': 'neutral', 'themeVariables': { 'fontFamily': 'monospace', "fontSize":"16px"}}}%%
flowchart
    subgraph VarModule["Variable Module"]
        VarInputs[/"Selected<br>Variables"/]
    end
    subgraph AesModule["Aesthetic Module"]
        AesInputs[/"Selected<br>Aesthetics"/]
    end
    subgraph GraphDisplay["Display Module"]
        ScatterDiplay[\"Graph Display"\]
    end

    VarInputs <-->|"Collects x, y<br>and color"|ScatterDiplay
    AesInputs <-->|"Collects size, <br>alpha and title"|ScatterDiplay
I’ve included the movies_server() function below to refresh our memory of how this should work:
movies_server <- function(input, output, session) {
logr_msg(message = "New user session started", level = "INFO")
tryCatch({
selected_vars <- mod_var_input_server("vars")
}, error = function(e) {
logr_msg(glue::glue("Error in variable selection module: {e$message}"), level = "ERROR")
})
tryCatch({
selected_aes <- mod_aes_input_server("aes")
}, error = function(e) {
logr_msg(glue::glue("Error in aesthetics selection module: {e$message}"),
level = "ERROR")
})
tryCatch({
mod_scatter_display_server("plot",
                          var_inputs = selected_vars,
                          aes_inputs = selected_aes)
}, error = function(e) {
logr_msg(glue::glue("Error in scatter display: {e$message}"),
level = "ERROR")
})
logr_msg(message = "Server function execution completed",
level = "TRACE")
}- 1
-
User session log message
- 2
-
Selected variable inputs
- 3
-
Selected aesthetic inputs
- 4
-
Variables and aesthetics passed to scatter display module
- 5
- Server execution log message
17.3.1 Debugging and testing
Debugging is your friend when you’re writing tests. We covered using browser() and the interactive debugger in the Debuggers chapter. browser() is a powerful tool for interactive debugging during development, and tests ensure long-term stability and reliability. I recommend using both in tandem, because the interactive debugger can help us understand reactivity, and then we can write tests to prevent bugs and errors and confirm fixes.
For example, if we pause execution with the interactive debugger in movies_server(), we can see the difference between calling selected_vars and selected_vars():
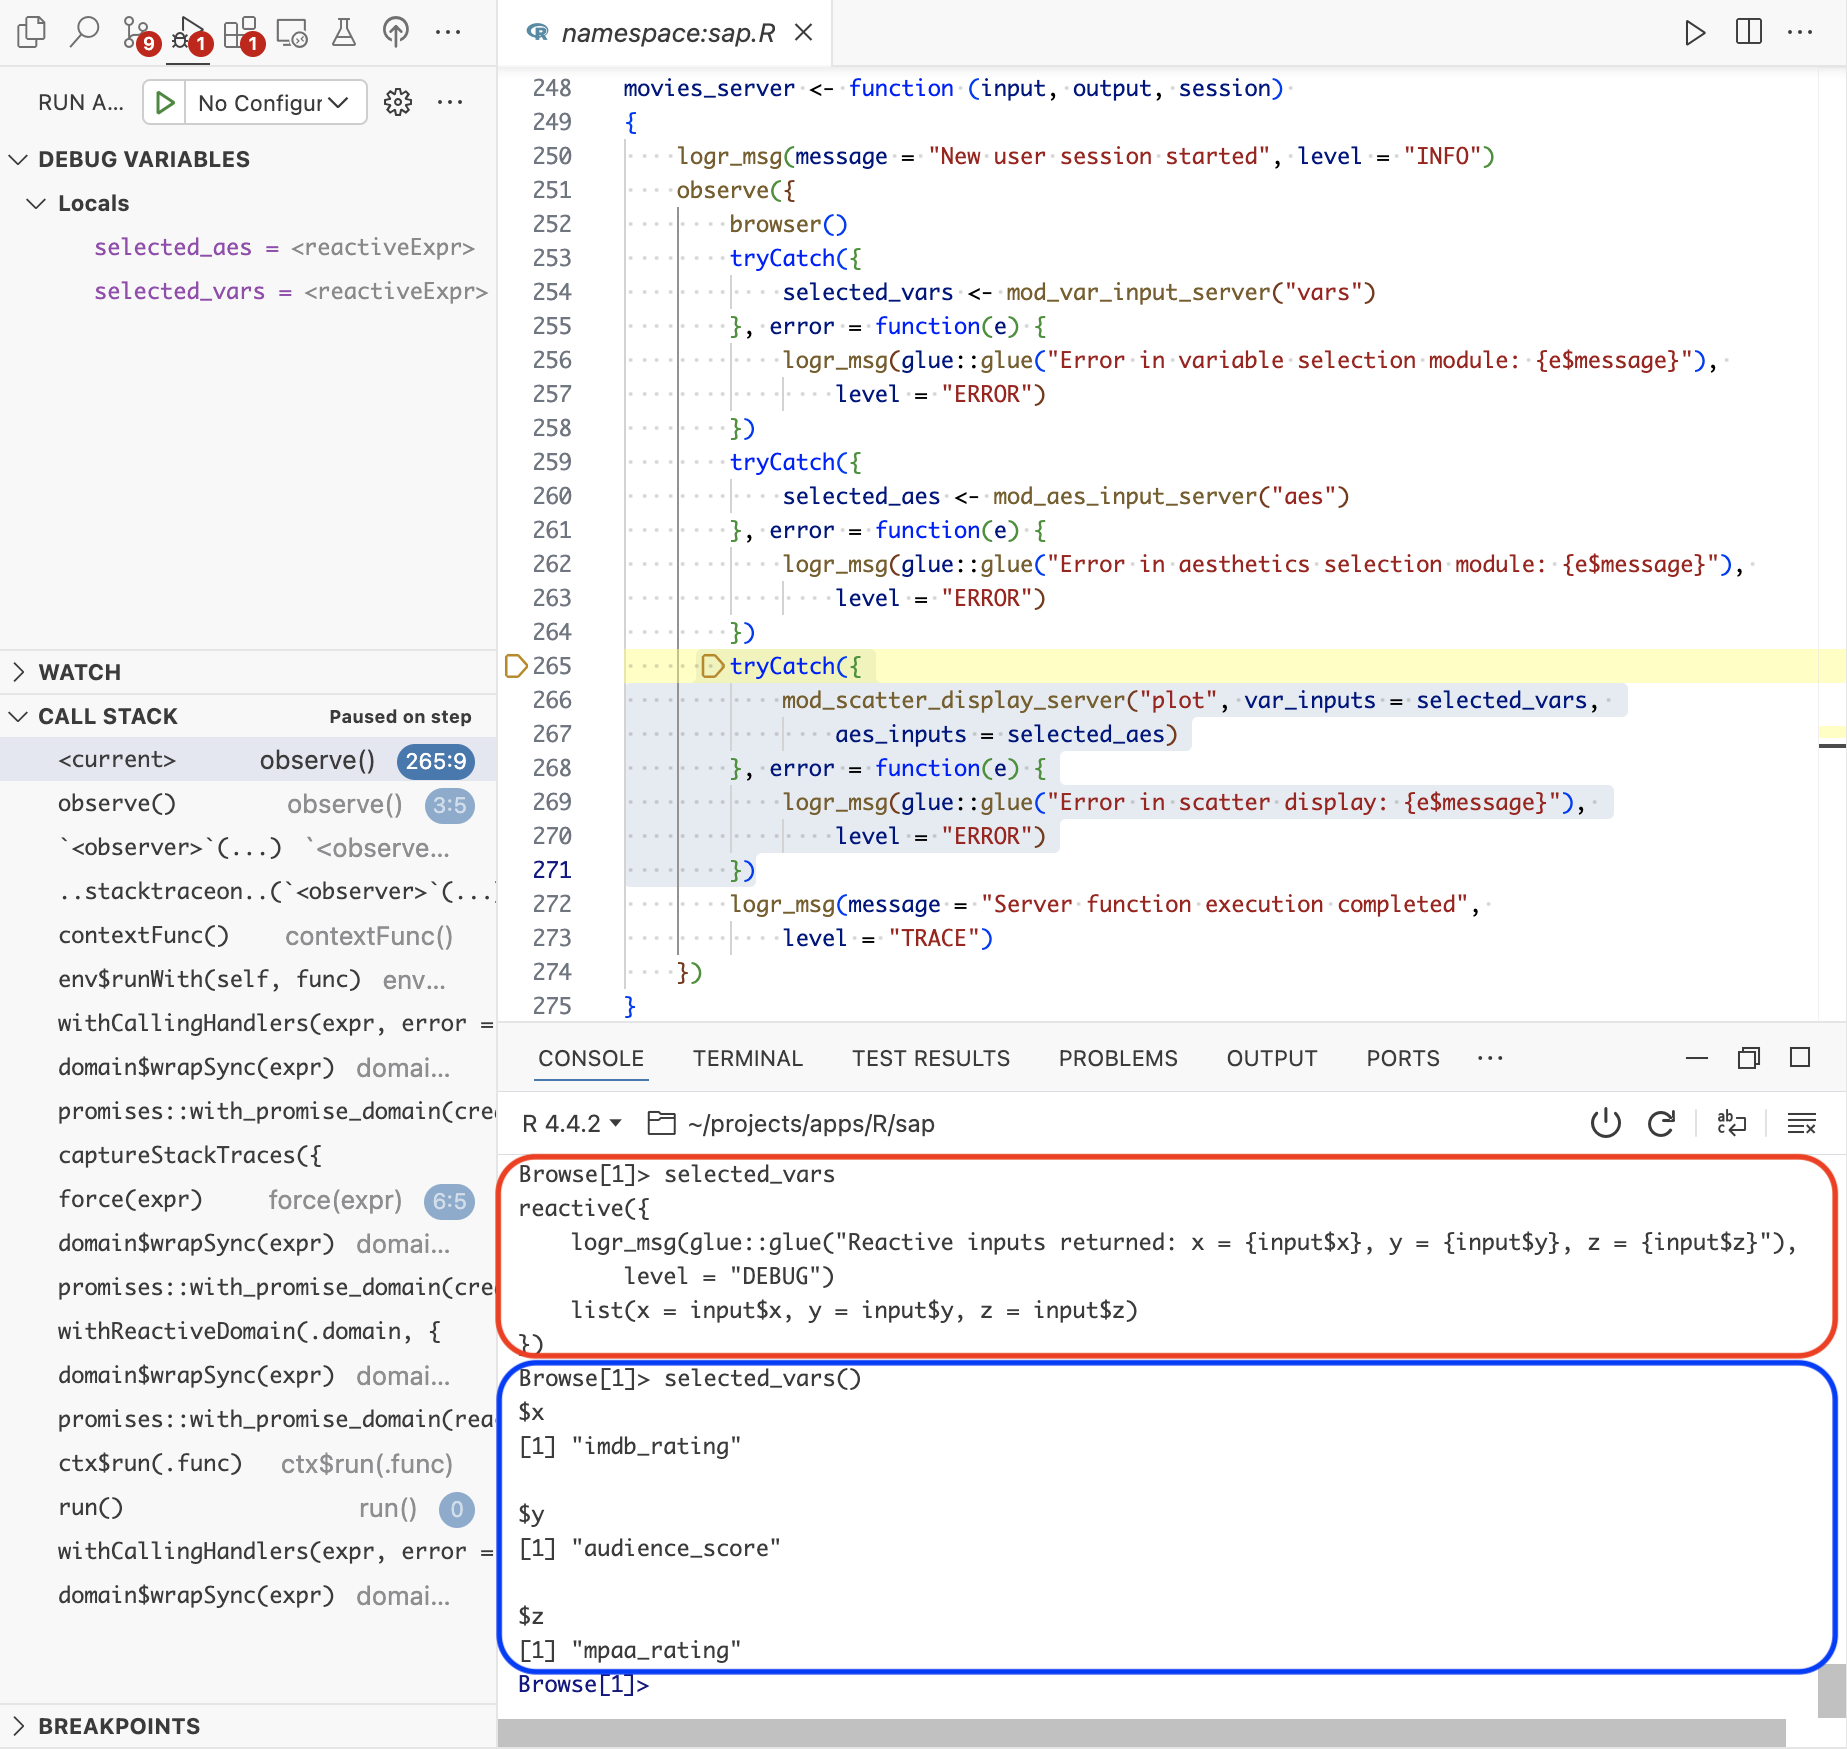
selected_vars vs. selected_vars()When we pass selected_vars and selected_aes to the var_inputs and aes_inputs arguments, we’re not passing the returned values (this is why we don’t need the parentheses).
mod_scatter_display_server("plot",
var_inputs = selected_vars,
aes_inputs = selected_aes)Without the parentheses, we’re calling on the method (or function) created by the call to reactive() (inside mod_var_input_server()).3
Browse[1]> selected_varsreactive({
logr_msg(glue::glue("Reactive inputs returned: x = {input$x}, y = {input$y}, z = {input$z}"),
level = "DEBUG")
list(x = input$x, y = input$y, z = input$z)
}) Viewing selected_vars() in the interactive debugger with the parentheses, we see the actual values from the mod_var_input module:
Browse[1]> selected_vars()$x
[1] "imdb_rating"
$y
[1] "audience_score"
$z
[1] "mpaa_rating"This distinction is important because we need to know what to pass into the var_inputs and aes_inputs arguments when we test the mod_scatter_display_server() function.
We’ll start by writing the feature and scenario for this functionality using testthat’s BDD functions below:
describe(
  "Feature: Scatter Plot Configuration in Movie Review Application
      As a user
      I want the initial graph pre-configured with variables and aesthetics,
      So that I can immediately see a meaningful visualization.",
  code = {
    it(
      "Scenario: Scatter plot initial x, y, color values
         Given the movie review application is loaded
         When I view the initial scatter plot
         Then the scatter plot should show 'IMDB Rating' on the x-axis
         And the scatter plot should show 'Audience Score' on the y-axis
         And the points on the scatter plot should be colored by 'MPAA Rating'
         And the size of the points should be set to '2'
         And the opacity of the points should be set to '0.5'
         And the plot title should be 'New Plot Title'",
      code = {

        # testServer() code

      })
  })
We’re going to break the contents of testServer() down sequentially based on what we saw in the interactive debugger and the functionality of mod_scatter_display_server. We know we’re testing a module function that collects the reactive values, so we need to wrap those values in reactive() in the args() argument: 4
shiny::testServer(
app = mod_scatter_display_server,
args = list(
var_inputs =
reactive(
list(
x = "critics_score",
y = "imdb_rating",
z = "mpaa_rating"
)
),
aes_inputs =
reactive(
list(
alpha = 0.5,
size = 2,
plot_title = "enter plot title"
)
)
),
expr = {
})- 1
-
var_inputsargument inmod_scatter_display_server - 2
-
aes_inputsargument inmod_scatter_display_server - 3
-
List of reactive variable inputs
- 4
- List of reactive aesthetic inputs
We know that inside mod_scatter_display_server, the values collected from var_inputs and aes_inputs are assembled into a single inputs() reactive. We also know the plot title will be converted to title case before it’s rendered in the UI, so we need to account for this in the expected values.
shiny::testServer(
app = mod_scatter_display_server,
args = list(
var_inputs =
reactive(
list(
x = "critics_score",
y = "imdb_rating",
z = "mpaa_rating"
)
),
aes_inputs =
reactive(
list(
alpha = 0.5,
size = 2,
plot_title = "enter plot title"
)
)
),
expr = {
test_logger(start = "COLLECT", msg = "collected module values")
expect_equal(
object = inputs(),
expected = list(
x = "critics_score",
y = "imdb_rating",
z = "mpaa_rating",
alpha = 0.5,
size = 2,
plot_title = "Enter Plot Title"
)
)
test_logger(end = "COLLECT", msg = "collected module values")
})- 1
-
var_inputsargument inmod_scatter_display_server - 2
-
aes_inputsargument inmod_scatter_display_server - 3
-
List of reactive variable inputs
- 4
- List of reactive aesthetic inputs
- 5
-
Compare
inputs()to initial values
- 6
- Title case plot title
The test_logger() can tell us when the expr begins (so we can assume there aren’t errors in the input arguments to args list).
devtools::test_active_file()[ FAIL 0 | WARN 0 | SKIP 0 | PASS 0 ]
TEST: START [2025-02-06 08:20:36] COLLECT = collected module values
[ FAIL 0 | WARN 0 | SKIP 0 | PASS 1 ]
TEST: END [2025-02-06 08:20:36] COLLECT = collected module valuesI’ve included the example above because it’s not included on the testServer() documentation, and I’ve found this method works well if you want to confirm two modules are communicating (i.e., returning and collecting outputs). System test with shinytest2 are a better option if we’re trying to capture a more comprehensive execution path (i.e., user scenario) in the application.
17.4 Module test coverage
When we check the code coverage for the test above, we can see it confirms var_inputs is communicating the reactive values to inputs() in mod_scatter_display_server(), but this test doesn’t execute the call to plotOutput():
Ctrl/Cmd + Shift + R
devtools:::test_coverage_active_file()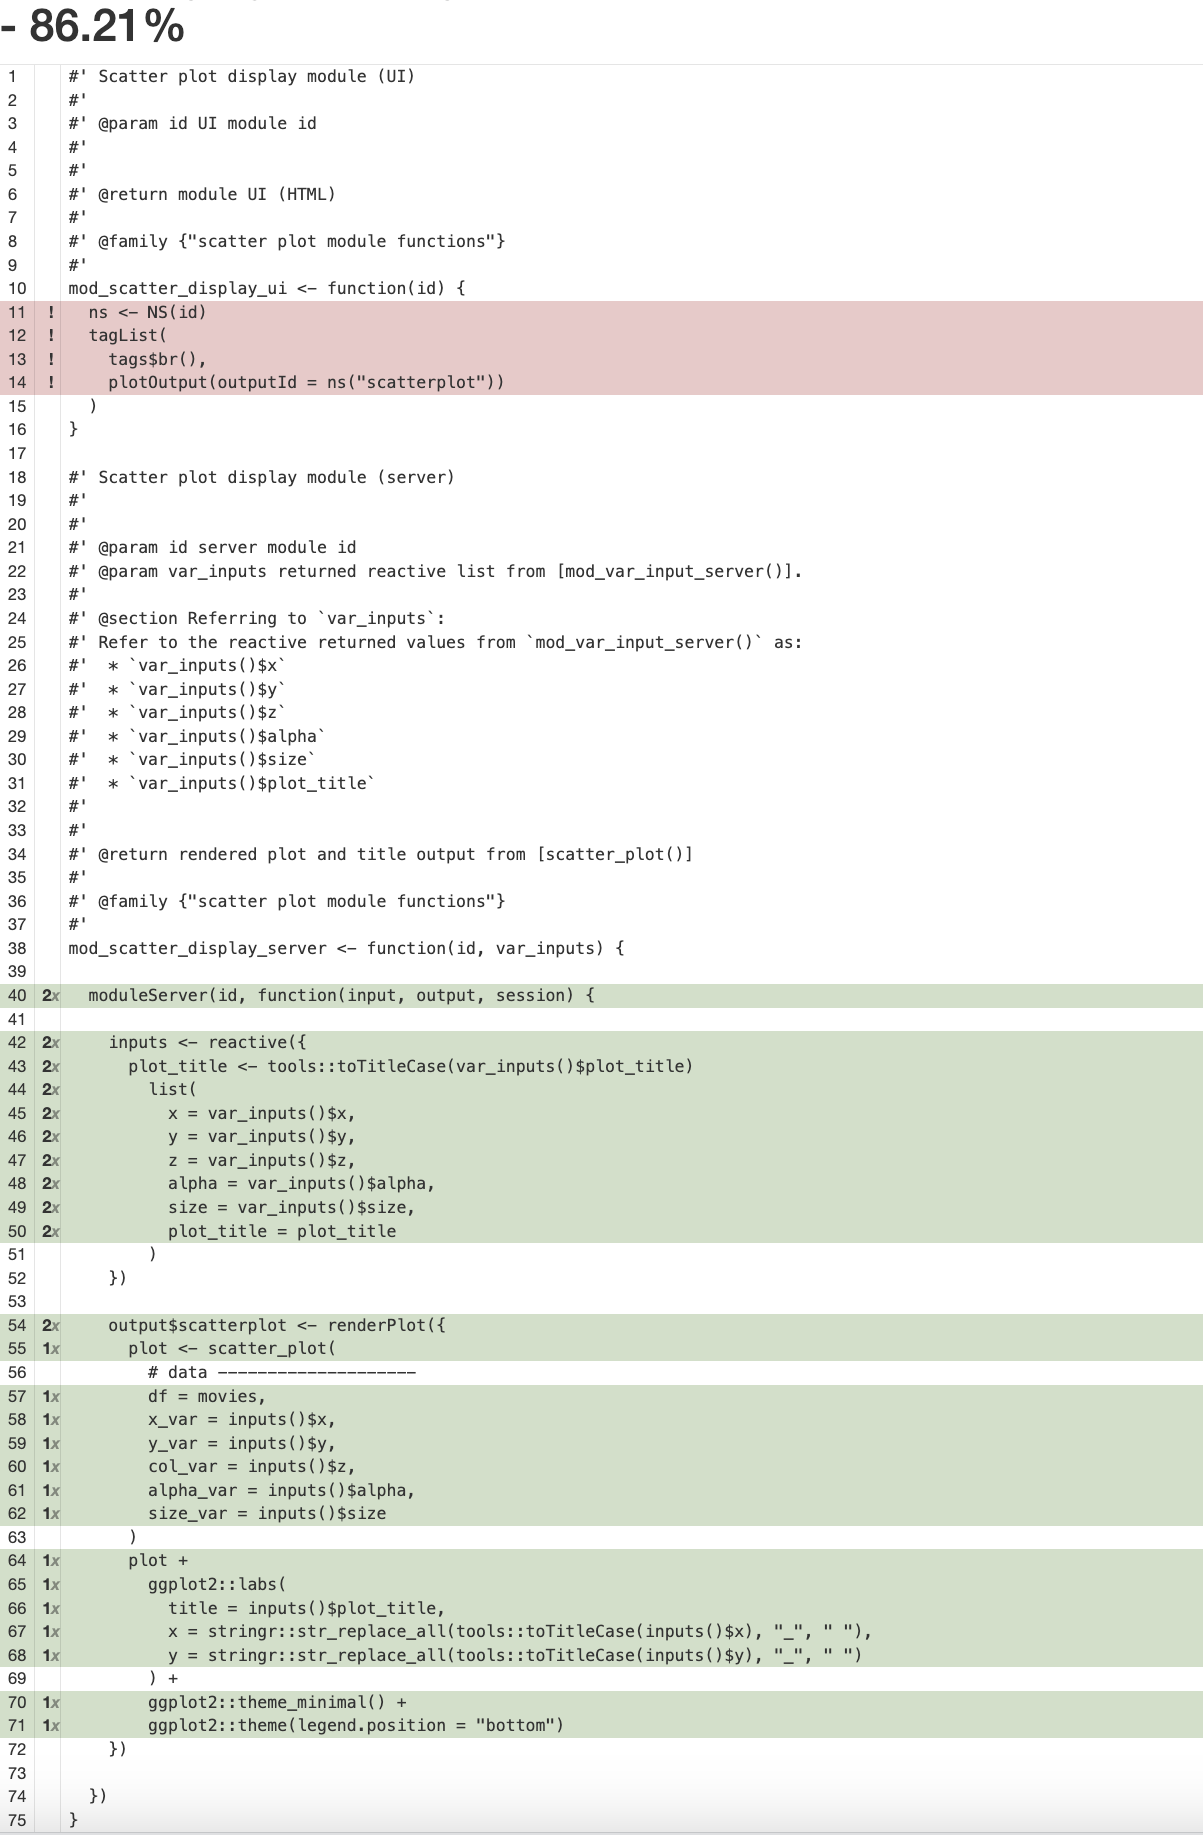
17.4.1 Testing module outputs
To confirm the plot is being created properly in mod_scatter_display_server(), we can’t use the ggplot2::is_ggplot() function because the plot is being rendered by renderPlot(). However, we can verify the structure of the output$scatterplot object using any of the following expectations:
expect_true(
  object = is.list(output$scatterplot))

expect_equal(
  object = names(output$scatterplot),
  expected = c("src", "width", "height", "alt", "coordmap"))

expect_equal(
  object = output$scatterplot[["alt"]],
  expected = "Plot object")
It’s also possible to build the graph inside the test using the same code from the module server function, then confirm it with ggplot2::is_ggplot():
plot <- scatter_plot(movies,
x_var = inputs()$x,
y_var = inputs()$y,
col_var = inputs()$z,
alpha_var = inputs()$alpha,
size_var = inputs()$size) +
ggplot2::labs(
title = inputs()$plot_title,
x = stringr::str_replace_all(
tools::toTitleCase(inputs()$x), "_", " "),
y = stringr::str_replace_all(
tools::toTitleCase(inputs()$y), "_", " ")) +
ggplot2::theme_minimal() +
ggplot2::theme(legend.position = "bottom")
testthat::expect_true(ggplot2::is_ggplot(plot))- 1
-
Build graph (same code from module function)
- 2
-
Confirm
ggplot2object is built
If we’re still skeptical this test is confirming the plot is being built correctly, we can pass plot to print() in the test and the plot will appear in the Plots pane.
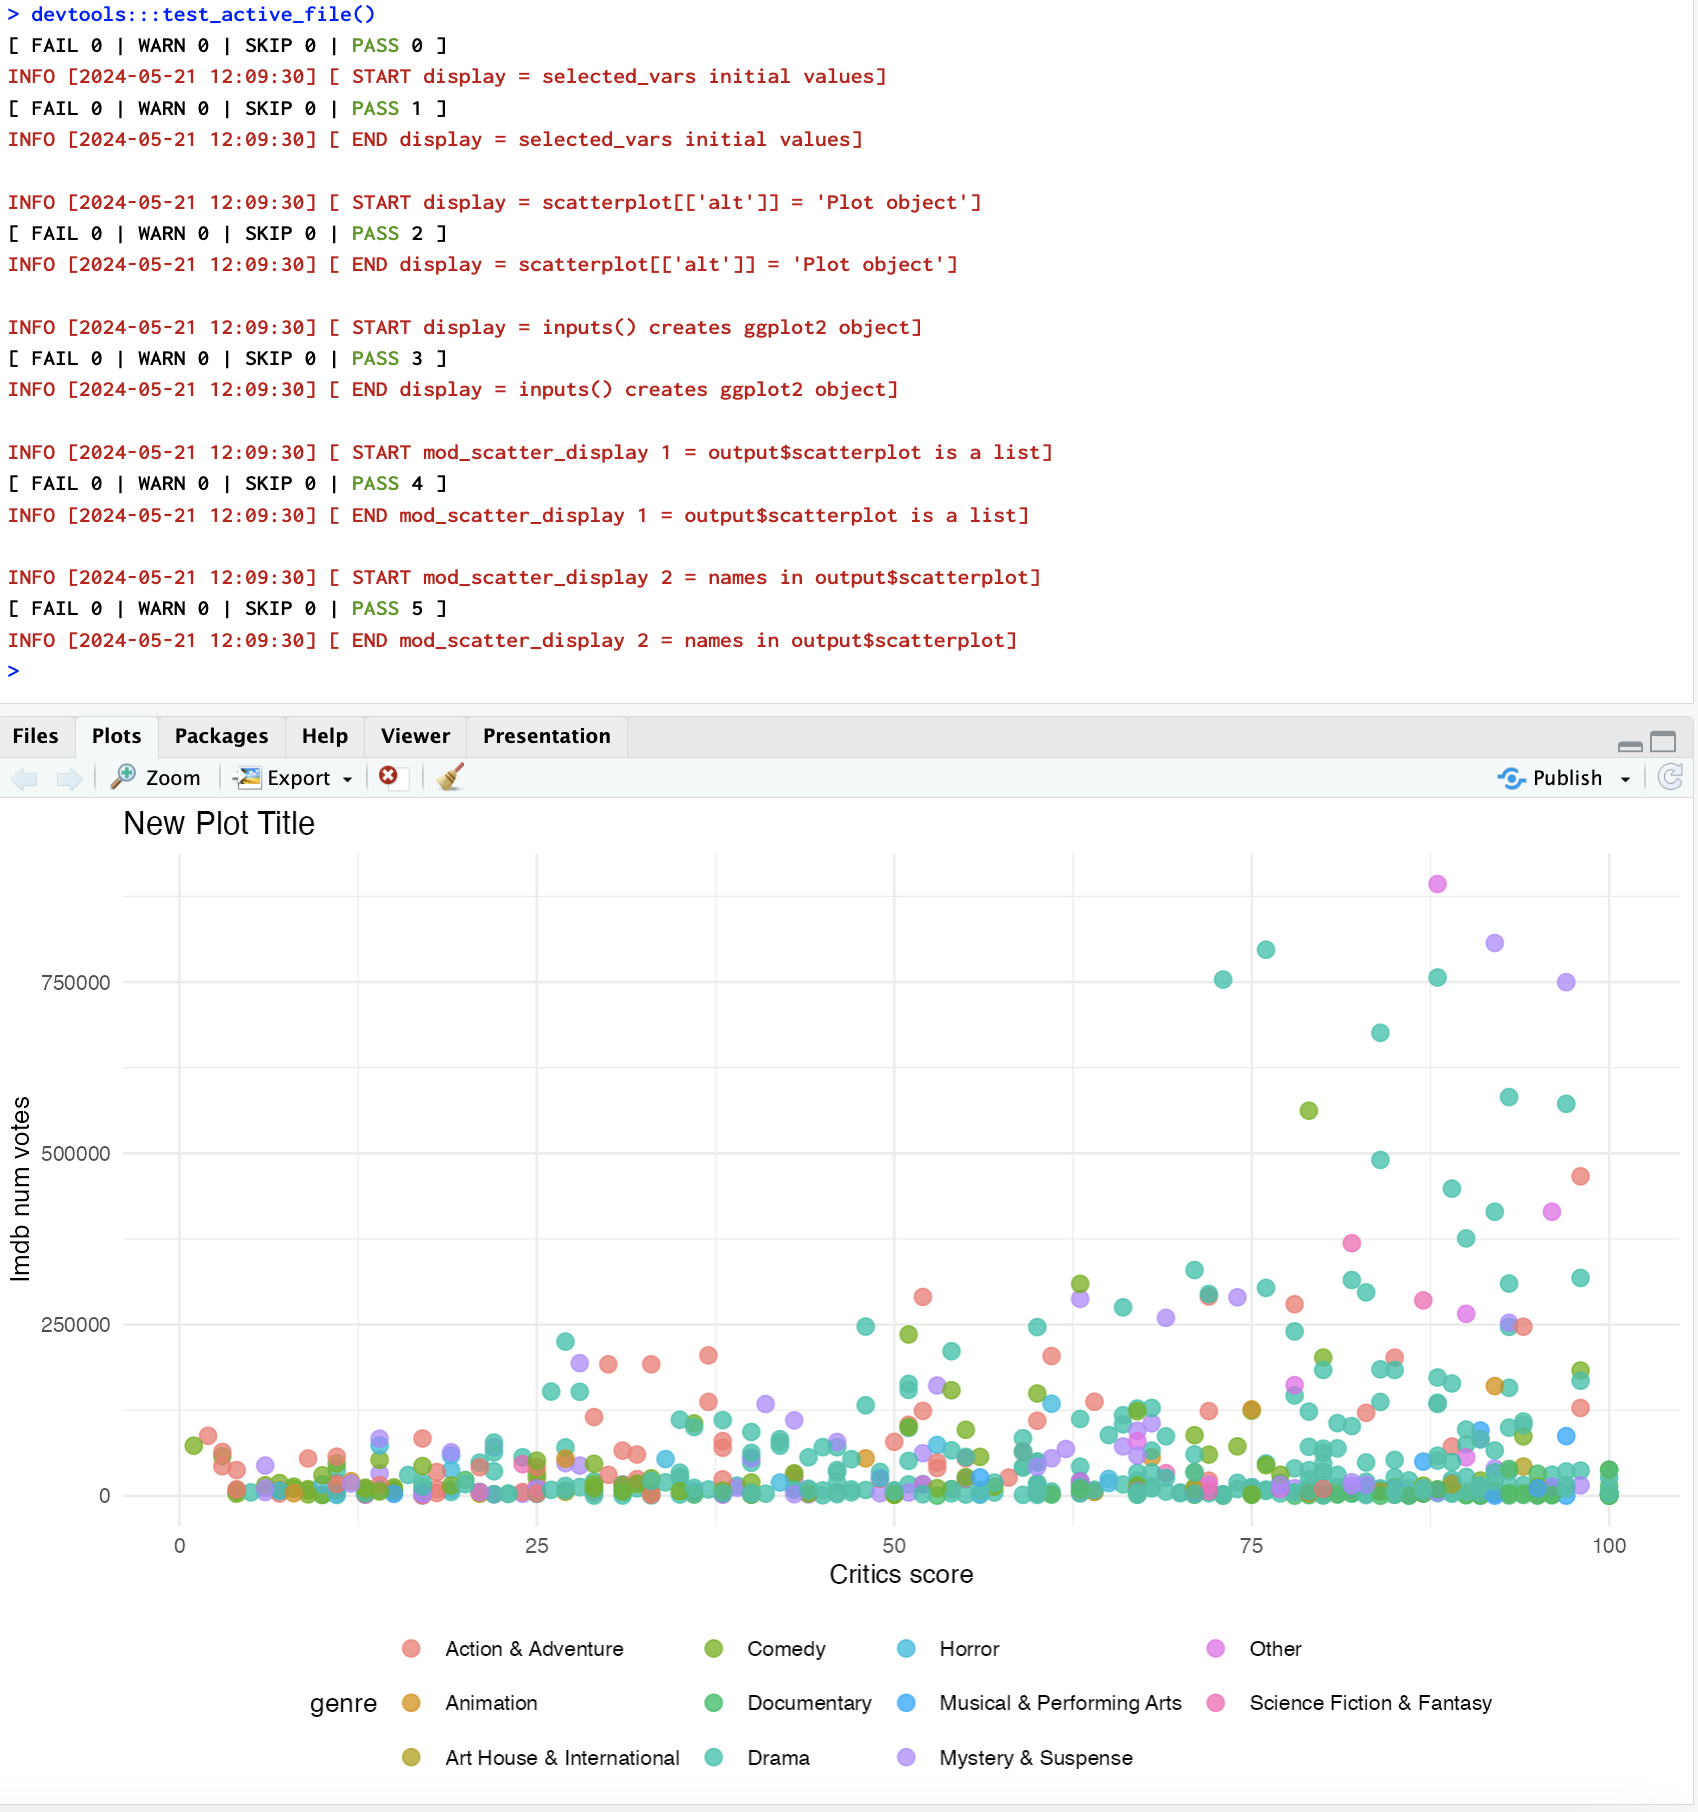
plot to print() will send the graph to the Plots paneRecap
Read more about returned values in the section titled, ‘Modules with return values’ in the Shiny documentation.↩︎
Read more about flushing reactive values in the section titled, ‘Flushing Reactives’ in the Shiny documentation.↩︎
selected_varsare the reactive variable names returned frommod_var_input_server()andselected_aesare the reactive size, alpha, and title values returned frommod_aes_input_server().↩︎Read more about adding parameters to
testServer()in the section titled, ‘Modules with additional parameters’ in the Shiny documentation.↩︎