# install.packages('pak')
pak::pak('mjfrigaard/shinypak')18 Exploring code
When used as an exploratory tool, the debugger allows us to ‘look inside’ functions and break down their execution line-by-line.
observe() and browser() aren’t only useful for addressing bugs–we can also use the debugger to understand how an application works.
Suppose it’s been awhile since we’ve looked at the ggplot2movies::movies application (run with ggp2_movies_app()). We can place calls to observe(browser()) in the inst/dev/app.R file, load the package, and run the application to see how it executes.
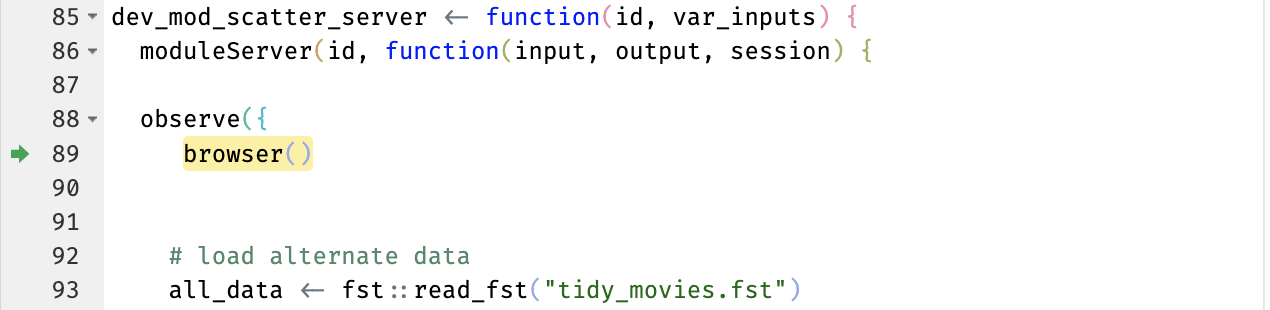
We’ll wrap the code in dev_mod_scatter_server() in observe(), and place a call to browser() before the alternate dataset is loaded:
dev_mod_scatter_server <- function(id, var_inputs) {
moduleServer(id, function(input, output, session) {
observe({
browser()
# load alternate data
all_data <- fst::read_fst("tidy_movies.fst")
})
})
}- 1
-
Observer scope
- 2
-
Call to
browser()
- 3
- Additional module code omitted
Load the package and run the app:
Ctrl/Cmd + Shift + L
ℹ Loading sapggp2_movies_app(options = list(test.mode = FALSE), run = 'p')This will suspend the execution of application before the tidy ggplot2movies::movies data are loaded (tidy_movies.fst), and before the graph is rendered:
dev_mod_scatter_server()
ggp2_movies_app() in interactive debuggerWe can step through the module function to explore how the alternate data are loaded (and missing values are removed).
18.1 Verify app data
First we’ll proceed through the code until tidy_movies.fst is loaded, then confirm it’s structure:
Browse[2]> n
Browse[2]> n
Browse[2]> str(all_data)'data.frame': 46002 obs. of 8 variables:
$ title : chr "'Til There Was You" ...
$ length : int 113 97 98 98 102 120 ...
$ year : int 1997 1999 2002 2004 ...
$ budget : int 23000000 16000000 ...
$ avg_rating: num 4.8 6.7 5.6 6.4 6.1 ...
$ votes : int 799 19095 181 7859 ...
$ mpaa : Factor w/ 5 levels "G","PG" ...
$ genre : Factor w/ 8 levels "Action"...This gives us an idea of the total rows before missing are removed.
18.2 Verfiy missing
After loading all_data, the module creates a reactive graph_data(). We can see graph_data() is ‘bound’ to input$missing, so we’ll confirm the input$missing value:
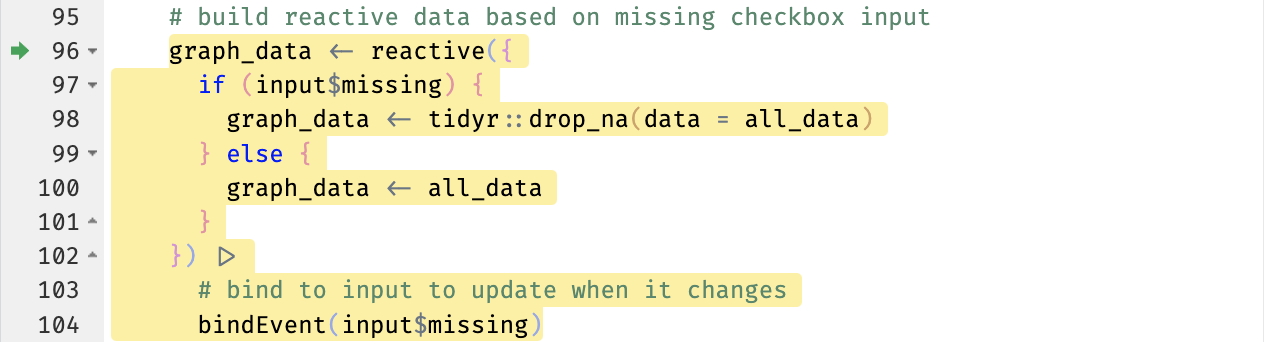
Browse[2]> input$missing[1] TRUEThis tells us ‘Remove missing’ has been selected, and we can verify the missing values have been removed from graph_data():
Browse[2]> n
Browse[2]> str(graph_data())'data.frame': 1608 obs. of 8 variables:
$ title : chr "'Til There Was You" ...
$ length : int 113 97 98 98 102 120 ...
$ year : int 1997 1999 2002 2004 ...
$ budget : int 23000000 16000000 ...
$ avg_rating: num 4.8 6.7 5.6 6.4 6.1 ...
$ votes : int 799 19095 181 7859 ...
$ mpaa : Factor w/ 5 levels "G","PG" ...
$ genre : Factor w/ 8 levels "Action"...18.3 Verfiy variable inputs
Next we’ll confirm the var_inputs() list of graph values from our dev variable input module:
Browse[2]> str(var_inputs())List of 6
$ x : chr "year"
$ y : chr "budget"
$ z : chr "mpaa"
$ alpha : num 0.4
$ size : num 2.5
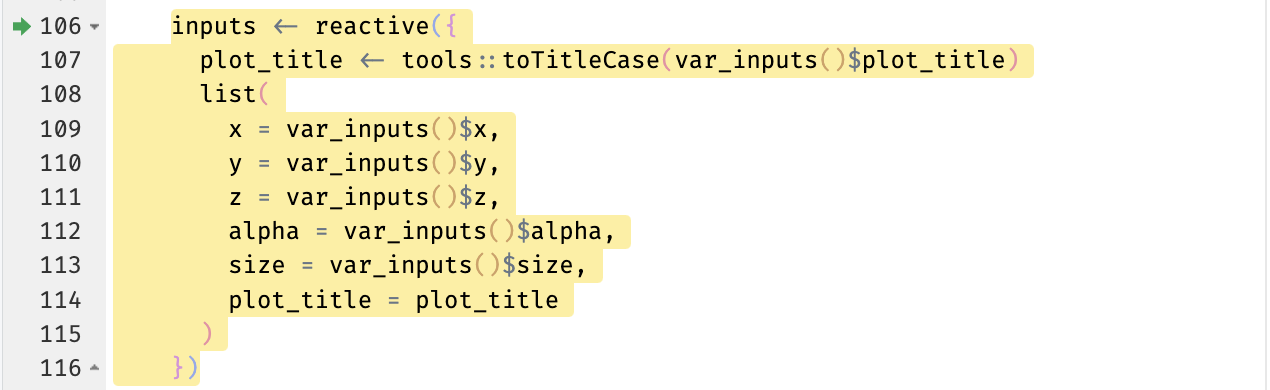
$ plot_title: chr ""var_inputs() is creates the inputs() reactive for the graph, so we’ll confirm those values, too.
Browse[2]> n
Browse[2]> str(inputs())
List of 6
$ x : chr "year"
$ y : chr "budget"
$ z : chr "mpaa"
$ alpha : num 0.4
$ size : num 2.5
$ plot_title: chr ""18.4 Verfiy graph
Now that we have an understanding of the reactive flow inside the app, we’ll render the plot:
Browse[2]> n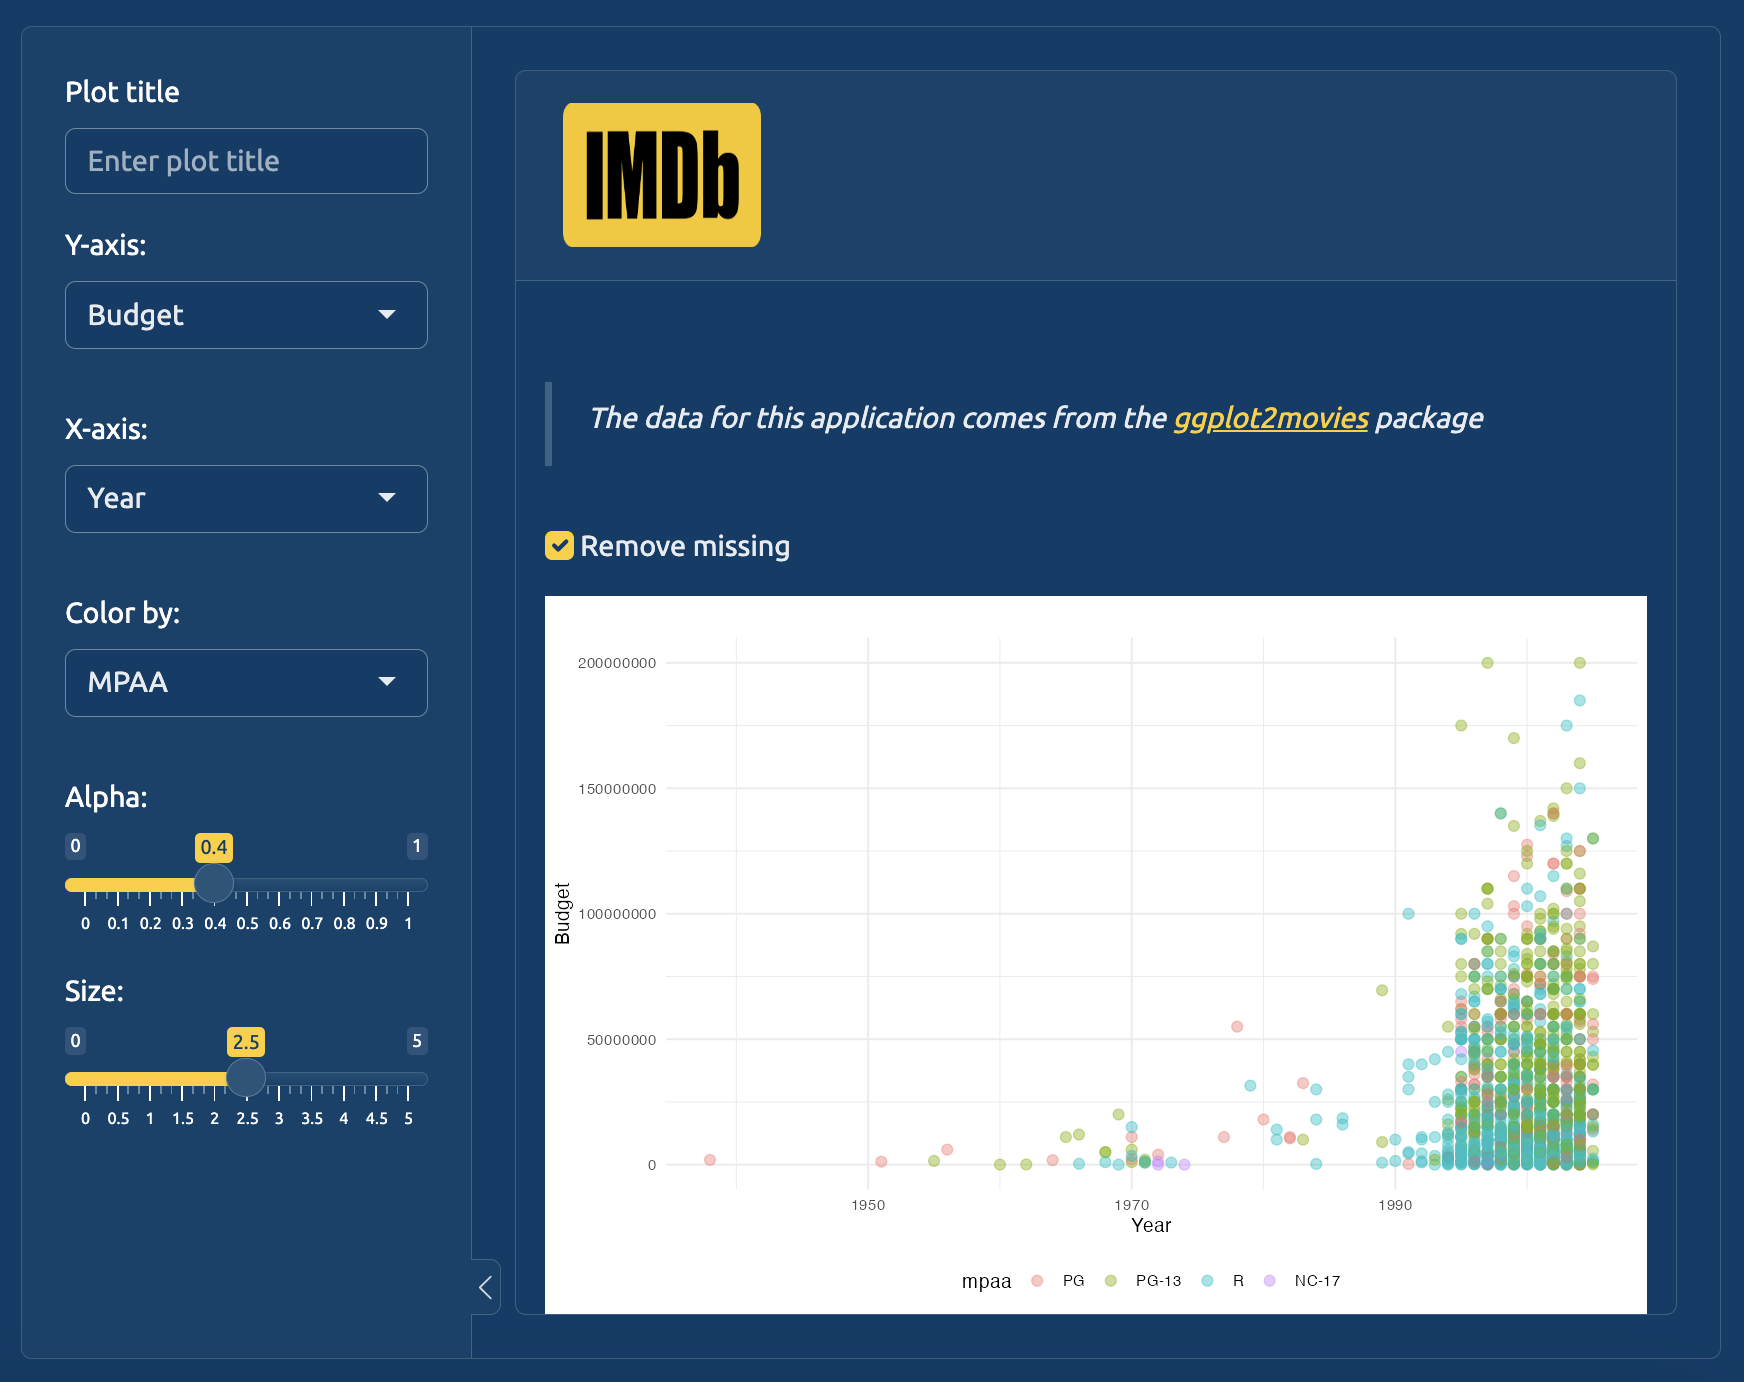
Using browser() to ‘step through’ an application gives us a better understanding of the ‘order of execution’ in our dev scatter plot display module, (and it lets us see how input$missing and bindEvent() are working).
Recap
Watch this video to learn about call stacks and abstract folder trees with
lobstr.↩︎Stack traces are also covered in Advanced R, 2ed, Mastering Shiny, and in the Shiny documentation. I’ve summarized some tips on reading Shiny call stacks in the stack traces section on the Appendix.↩︎