%%{init: {'theme': 'neutral', 'themeVariables': { 'fontFamily': 'monospace', "fontSize":"16px"}}}%%
flowchart TD
User(["User"])
mod_var_input_ui["<strong>mod_var_input_ui()</strong>"]
mod_aes_input_ui["<strong>mod_aes_input_ui()</strong>"]
subgraph mod_var_input_server["<strong>mod_var_input_server()</strong>"]
VarReactives[/"input$x<br>input$y<br>input$z"/]
end
subgraph mod_aes_input_server["<strong>mod_aes_input_server()</strong>"]
AesReactives[/"input$alpha<br>input$size<br>input$plot_title"/]
end
selected_vars[/"selected variables"/]
selected_aes[/"selected aesthetics"/]
User --> |"<em>Selects X, Y, and Color...</em>"|mod_var_input_ui
User --> |"<em>Selects Size, Alpha and optional Title...</em>"|mod_aes_input_ui
mod_var_input_ui --> |"<em>Collects<br>variables...</em>"|mod_var_input_server
mod_aes_input_ui --> |"<em>Collects aesthetics...</em>"|mod_aes_input_server
VarReactives --> selected_vars
AesReactives --> selected_aes
style mod_var_input_ui stroke-width:2px,rx:3,ry:3
style mod_aes_input_ui stroke-width:2px,rx:3,ry:3
style mod_var_input_server stroke-width:2px,rx:3,ry:3
style mod_aes_input_server stroke-width:2px,rx:3,ry:3
style VarReactives font-size: 14px
style AesReactives font-size: 14px
12 Debugging apps
Note TLDR: Debugging apps
Combining the interactive debugger and print debugging lets us effectively inspect a module’s reactive inputs.
In the interactive debugger, passing a reactive value without the parentheses displays the method (i.e., the function).
Browse[1]> str(selected_aes)
# function ()
#  - attr(*, "observable")=Classes 'Observable', 'R6' reactive({
#     list(alpha = input$alpha, size = input$size, plot_title = input$x)
# })
#  - attr(*, "cacheHint")=List of 1
#   ..$ userExpr: language {  list(alpha = input$alpha, size = input$size,
#       plot_title = input$x) }
#  - attr(*, "class")= chr [1:3] "reactiveExpr" "reactive" "function"
Including parentheses will display the actual values.
Browse[1]> str(selected_aes())
# List of 3
#  $ alpha     : num 0.5
#  $ size      : int 2
#  $ plot_title: chr ""
In the previous chapters we demonstrated how to:
- Wrap the call to
browser()in anobserve()scope for interactive debugging
- Capture and print reactive inputs in the UI with
reactiveValuesToList(),verbatimTextOutput(), andrenderPrint()
This chapter covers using abstract syntax trees to help understand the structure of an application’s modules, and how to use the two previously described debugging methods to understand bugs and errors.
12.1 Abstract syntax trees
Shiny app-packages can quickly become a complex and intertwined web of functions: utility functions, modules, user interface (UI) elements, server logic, etc. Before we jump into debugging modules, we’ll revisit their function and purpose by considering the following description of namespaces from the NS() function documentation:
“a namespace is to an ID as a directory is to a file.”
To visualize the hierarchical relationship between the functions in our app, we’ll use abstract syntax trees (ast()) from the lobstr package.1
For example, launch_app() calls the display_type() utility function, then movies_ui() and movies_server():
█─launch_app
├─█─display_type
├─█─movies_ui
└─█─movies_server
movies_ui() and movies_server() call their respective UI and server module functions:
█─launch_app
├─█─display_type
├─█─movies_ui
│ ├─█─mod_var_input_ui
│ └─█─mod_scatter_display_ui
└─█─movies_server
  ├─█─mod_var_input_server
  └─█─mod_scatter_display_server
And mod_scatter_display_server() calls the scatter_plot() utility function:
█─launch_app
├─█─display_type
├─█─movies_ui
│ ├─█─mod_var_input_ui
│ └─█─mod_scatter_display_ui
└─█─movies_server
  ├─█─mod_var_input_server
  └─█─mod_scatter_display_server
    └─█─scatter_plot
Abstract folder trees can be used to help construct a simplified call stack for applications (especially if we are using multiple utility functions or nested modules).
12.2 Debugging modules
In this branch of sap, the inputs has been split into two separate modules: variable inputs and aesthetic inputs. The variable input module collects and returns the selected columns from the movies data, and the aesthetics input module collects and returns the alpha, point size, and (optional) graph title.
This updates our abstract syntax tree to the following:
█─launch_app
├─█─display_type
├─█─movies_ui
│ ├─█─mod_var_input_ui
│ ├─█─mod_aes_input_ui
│ └─█─mod_scatter_display_ui
└─█─movies_server
  ├─█─mod_var_input_server
  ├─█─mod_aes_input_server
  └─█─mod_scatter_display_server
    └─█─scatter_plot
12.2.1 Input modules
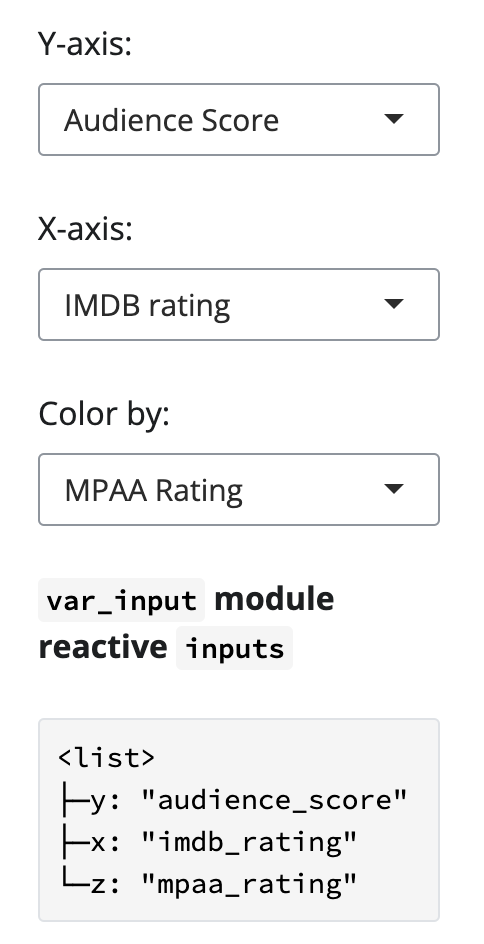
The diagram below illustrates the changes to the variable input module.
mod_var_input_ui(): Our variable input module will now only collect the x, y, and color variables from the movies data.
show/hide R/mod_var_input.R
mod_var_input_ui <- function(id) {
ns <- NS(id)
tagList(
selectInput(
inputId = ns("y"),
label = "Y-axis:",
choices = c(
"IMDB rating" = "imdb_rating",
"IMDB number of votes" = "imdb_num_votes",
"Critics Score" = "critics_score",
"Audience Score" = "audience_score",
"Runtime" = "runtime"
),
selected = "audience_score"
),
selectInput(
inputId = ns("x"),
label = "X-axis:",
choices = c(
"IMDB rating" = "imdb_rating",
"IMDB number of votes" = "imdb_num_votes",
"Critics Score" = "critics_score",
"Audience Score" = "audience_score",
"Runtime" = "runtime"
),
selected = "imdb_rating"
),
selectInput(
inputId = ns("z"),
label = "Color by:",
choices = c(
"Title Type" = "title_type",
"Genre" = "genre",
"MPAA Rating" = "mpaa_rating",
"Critics Rating" = "critics_rating",
"Audience Rating" = "audience_rating"
),
selected = "mpaa_rating"
)
)
}
mod_var_input_server <- function(id) {
moduleServer(id, function(input, output, session) {
return(
reactive({
list(
"y" = input$y,
"x" = input$x,
"z" = input$z
)
})
)
})
}- 1
-
Returned x axis variable
- 2
-
Returned y axis variable
- 3
- Returned color variable
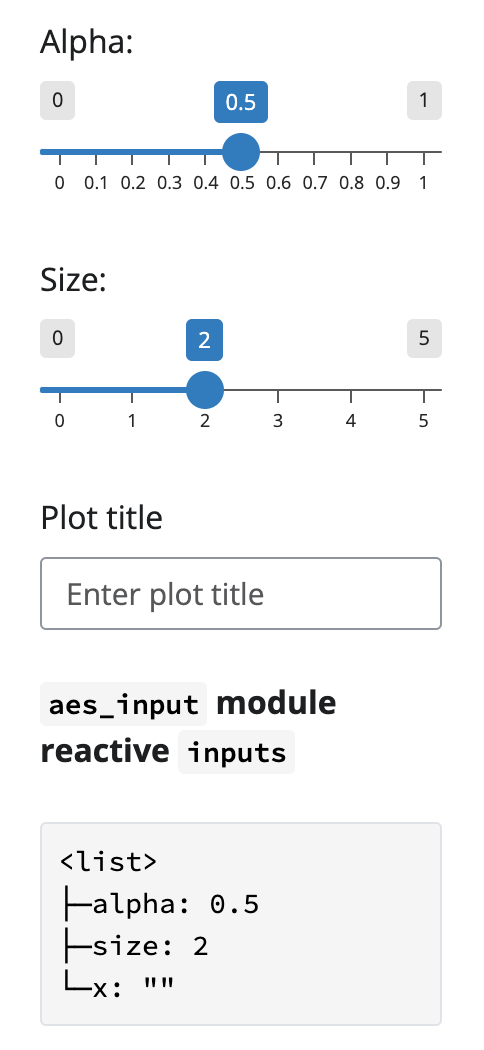
mod_aes_input_ui(): The new aesthetic input module will collect the alpha, size, and optional plot title values.
show/hide R/mod_aes_input.R
mod_aes_input_ui <- function(id) {
ns <- NS(id)
tagList(
sliderInput(
inputId = ns("alpha"),
label = "Alpha:",
min = 0, max = 1, step = 0.1,
value = 0.5
),
sliderInput(
inputId = ns("size"),
label = "Size:",
min = 0, max = 5,
value = 2
),
textInput(
inputId = ns("x"),
label = "Plot title",
placeholder = "Enter plot title"
)
)
}
mod_aes_input_server <- function(id) {
moduleServer(id, function(input, output, session) {
return(
reactive({
list(
"alpha" = input$alpha,
"size" = input$size,
"plot_title" = input$x
)
})
)
})
}- 1
-
Returned alpha aesthetic
- 2
-
Returned size aesthetic
- 3
- Returned plot title
Each module will have a dedicated namespace inside the movies_ui() and movies_server() functions, but this requires a minor adjustment to the mod_scatter_display_server() and movies_server() functions:
mod_scatter_display_server(): We need to adjust the function arguments and the creation of the inputs() reactive:
show/hide mod_scatter_display_server()
mod_scatter_display_server <- function(id, var_inputs, aes_inputs) {
moduleServer(id, function(input, output, session) {
inputs <- reactive({
plot_title <- tools::toTitleCase(aes_inputs()$plot_title)
list(
x = var_inputs()$x,
y = var_inputs()$y,
z = var_inputs()$z,
alpha = aes_inputs()$alpha,
size = aes_inputs()$size,
plot_title = plot_title
)
})
output$scatterplot <- renderPlot({
plot <- scatter_plot(
# data --------------------
df = movies,
x_var = inputs()$x,
y_var = inputs()$y,
col_var = inputs()$z,
alpha_var = inputs()$alpha,
size_var = inputs()$size
)
plot +
ggplot2::labs(
title = inputs()$plot_title,
x = stringr::str_replace_all(tools::toTitleCase(inputs()$x), "_", " "),
y = stringr::str_replace_all(tools::toTitleCase(inputs()$y), "_", " ")
) +
ggplot2::theme_minimal() +
ggplot2::theme(legend.position = "bottom")
})
})
}- 1
-
Add function argument for aesthetics
- 2
-
Optional title input
- 3
-
Alpha and size inputs
- 4
- Variable reactive inputs
movies_server(): We now have two reactive variables: the selected_vars and selected_aes:
show/hide
movies_server <- function(input, output, session) {
selected_vars <- mod_var_input_server("vars")
selected_aes <- mod_aes_input_server("aes")
mod_scatter_display_server("plot",
var_inputs = selected_vars,
aes_inputs = selected_aes)
}- 1
-
Collected variable inputs
- 2
-
Collected aesthetic inputs
- 3
-
Variable input argument for graph display
- 4
- Aesthetic input argument for graph display
The diagram below illustrates the changes to the functions above:
%%{init: {'theme': 'neutral', 'themeVariables': { 'fontFamily': 'monospace', "fontSize":"14px"}}}%%
flowchart TD
    User(["<strong>User</strong>"])
    mod_var_input_ui["<strong>mod_var_input_ui()</strong>"]
    mod_aes_input_ui["<strong>mod_aes_input_ui()</strong>"]
    mod_scatter_display_ui["<strong>mod_scatter_display_ui</strong>"]

    subgraph mod_scatter_display_server["<strong>mod_scatter_display_server()</strong>"]
        var_inputs[\"var_inputs"\]
        aes_inputs[\"aes_inputs"\]
        inputs[/"inputs()"/]
        scatter_plot("scatter_plot()")
    end

    subgraph mod_var_input_server["<strong>mod_var_input_server()</strong>"]
        VarReactives[/"input$x<br>input$y<br>input$z"/]
    end
    subgraph mod_aes_input_server["<strong>mod_aes_input_server()</strong>"]
        AesReactives[/"input$alpha<br>input$size<br>input$plot_title"/]
    end

    selected_vars[/"selected variables"/]
    selected_aes[/"selected aesthetics"/]

    User --> |"<em>Selects X, Y, and Color...</em>"|mod_var_input_ui
    User --> |"<em>Selects Size, Alpha and optional Title...</em>"|mod_aes_input_ui
    mod_var_input_ui --> |"<em>Collects<br>variables...</em>"|mod_var_input_server
    mod_aes_input_ui --> |"<em>Collects aesthetics...</em>"|mod_aes_input_server
    VarReactives ==> selected_vars
    AesReactives ==> selected_aes
    selected_vars ==>|"<em>Input argument for...</em>"|var_inputs
    selected_aes ==>|"<em>Input argument for...</em>"|aes_inputs
    var_inputs & aes_inputs --> inputs --> scatter_plot
    scatter_plot -->|"<em>Renders plot...</em>"|mod_scatter_display_ui
    mod_scatter_display_ui -->|"<em>Displays output...</em>"|Display(["<strong>Graph</strong>"])

    style User font-size:18px
    style Display font-size:18px

    style mod_scatter_display_ui fill:#eee,font-size:13px,stroke-width:1px,rx:3,ry:3
    style mod_scatter_display_server fill:#eee,font-size:13px,stroke-width:1px,rx:3,ry:3
    style mod_var_input_server fill:#eee,font-size:14px,stroke-width:1px,rx:3,ry:3
    style mod_var_input_ui fill:#eee,font-size:14px,stroke-width:1px,rx:3,ry:3
    style mod_aes_input_server fill:#eee,font-size:14px,stroke-width:1px,rx:3,ry:3
    style mod_aes_input_ui fill:#eee,font-size:14px,stroke-width:1px,rx:3,ry:3

    style AesReactives fill:#fff,stroke:#bbb,stroke-width:2px
    style VarReactives fill:#fff,stroke:#bbb,stroke-width:2px
    style selected_vars fill:#fff,stroke:#000,stroke-width:2px
    style selected_aes fill:#fff,stroke:#000,stroke-width:2px
    style var_inputs fill:#fff,stroke:#bbb,stroke-width:2px
    style aes_inputs fill:#fff,stroke:#bbb,stroke-width:2px
    style inputs fill:#fff,stroke:#bbb,stroke-width:2px

    style scatter_plot fill:#444,color:#FFF,stroke:#000,stroke-width:2px,rx:10,ry:10

    style VarReactives font-size: 14px
    style AesReactives font-size: 14px
Uncoupling the input modules will make it easier to independently modify and debug their corresponding graph elements.
12.3 UI function debugging
In mod_var_input_ui() and mod_aes_input_ui(), the NS() function is used to encapsulate input IDs within a namespace.
We will place a verbatimTextOutput() in both UI module functions:2
mod_var_input_ui <- function(id) {
ns <- NS(id)
tagList(
selectInput(
inputId = ns("y"),
label = "Y-axis:",
choices = c(
"IMDB rating" = "imdb_rating",
"IMDB number of votes" = "imdb_num_votes",
"Critics Score" = "critics_score",
"Audience Score" = "audience_score",
"Runtime" = "runtime"
),
selected = "audience_score"
),
selectInput(
inputId = ns("x"),
label = "X-axis:",
choices = c(
"IMDB rating" = "imdb_rating",
"IMDB number of votes" = "imdb_num_votes",
"Critics Score" = "critics_score",
"Audience Score" = "audience_score",
"Runtime" = "runtime"
),
selected = "imdb_rating"
),
selectInput(
inputId = ns("z"),
label = "Color by:",
choices = c(
"Title Type" = "title_type",
"Genre" = "genre",
"MPAA Rating" = "mpaa_rating",
"Critics Rating" = "critics_rating",
"Audience Rating" = "audience_rating"
),
selected = "mpaa_rating"
),
strong(
code("var_input"),
"module reactive ",
code("inputs")
),
verbatimTextOutput(ns("vals"))
)
}- 1
-
Optional label
- 2
-
Include the
ns()for theinputId
mod_aes_input_ui <- function(id) {
ns <- NS(id)
tagList(
sliderInput(
inputId = ns("alpha"),
label = "Alpha:",
min = 0, max = 1, step = 0.1,
value = 0.5
),
sliderInput(
inputId = ns("size"),
label = "Size:",
min = 0, max = 5,
value = 2
),
textInput(
inputId = ns("x"),
label = "Plot title",
placeholder = "Enter plot title"
),
strong(
code("aes_input"),
"module reactive ",
code("inputs")
),
verbatimTextOutput(ns("vals"))
)
}- 1
-
Optional label
- 2
-
Include the
ns()for theinputId
12.4 Server function debugging
In the corresponding server functions, we’ll capture the reactive values and print the list using lobstr::tree():3
mod_var_input_server <- function(id) {
moduleServer(id, function(input, output, session) {
observe({
output$vals <- renderPrint({
all_vals <- reactiveValuesToList(input,
all.names = TRUE)
lobstr::tree(all_vals)
})
}) |>
bindEvent(c(input$x, input$y, input$x))
return(
reactive({
list(
"y" = input$y,
"x" = input$x,
"z" = input$z
)
})
)
})
}- 1
-
Collect reactive values in module
- 2
-
Print these values to the UI
- 3
-
Include all reactive objects
- 4
-
Visualize using
lobstr::tree()
- 5
- Bind to inputs
mod_aes_input_server <- function(id) {
moduleServer(id, function(input, output, session) {
observe({
output$vals <- renderPrint({
all_vals <- reactiveValuesToList(input,
all.names = TRUE)
lobstr::tree(all_vals)
})
}) |>
bindEvent(c(input$alpha, input$size, input$x))
return(
reactive({
list(
"alpha" = input$alpha,
"size" = input$size,
"plot_title" = input$x
)
})
)
})
}- 1
-
Collect reactive values in module
- 2
-
Print these values to the UI
- 3
-
Include all reactive objects
- 4
-
Visualize using
lobstr::tree()
- 5
- Bind to inputs
We see the following in the sidebar after loading, documenting, installing and launching our app;
Ctrl/Cmd + Shift + L
Ctrl/Cmd + Shift + D
Ctrl/Cmd + Shift + B
Reactive values for the variable input module:
Reactive values for the aesthetic input module:
In the variable and aesthetic module namespaces, NS() ensures all the inputs are unique within the module (even when multiple modules are used in the same application).
<list>
├─y: "audience_score"
├─x: "imdb_rating"
└─z: "mpaa_rating"
You probably noticed that I’ve renamed the inputId for the plot title to x, but we avoid any namespace collisions because each ID is stored safely within a module.
<list>
├─alpha: 0.5
├─size: 2
└─x: ""
This encapsulation is similar to how a directory provides a distinct context for files, preventing naming conflicts within a file system.
If we repeat this method in movies_ui() and movies_server():
show/hide movies_ui()
movies_ui <- function(bslib = FALSE) {
addResourcePath(
prefix = 'www',
directoryPath = system.file('www/', package = 'sap'))
if (isFALSE(bslib)) {
tagList(
bslib::page_fillable(
h1("Movie Reviews"),
bslib::layout_sidebar(
sidebar =
bslib::sidebar(
title = tags$h4("Sidebar inputs"),
img(
src = "www/shiny.png",
height = 60,
width = 55,
style = "margin:10px 10px"
),
mod_var_input_ui("vars"),
mod_aes_input_ui("aes")
),
bslib::card(
full_screen = TRUE,
bslib::card_header(
tags$h4("Scatter Plot")
),
bslib::card_body(fillable = TRUE,
strong(
code("movies_server()"),
"reactive values"
),
verbatimTextOutput(outputId = "vals"),
mod_scatter_display_ui("plot")
),
bslib::card_footer(
tags$blockquote(
tags$em(
tags$p(
"The data for this application comes from the ",
tags$a("Building web applications with Shiny",
href = "https://rstudio-education.github.io/shiny-course/"
),
"tutorial"
)
)
)
)
)
)
)
)
} else {
tagList(
bslib::page_fillable(
title = "Movie Reviews (bslib)",
theme = bslib::bs_theme(
bg = "#101010",
fg = "#F6F5F5",
primary = "#EE6F57",
secondary = "#32E0C4",
success = "#FF4B5C",
base_font = sass::font_google("Ubuntu"),
heading_font = sass::font_google("Ubuntu")
),
bslib::layout_sidebar(
sidebar = bslib::sidebar(
mod_var_input_ui("vars"),
mod_aes_input_ui("aes")
),
bslib::card(
full_screen = TRUE,
bslib::card_header(
tags$img(
src = "www/bootstrap.png",
height = 80,
width = 100,
style = "margin:10px 10px"
)
),
bslib::card_body(
strong(
code("movies_server()"),
"reactive values"
),
verbatimTextOutput(outputId = "vals"),
mod_scatter_display_ui("plot")
)
)
)
)
)
}
} - 1
-
Label and output for printed reactive values
- 2
-
Label and output for printed reactive values (
bslibUI option)
show/hide movies_server()
movies_server <- function(input, output, session) {
output$vals <- renderPrint({
app_vals <- reactiveValuesToList(x = input,
all.names = TRUE)
lobstr::tree(app_vals)
})
selected_vars <- mod_var_input_server("vars")
selected_aes <- mod_aes_input_server("aes")
mod_scatter_display_server("plot",
var_inputs = selected_vars,
aes_inputs = selected_aes)
}- 1
-
Capture reactive values
- 2
-
Render reactive values
- 3
- Print list as folder tree
Load the package and run the app:
Ctrl/Cmd + Shift + L
Ctrl/Cmd + Shift + D
Ctrl/Cmd + Shift + B
The printed output from movies_ui() andmovies_server() is prefixed with the namespace (i.e., vars- or aes-), reflecting the hierarchical organization of the input IDs, much like file paths in a directory structure.
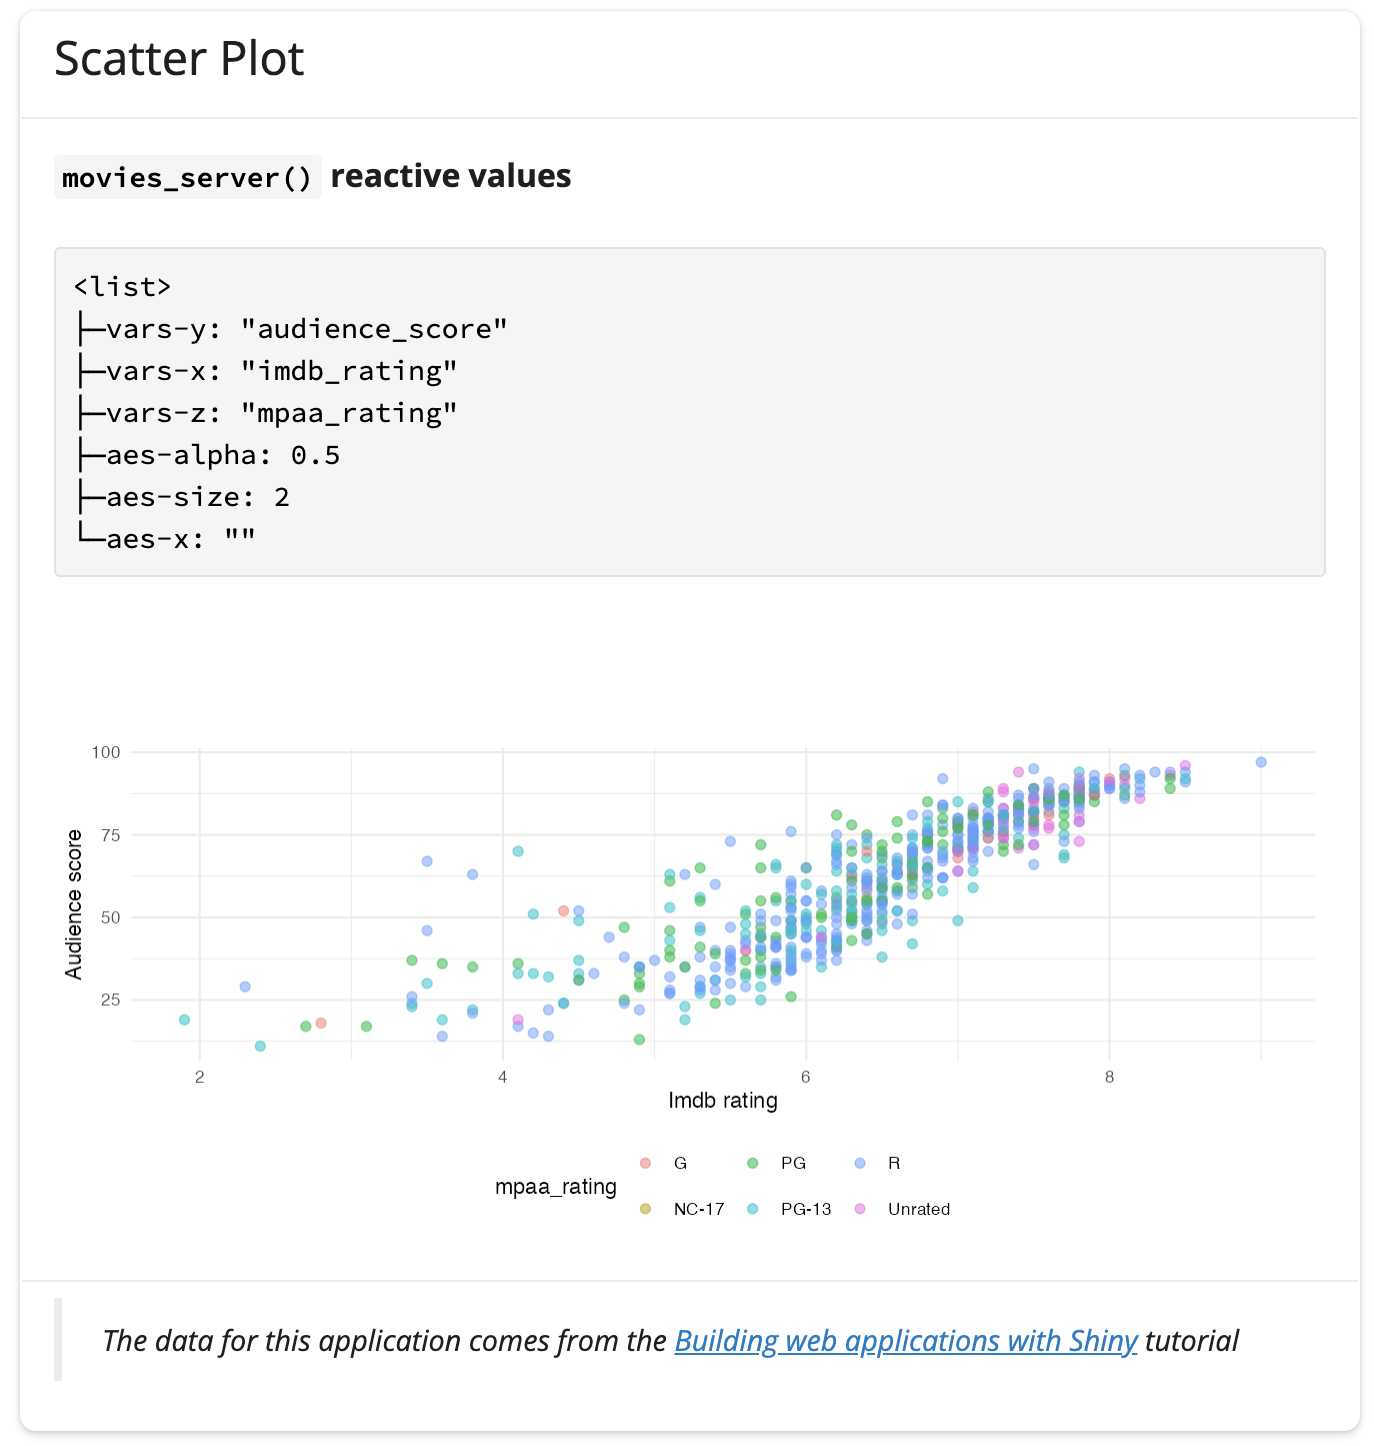
movies_ui()By using reactiveValuesToList() and lobstr::tree() in combination with verbatimTextOutput() and renderPrint(), we are effectively debugging and inspecting the module’s reactive inputs.
<list>
├─vars-y: "audience_score"
├─vars-x: "imdb_rating"
├─vars-z: "mpaa_rating"
├─aes-alpha: 0.5
├─aes-size: 2
└─aes-x: ""
Capturing and rendering reactive values in the UI gives us the benefits of print debugging while our Shiny app is running. When it’s combined with observe() and browser(), we can get a direct view of the application state and the program flow at specific execution points.
Launch app with the shinypak package:
launch('12.1_debug-mods')12.5 Module communication
When we load, document, install and view the application in this branch we find an error with the graph display:
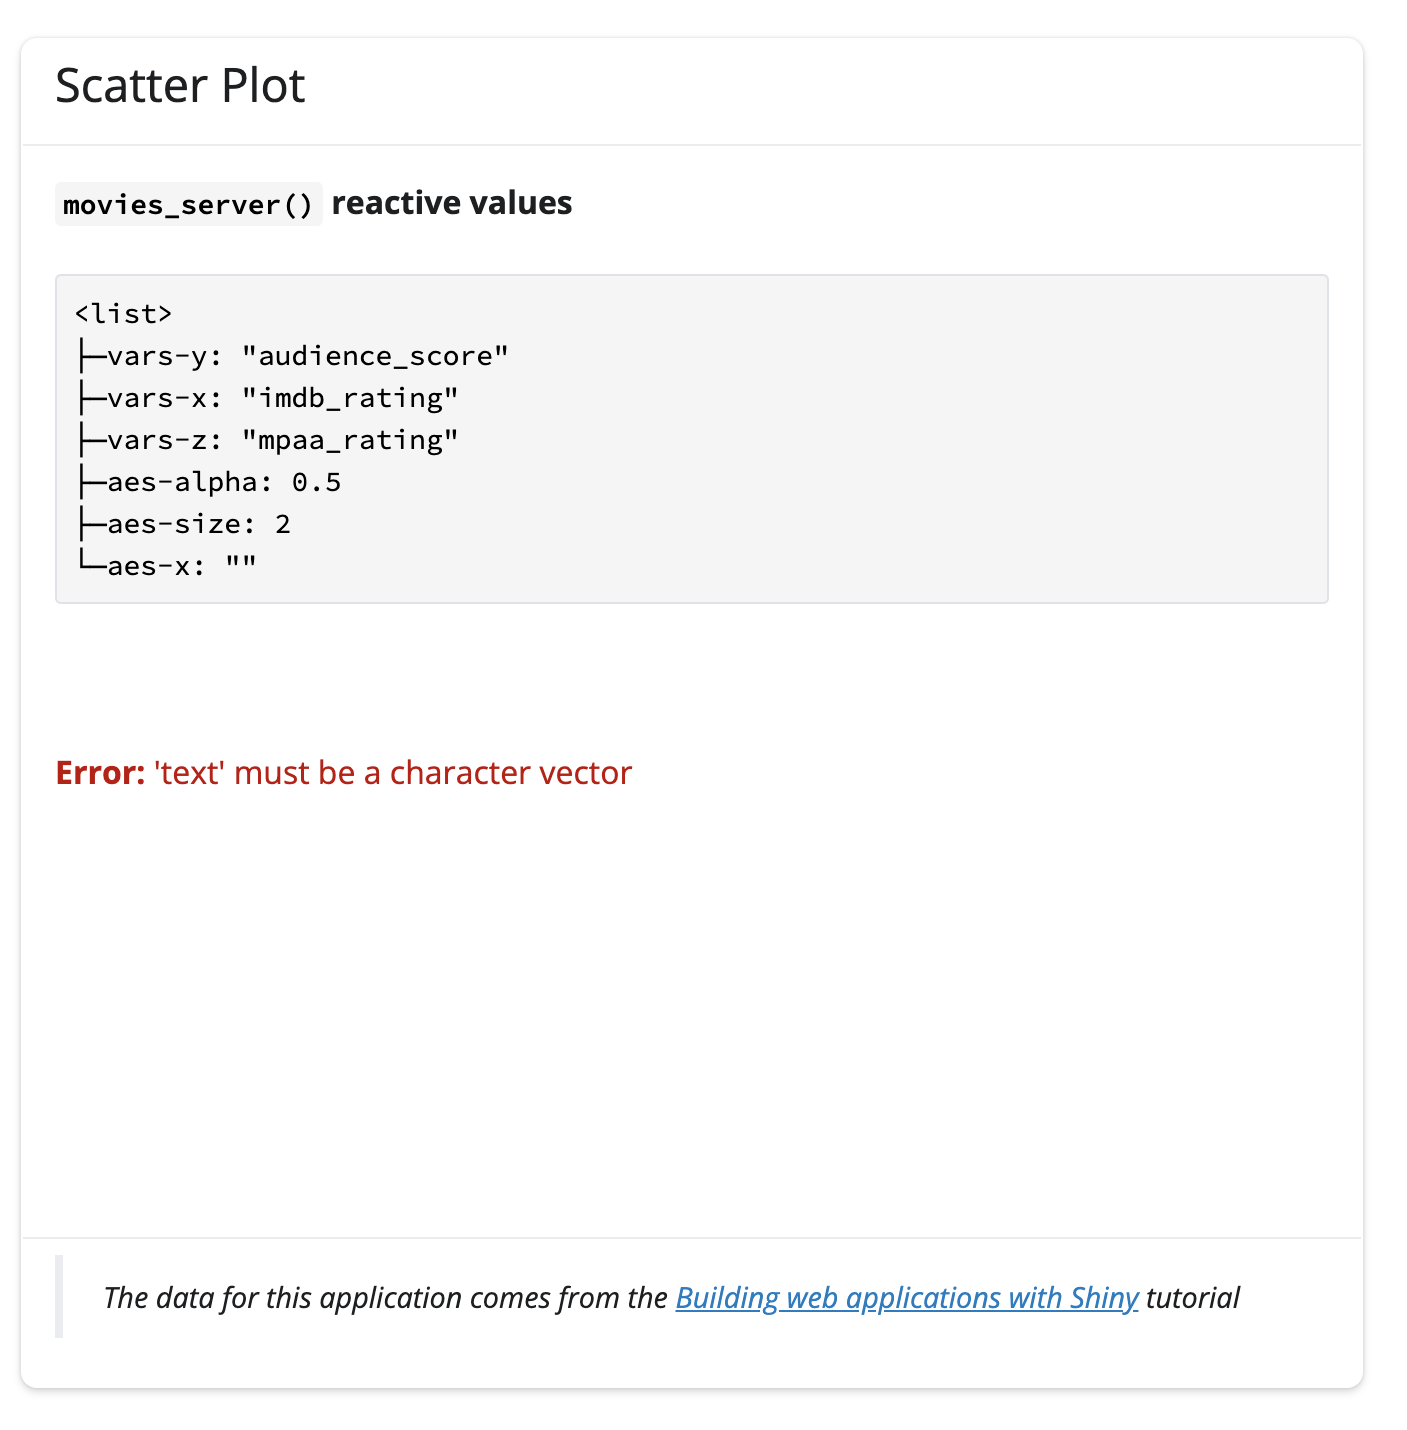
The call stack (printed to the Console) displays the following information:
Warning: Error in tools::toTitleCase: 'text' must be a character vector
  208: stop
  207: tools::toTitleCase
  206: <reactive>
  204: .func
  201: contextFunc
  200: env$runWith
  189: ctx$run
  188: self$.updateValue
  186: inputs
  178: renderPlot
  176: func
  136: drawPlot
  122: <reactive:plotObj>
  102: drawReactive
   89: renderFunc
   88: output$plot-scatterplot
    3: runApp
    2: print.shiny.appobj
    1: <Anonymous>
The output in the Console is helpful (we know the error is coming from the tools::toTitleCase() function), but we need to narrow it down because we’re using this function in multiple places.
To use the interactive debugger, we’ll add browser() and observe() in the movies_server() function to capture the behaviors of both the variables and aesthetics modules:
movies_server <- function(input, output, session) {
output$vals <- renderPrint({
app_vals <- reactiveValuesToList(x = input, all.names = TRUE)
lobstr::tree(app_vals)
})
observe({
browser()
selected_vars <- mod_var_input_server("vars")
selected_aes <- mod_aes_input_server("aes")
mod_scatter_display_server("plot",
var_inputs = selected_vars,
aes_inputs = selected_aes)
})
}- 1
-
Observer scope
- 2
- Activate debugger
Then we’ll load, document, install and launch the app:
Ctrl/Cmd + Shift + L
Ctrl/Cmd + Shift + D
Ctrl/Cmd + Shift + B
The application launches, but browser() pauses the execution of the modules and activates the IDE’s debugger. This allows us to view the objects that are available in movies_server() before the variables are passed to the graph rendering functions.
We’ll proceed with the interactive debugger until both selected_vars and selected_aes are returned from the input modules:
Browse[1]> n
Browse[1]> n
Browse[1]> n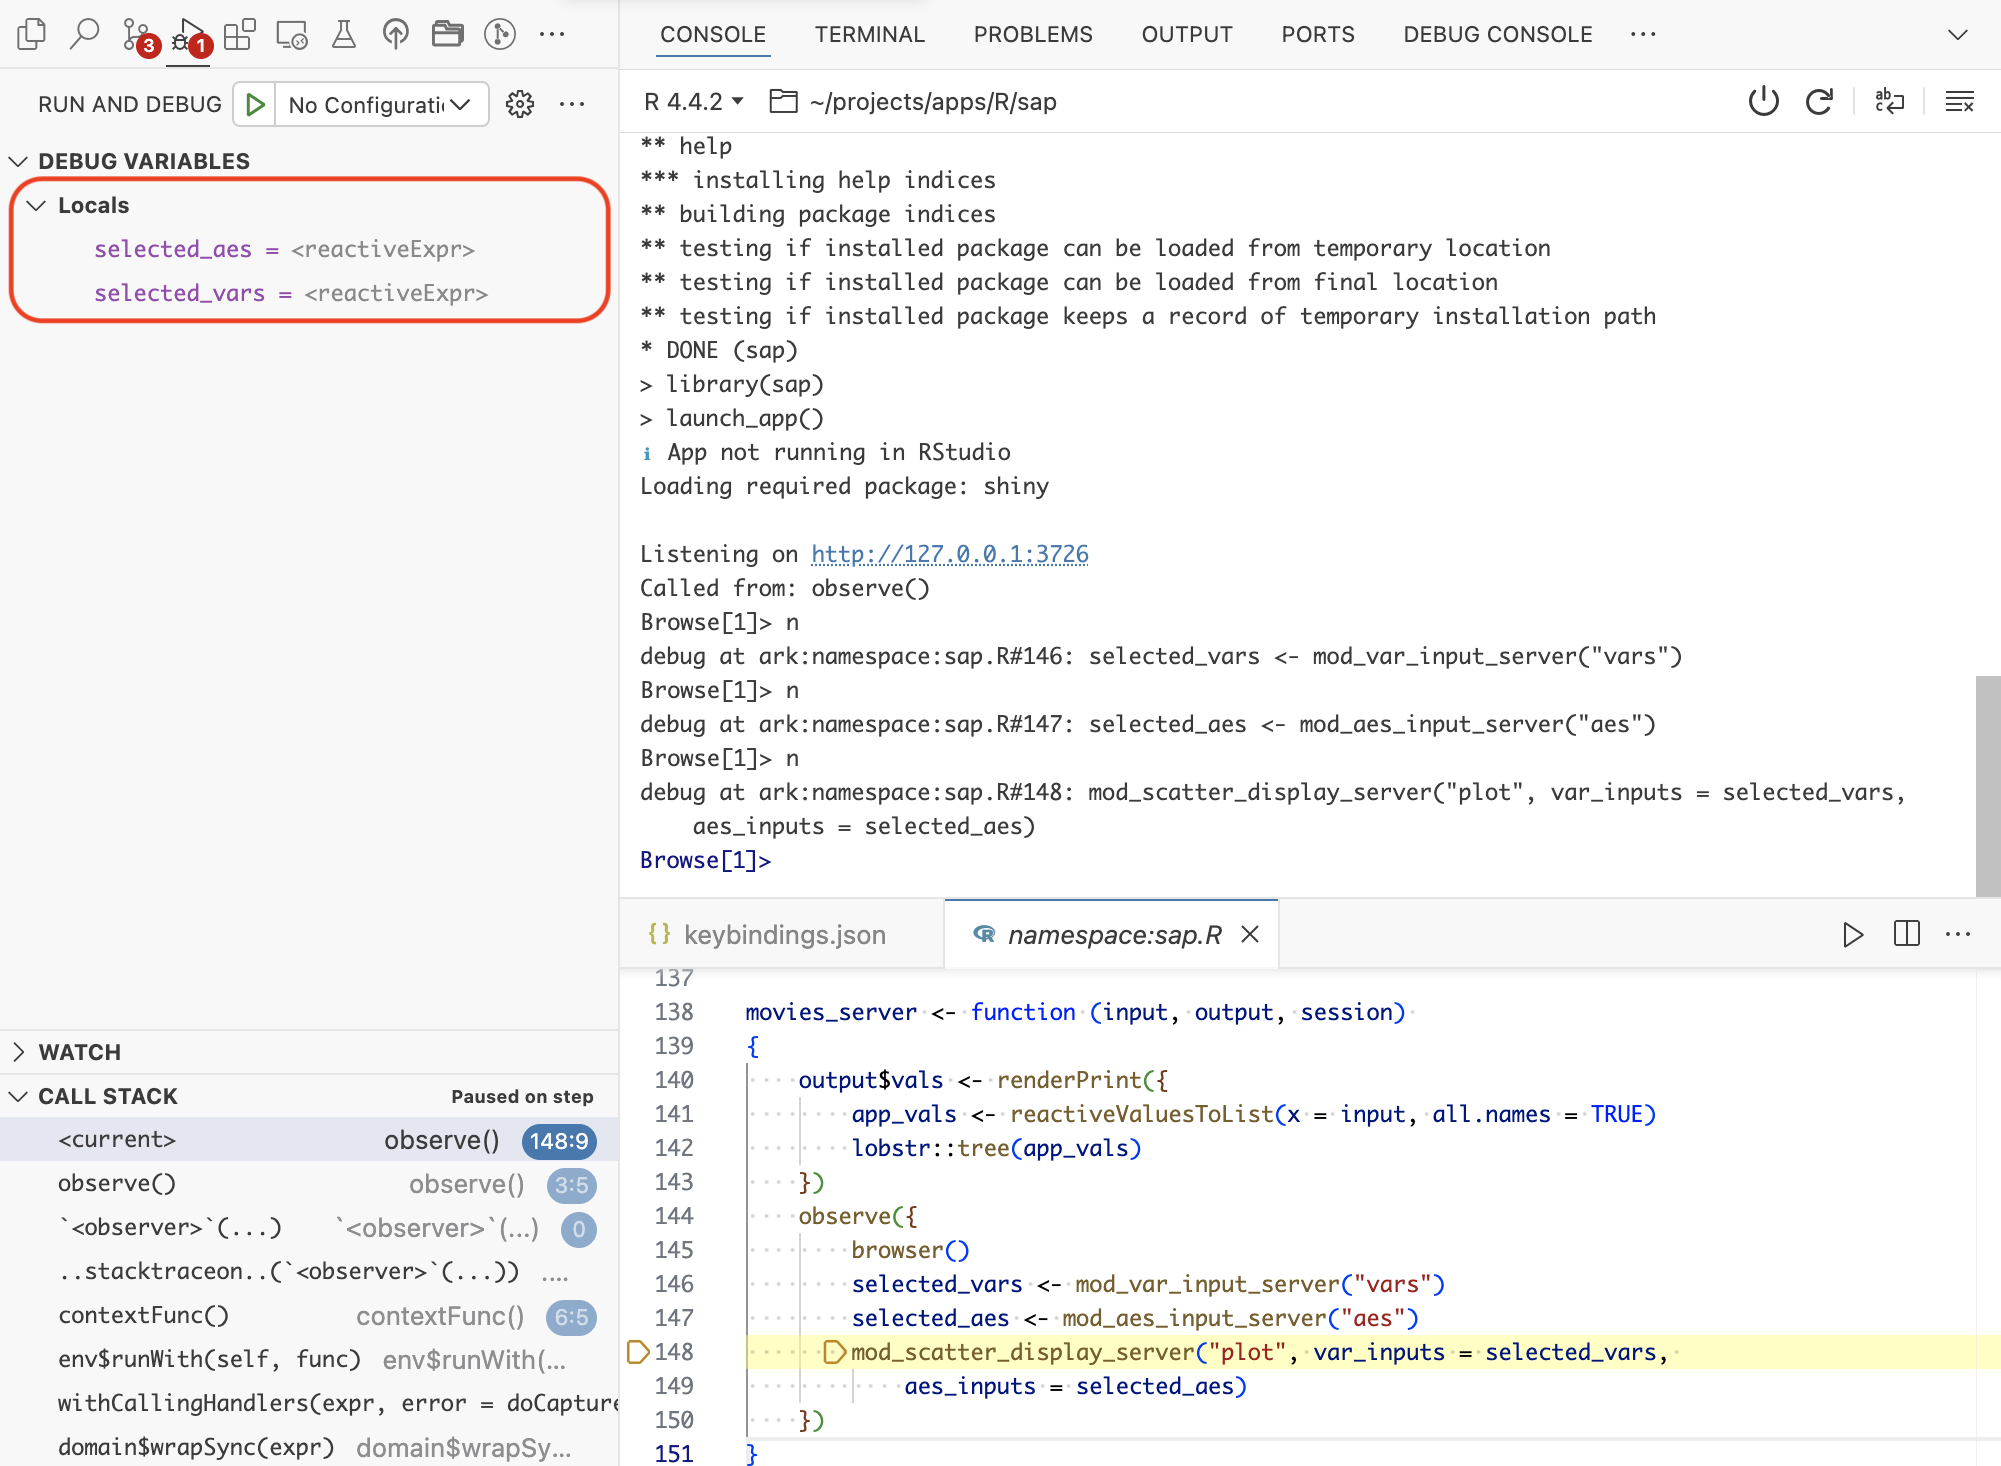
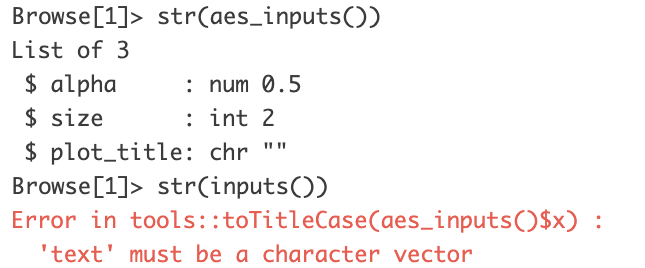
This tells us both objects are returned from their respective module server functions. But we should pause and examine the structure of selected_aes:
Browse[1]> str(selected_aes)function ()
- attr(*, "observable")=Classes 'Observable', 'R6' reactive({
list(alpha = input$alpha, size = input$size, plot_title = input$x)
})
- attr(*, "cacheHint")=List of 1
..$ userExpr: language { list(alpha = input$alpha, size = input$size,
plot_title = input$x) }
- attr(*, "class")= chr [1:3] "reactiveExpr" "reactive" "function"The output above displays selected_vars the method, not the selected input values. To view these, we need to include the parentheses:
Browse[1]> str(selected_aes())List of 3
$ alpha : num 0.5
$ size : int 2
$ plot_title: chr ""This confirms that the UI values are being collected by the aesthetic input module and stored in selected_aes, so the error must be coming from inside one of the modules.
We’ve inspected the values in the exchange between movies_ui() and movies_server():
█─launch_app
├─█─movies_ui
└─█─movies_server
We’ll remove (or comment out) the calls to observe() and browser() from movies_server() and repeat a similar process in mod_scatter_display_server(), but include the calls to observe() and browser() after moduleServer().
mod_scatter_display_server <- function(id, var_inputs, aes_inputs) {
moduleServer(id, function(input, output, session) {
observe({
browser()
inputs <- reactive({
plot_title <- tools::toTitleCase(aes_inputs()$x)
list(
x = var_inputs()$x,
y = var_inputs()$y,
z = var_inputs()$z,
alpha = aes_inputs()$alpha,
size = aes_inputs()$size,
plot_title = plot_title
)
})
output$scatterplot <- renderPlot({
plot <- scatter_plot(
# data --------------------
df = movies,
x_var = inputs()$x,
y_var = inputs()$y,
col_var = inputs()$z,
alpha_var = inputs()$alpha,
size_var = inputs()$size
)
plot +
ggplot2::labs(
title = inputs()$plot_title,
x = stringr::str_replace_all(tools::toTitleCase(inputs()$x), "_", " "),
y = stringr::str_replace_all(tools::toTitleCase(inputs()$y), "_", " ")
) +
ggplot2::theme_minimal() +
ggplot2::theme(legend.position = "bottom")
})
})
})
}- 1
-
Wrap
browser()inobserve()and place after the call tomoduleServer()
Then we’ll load, document, and install the package and run the application again:
Ctrl/Cmd + Shift + L
Ctrl/Cmd + Shift + D
Ctrl/Cmd + Shift + B
Advance the debugger to the line after inputs() is created with var_inputs() and aes_inputs() (the line with output$scatterplot should be highlighted).
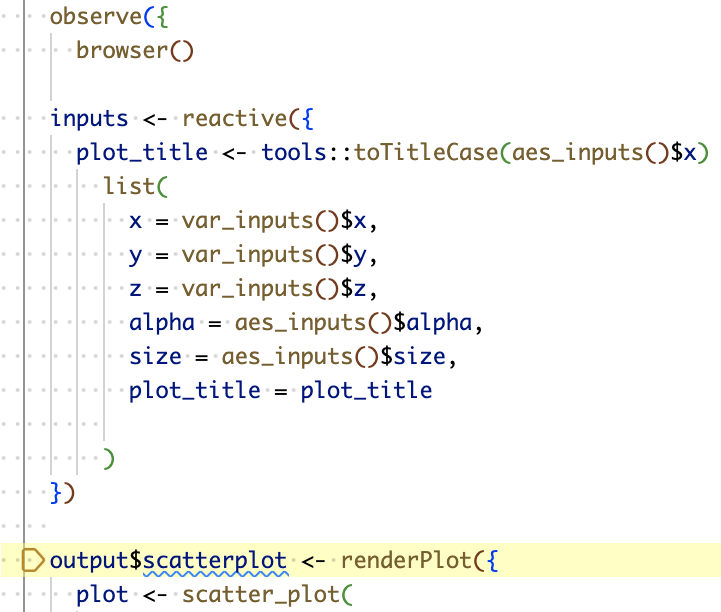
inputs() reactive created in mod_scatter_display_server()We can see the input()$plot_title appears to be a character, but the structure of inputs() returns the error we saw in the Console
inputs()12.5.1 Verifying inputs
Now that we’ve isolated the error to the tools::toTitleCase() call in the creation of the inputs() reactive. We can confirm this in the interactive debugger:
Browse[1]> tools::toTitleCase(aes_inputs()$x)
Error in tools::toTitleCase(aes_inputs()$x) :
  'text' must be a character vector
Upon further inspection, we discover the source of the error:
Bug
Fix
tools::toTitleCase(aes_inputs()$x)tools::toTitleCase(aes_inputs()$plot_title)The approach above have shown us 1) all modules are communicating properly, and 2) where to make changes in the scatter plot display module to render the graph.

I’ve reverted the code to display the error in this branch so it’s easier to follow along. Each of the apps in the inst/ folder have also been updated, and I encourage you to explore how the bug effects launching each app structure.
Launch app with the shinypak package:
launch('12.2_debug-mods')Create abstract syntax trees with the
ast()function and read the Code is a tree section in Advanced R, 2ed.↩︎We covered using
reactiveValuesToList(),renderPrint()andverbatimTextOutput()in Section 11.3.↩︎We covered using
reactiveValuesToList(),renderPrint()andverbatimTextOutput()in Section 11.3.↩︎Watch this video to learn about call stacks and abstract folder trees with
lobstr.↩︎Stack traces are also covered in Advanced R, 2ed, Mastering Shiny, and in the Shiny documentation. I’ve summarized some tips on reading Shiny call stacks in the stack traces section on the Appendix.↩︎