Placing a call to browser() inside observe() will trigger the interactive debugger when the observer is invalidated.
observe({browser()})
This allows us to interactively examine variables and reactive expressions (within the scope of the observe() function). Other tools for debugging are below:
Bugs can cause our app to crash, produce incorrect results or displays, and result in other unexpected behaviors. Fixing bugs in our app-package is an important step to ensure our application continues behaving as expected. This chapter will cover how to use Positron’s interactive debugger to help us find the root cause of bugs and errors.1
TipAccess the applications in this chapter
I’ve created the shinypak R package in an effort to make each section accessible and easy to follow. Install shinypak using pak (or remotes):
Interactive debugging (e.g., using browser() or setting a breakpoint) allows us to ‘peek inside’ a function’s scope to view intermediate values/variables and break down the execution line by line.
Unfortunately, using browser() and breakpoints are not as straightforward within reactive contexts. browser() interacts with the R interpreter by temporarily suspending execution and redirecting the input to evaluate R expressions in the context of the function or script that called it.
Shiny’s asynchronous execution makes it difficult for browser() to pause the flow of execution, making maintaining an interactive debugging session challenging.
10.1.1 Reactive browsing
In a Shiny context, code inside the server function is executed asynchronously in response to user inputs or reactive dependencies. Shiny does not directly expose the control flow to the user, but we want to pause this execution without altering or stopping the reactive flow.
Fortunately, Shiny already has a function that performs this: observe(). Within a Shiny server() function, any call to observe() creates a reactive observer that ‘listens’ for changes to reactive dependencies (and runs any enclosed code whenever those dependencies change).
When browser() is called from within the observe() scope, the code execution pauses and temporarily suspends the reactive flow so we can inspect the environment (without altering or stopping the reactive flow).
10.2 Example: ggplot2movies app
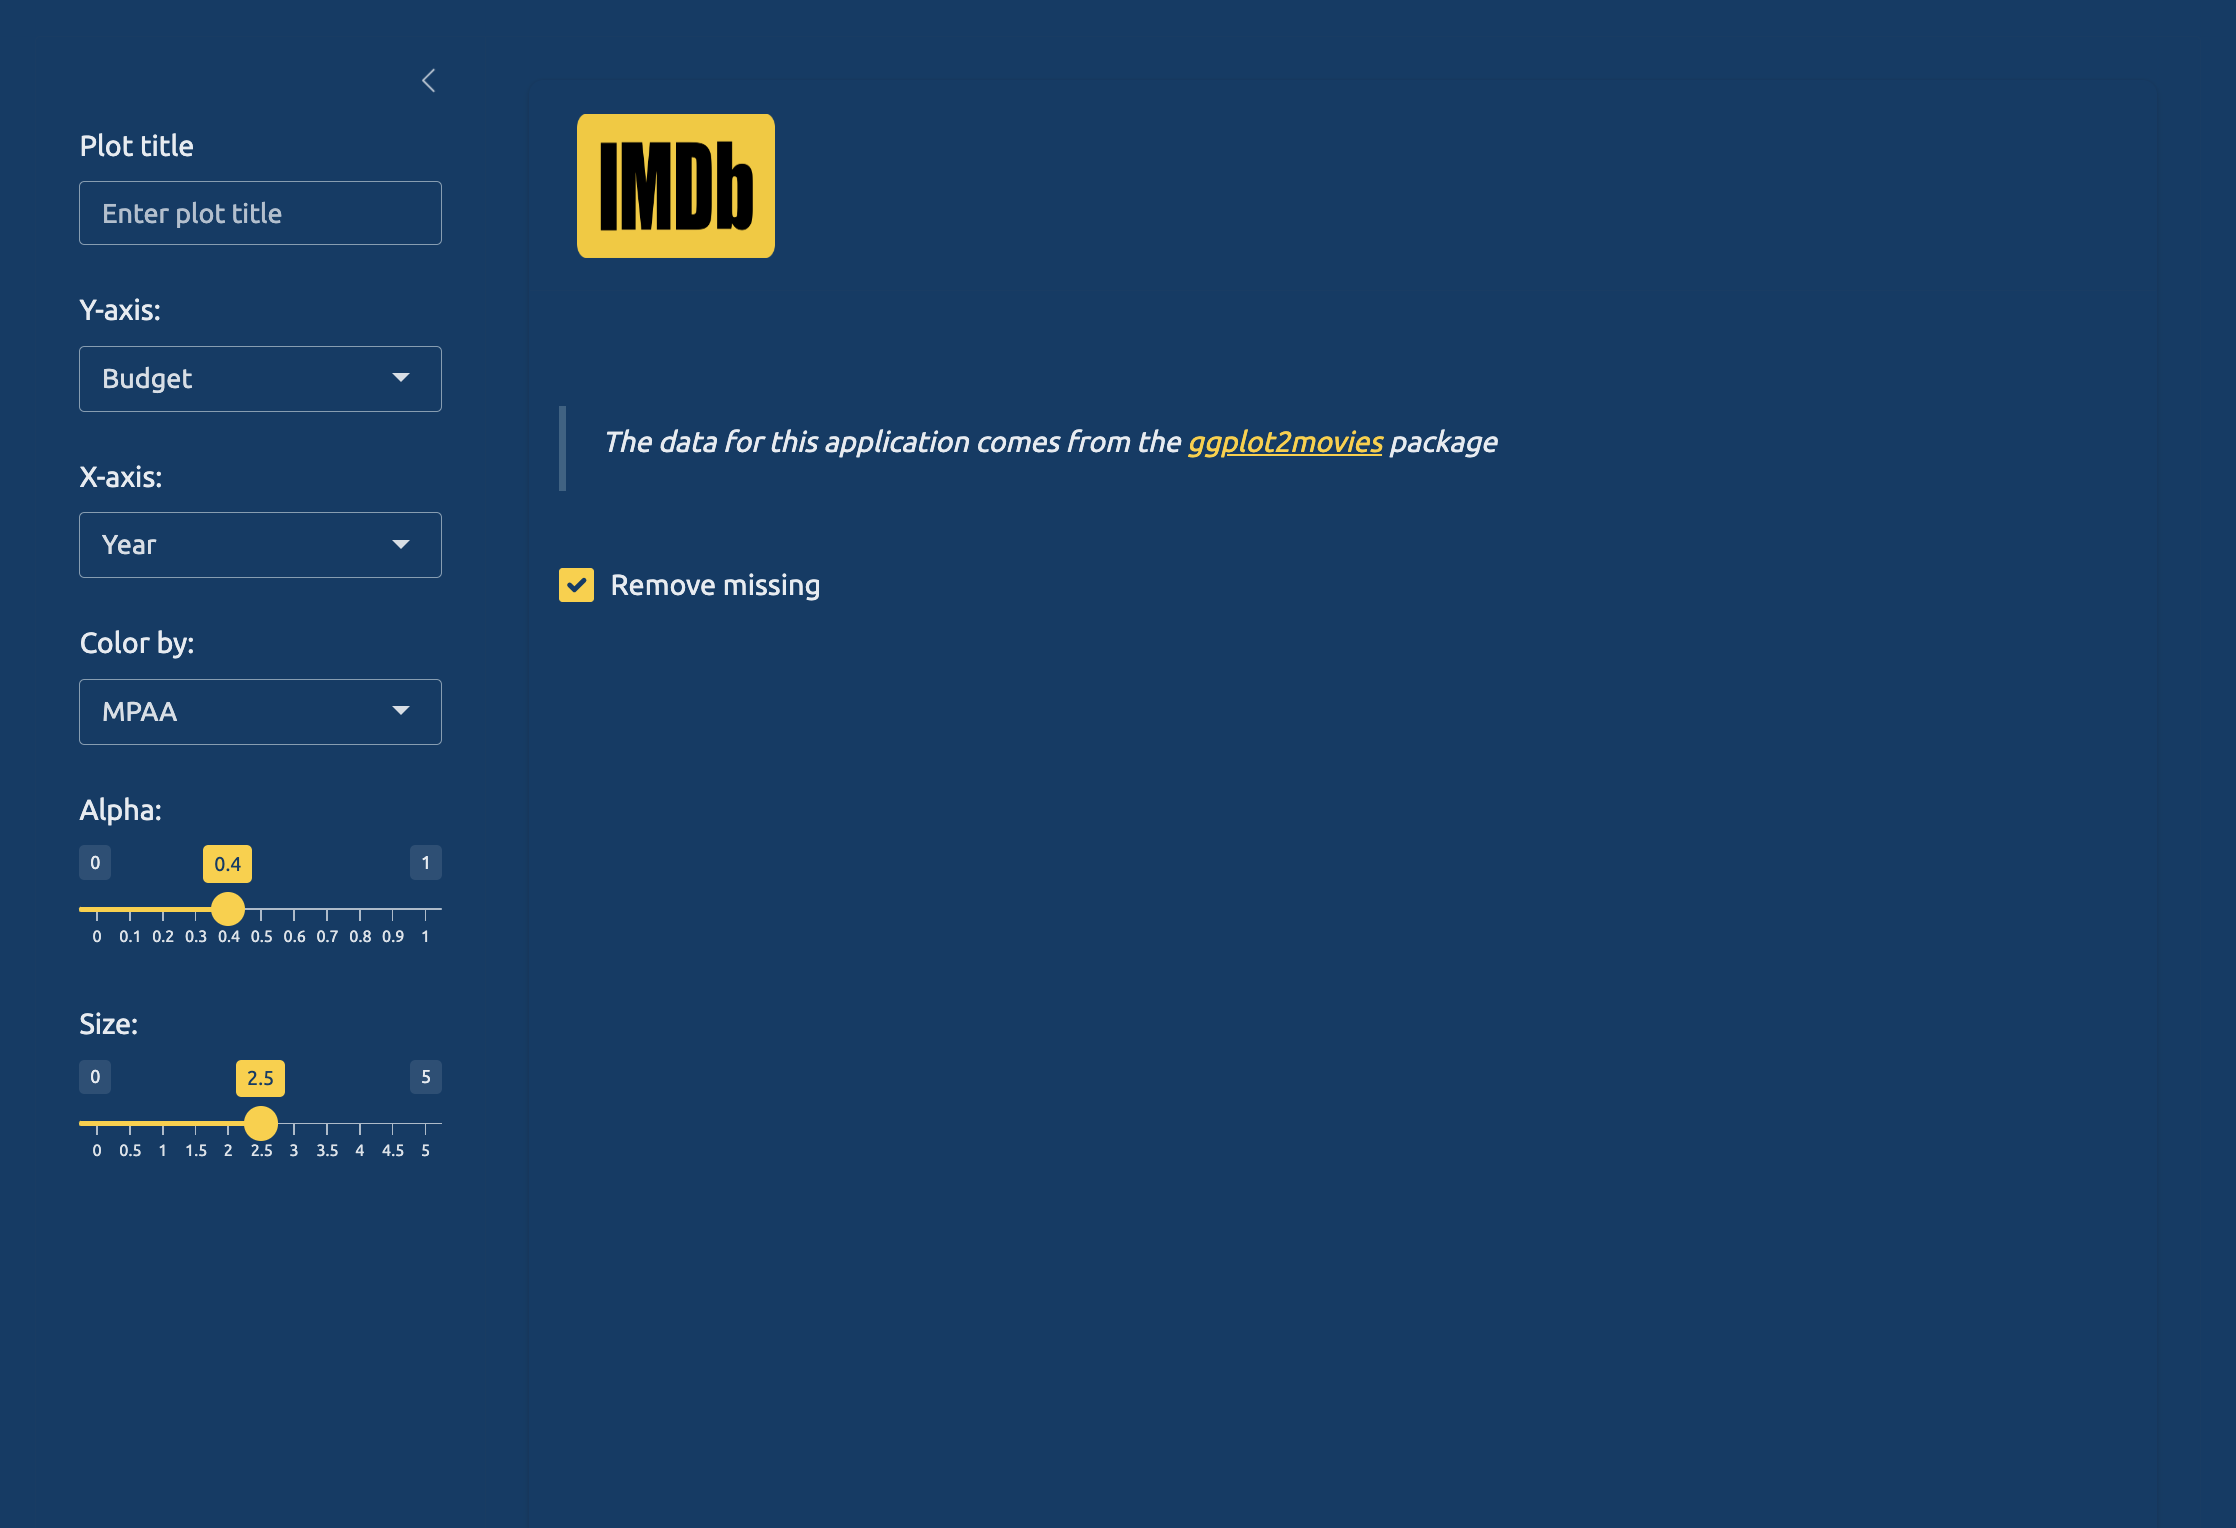
In the Resources chapter we developed a slight variation of our app with the ggplot2movies data.2 In the following sections we’re going to use the interactive debugger to see the inner workings of the ‘Remove missing’ checkbox.
Remove missing checkbox in ggplot2movies development application (click to enlarge)
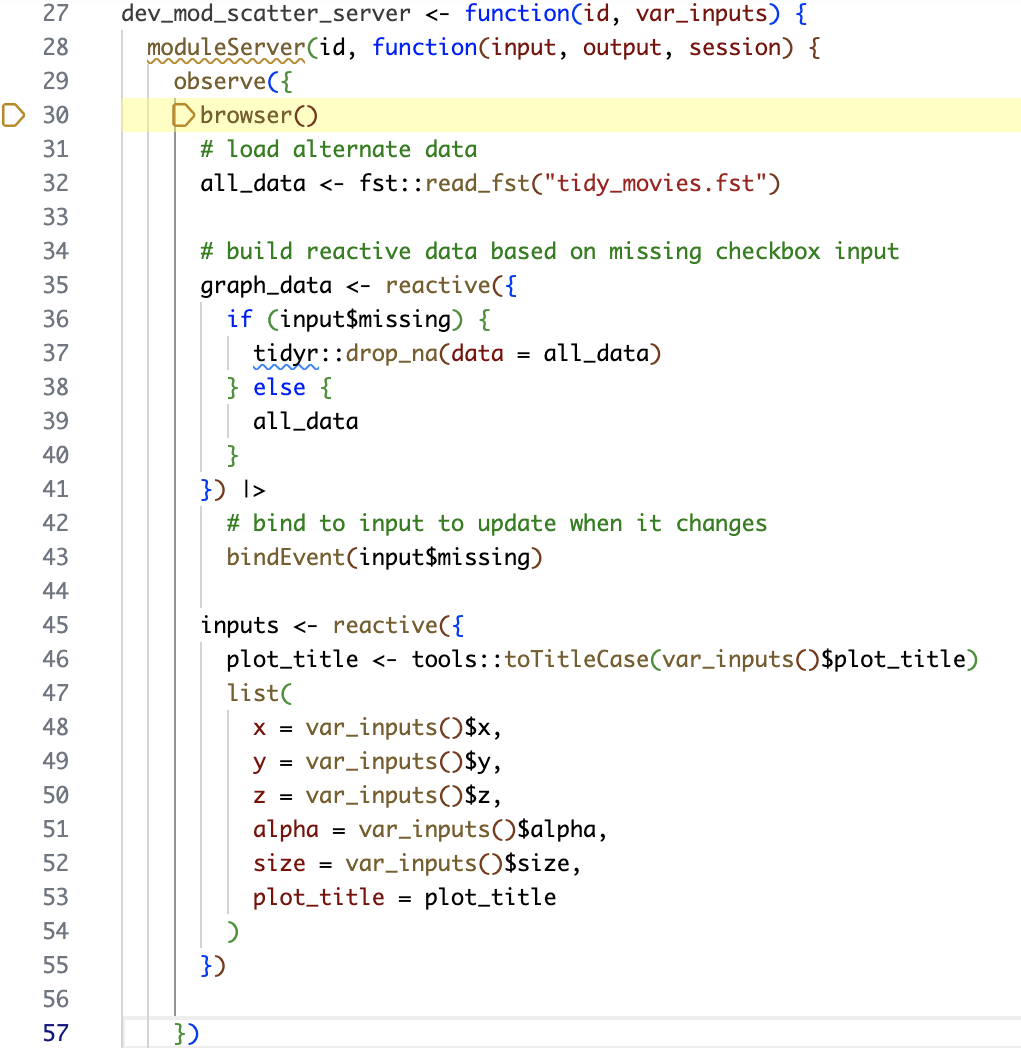
We’ll begin by placing the observe() and browser() breakpoint inside the module server function containing the ‘Remove missing’ input (right after the moduleServer() function). We’ll close the observe() scope after the reactive inputs() are created:
show/hide debugging functions in the module server function
As noted above, browser() pauses code execution and activates the interactive debugger mode, allowing us to view objects, execute code, and ‘step through’ the function line-by-line.
10.2.1 IDE Changes
Note Positron Version
At the time of this writing, the 2025.01.0-39 pre-release of Positron was available for testing.
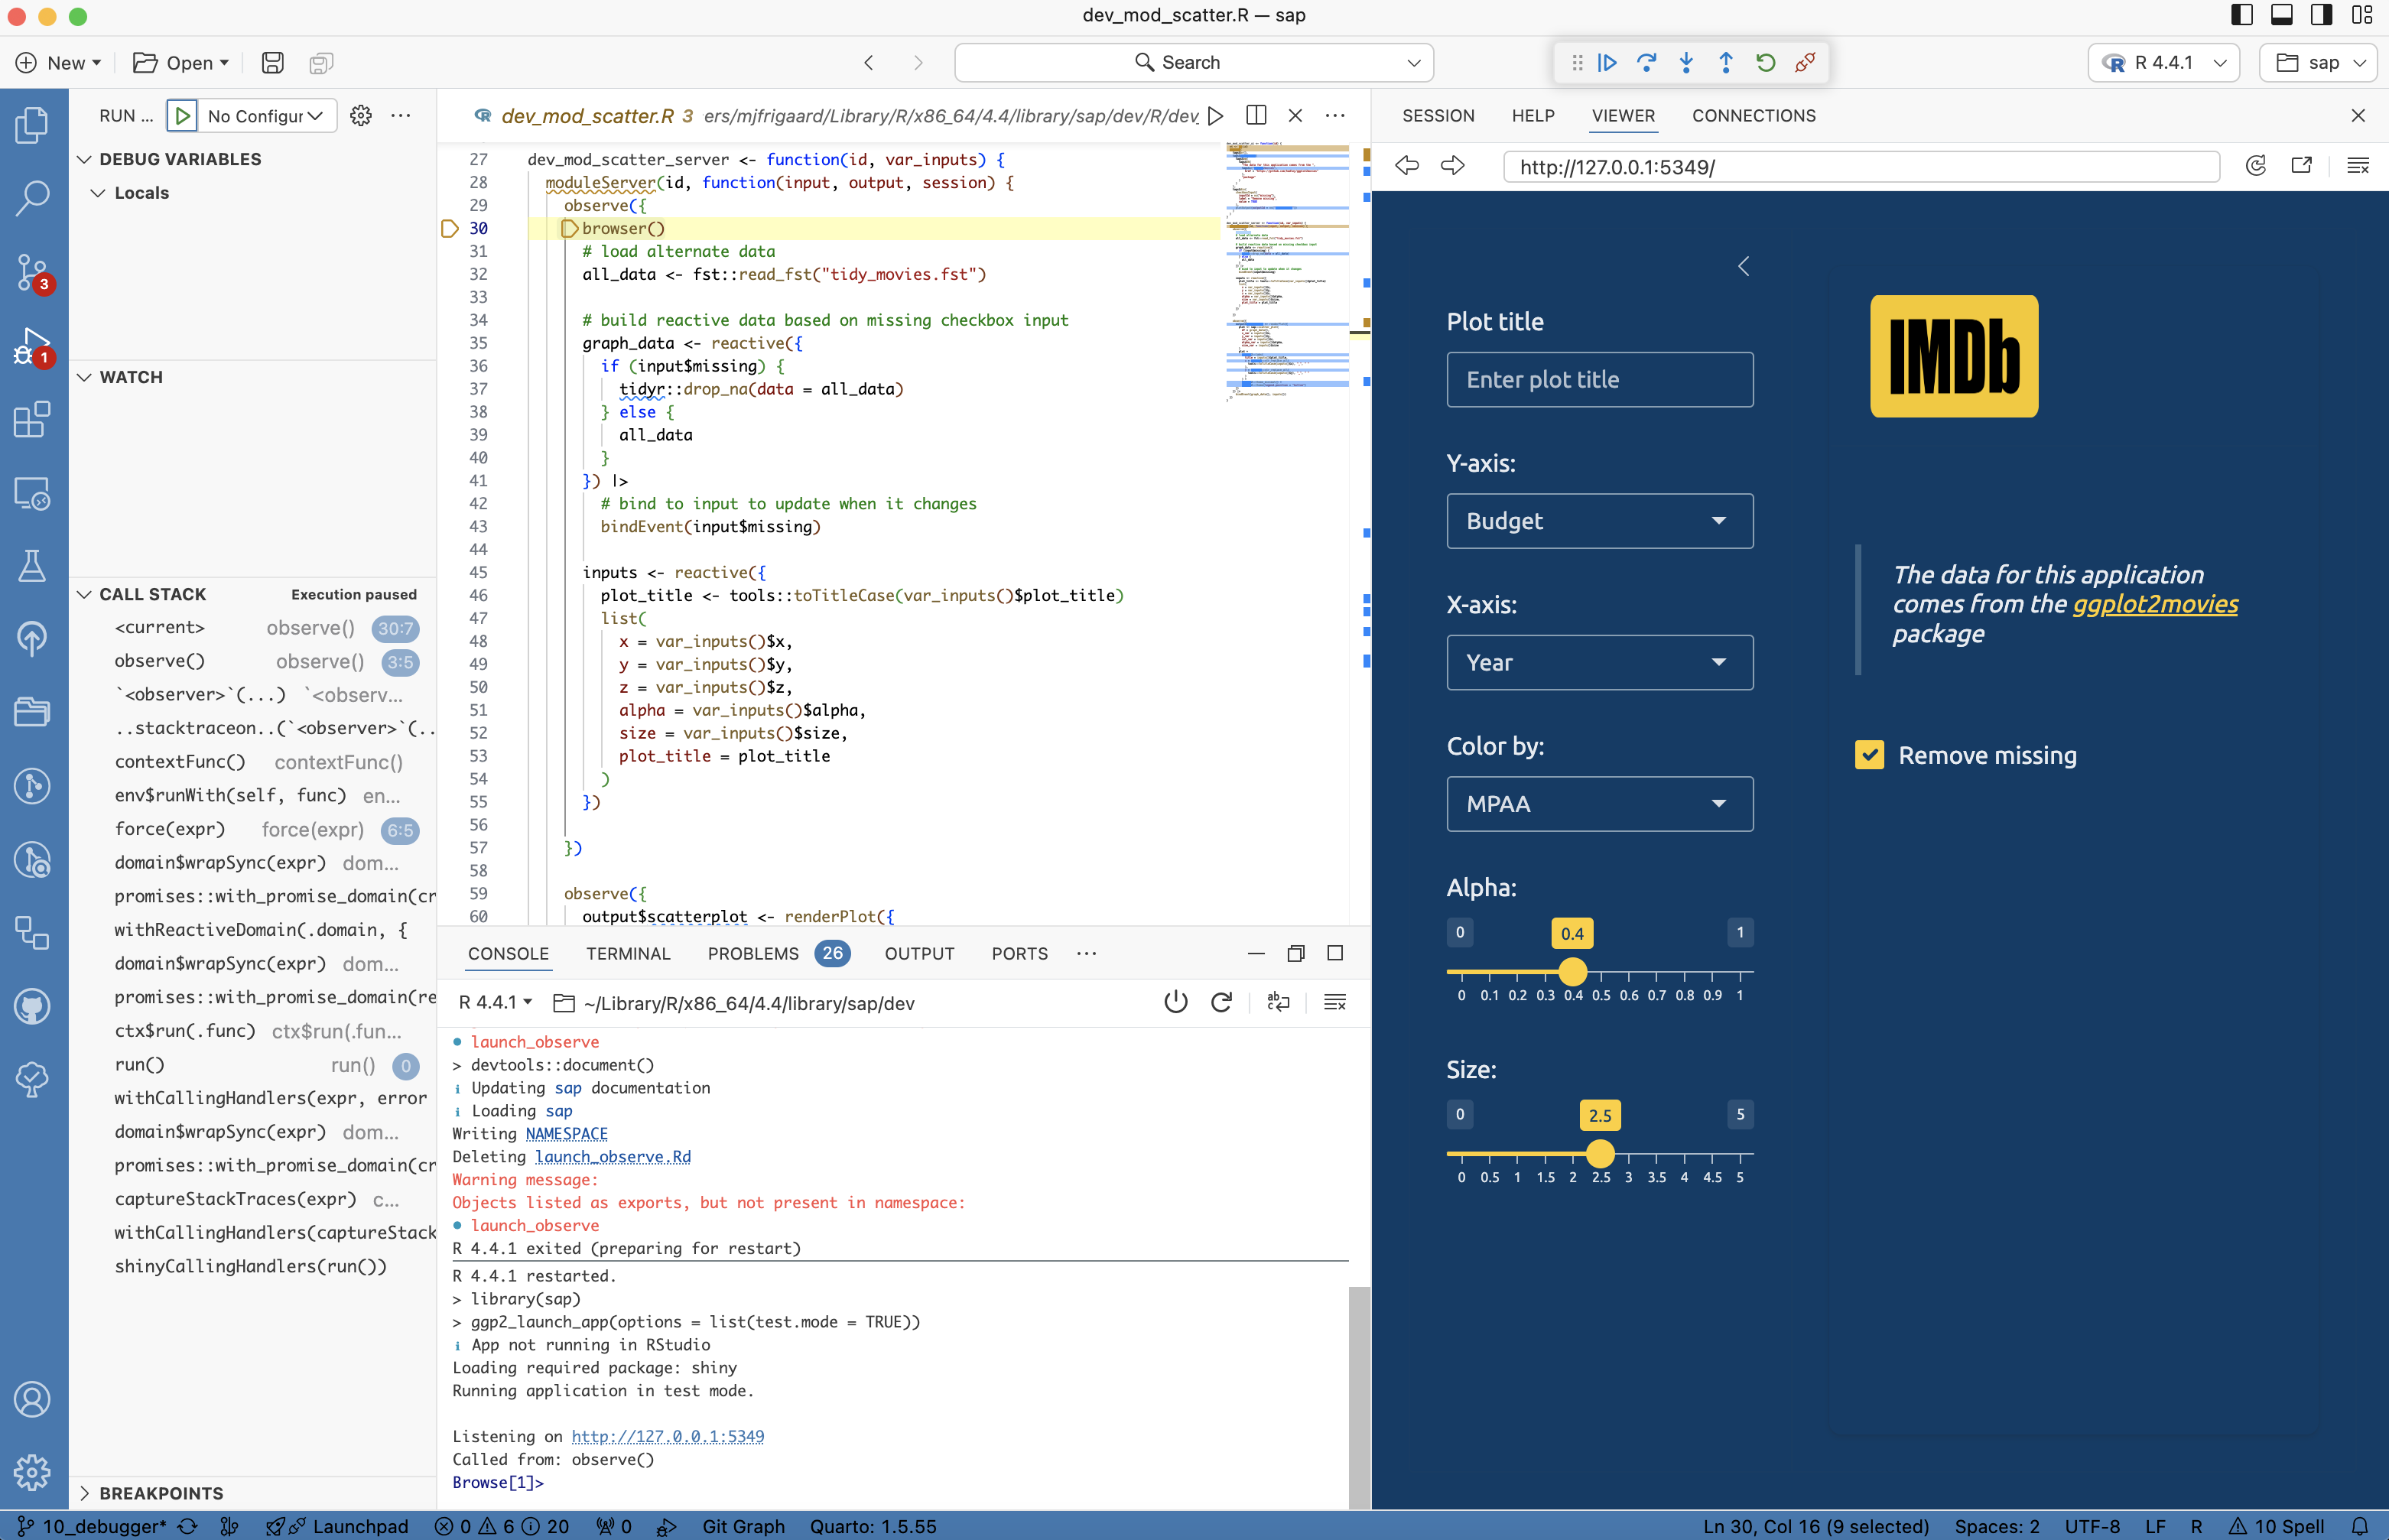
When the app is launched, Positron alerts us that we’re in debugging mode by making a few changes to the IDE:3
Sidebar
The Run and Debug sidebar menu item is displayed and the footer is highlighted in blue4
Positron IDE in debugger mode (click to enlarge)
Editor
The dev_mod_scatter.R file in the Editor highlights the browser() function in yellow
Debugger in file Editor (click to enlarge)
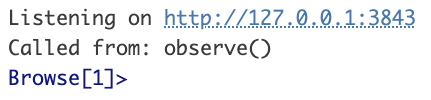
Console
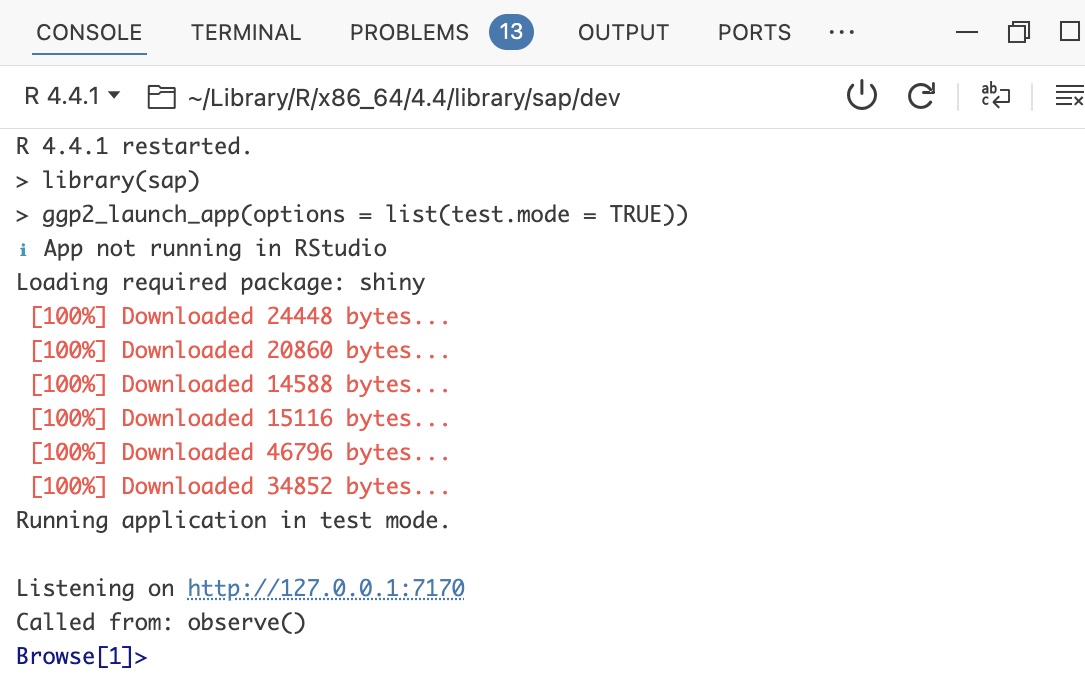
The Console tells us browser() was ‘Called from: observe()’ and displays the interactive debugger prompt:
Debugger in file Editor (click to enlarge)
observe() does not inherently pause or interrupt other reactive processes—it just triggers when changes occur within its scope. So when we’re using observe() for debugging, we need to define the context (or scope) for its behavior.
The output in the Console tells us the tidy_movies.fst data are downloaded, but our placement suspends the execution of the application before these data are loaded and the graph is rendered in the UI.
Debugger in Console (click to enlarge)
Suspended ggplot2movies data app (click to enlarge)
The interactive debugger can only access variables and values inside the observe() scope, but this process can be incredibly useful for addressing bugs (and for exploring how an application works). In the next sections, we’ll ‘step through’ the module function to explore how the missing values are removed from the graph.
10.2.2 Variables and values
We want to use the interactive debugger to proceed through the module function until the data object enters the logic for the missing checkbox, and then we can confirm its structure.
Step through/execute each line of code by entering n in the Console.
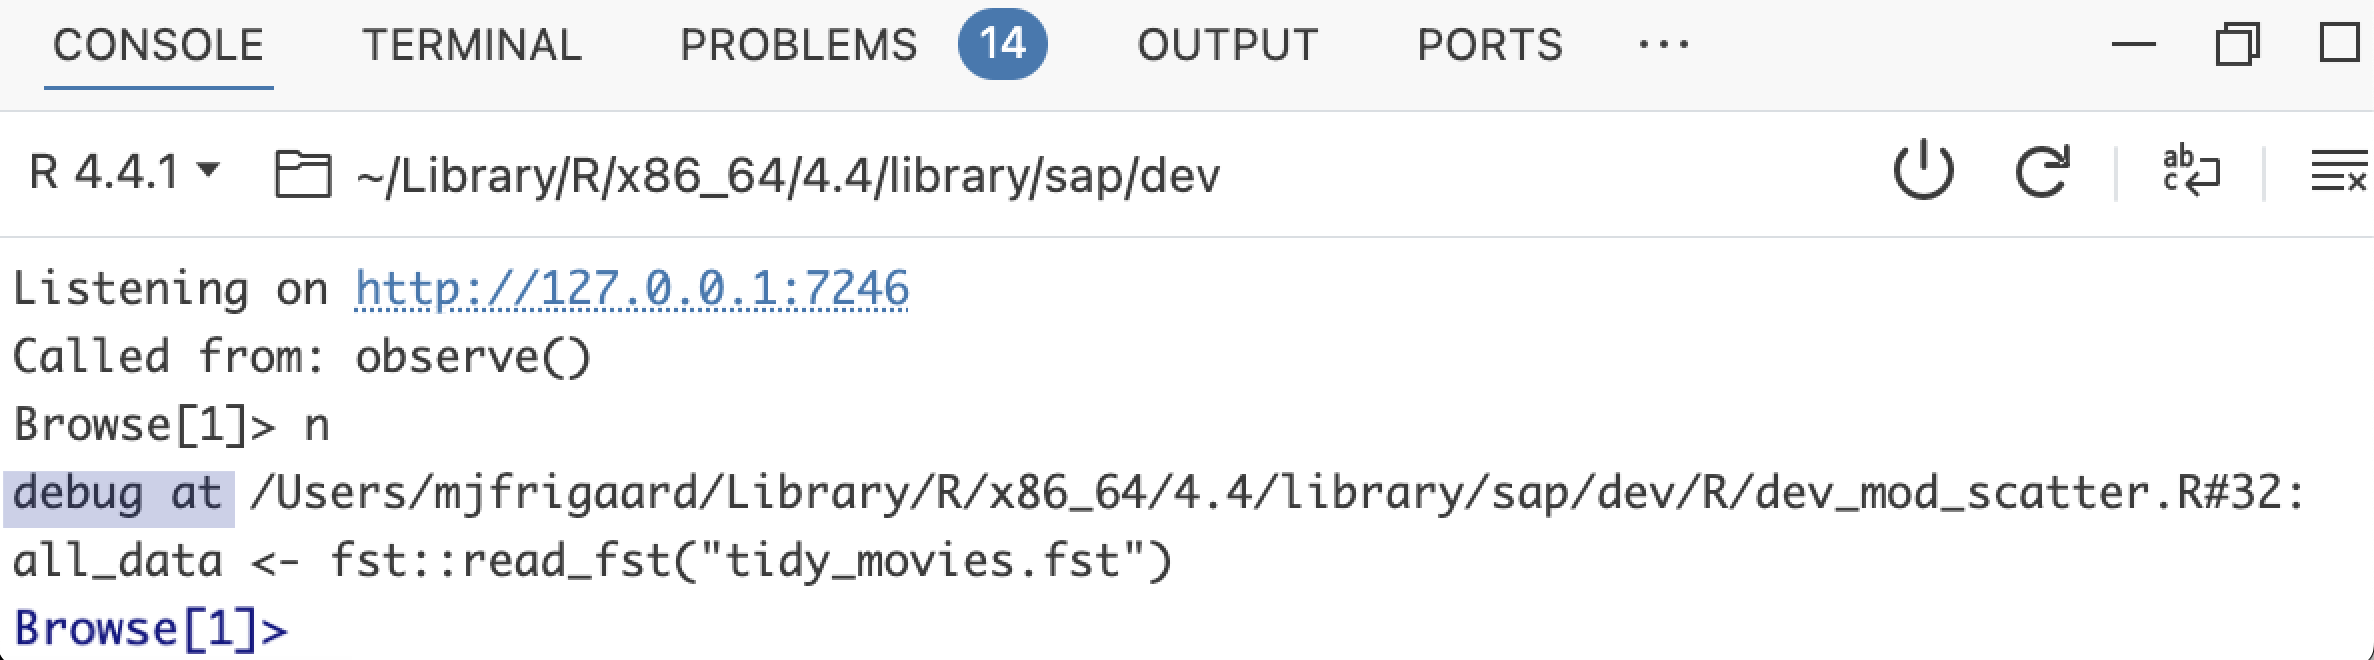
Browse[1]> n
As we ‘step through’ the function, Positron’s Console displays the debug at location, followed by the code line number:
Full path and line number to the file containing our call to browser() (click to enlarge)
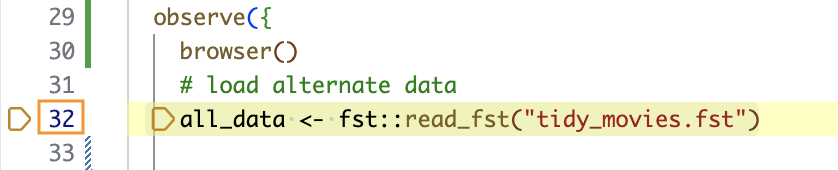
In the Editor, the same line of code is highlighted in yellow:
Corresponding line number in Editor (click to enlarge)
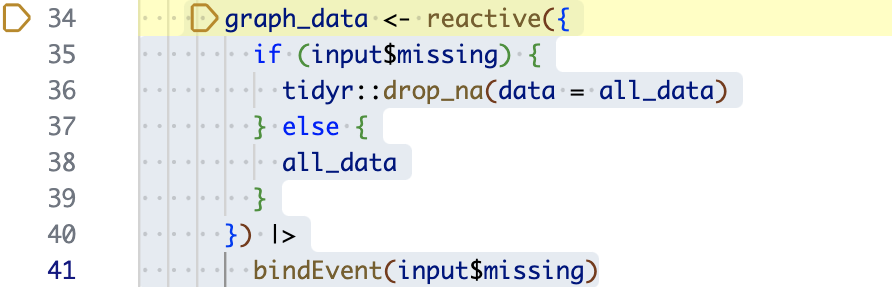
The line creating graph_data gives us a hint for how the missing data are removed (i.e., with bindEvent()), but we’ll explore this more in Print debugging.
graph_data() reactive creation (click to enlarge)
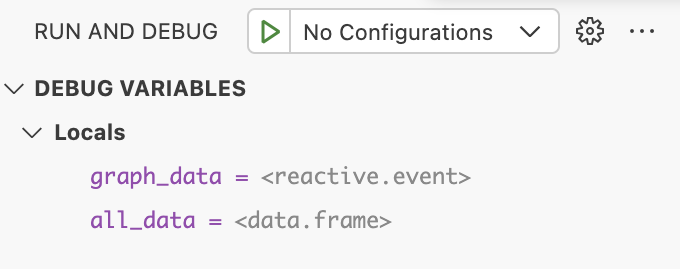
Under Locals in the DEBUG VARIABLES sidebar, we can see all_data is listed as a <data.frame>, and graph_data are listed as a <reactive.event>:
Click to enlarge DEBUG VARIABLES in sidebar
In the next section, we’ll explore these variables (and the reactive inputs).
10.2.3 Inspecting variables
We can use the Console to evaluate code while the interactive debugger is running. This comes in handy if we want to check the structure of an object inside a module (like all_data).
Browse[1]>str(all_data)
'data.frame': 58788 obs. of 10 variables:$ title : chr "$""$1000 a Touchdown" ...$ year : int 1971 1939 1941 1996 1975 ...$ length : int 121 71 7 70 71 91 93 25 97 ...$ budget : int NA NA NA NA NA NA NA NA NA ...$ rating : num 6.4 6 8.2 8.2 3.4 4.3 5.3 ...$ votes : int 348 20 5 6 17 45 200 24 18 51 ...$ mpaa : Factor w/ 5 levels "G","PG","PG-13" ...$ genre_count: int 2 1 2 1 0 1 2 2 1 0 ...$ genres : chr "Comedy, Drama""Comedy" ...$ genre : Factor w/ 8 levels "Action": 6 3 6 ...
This gives us an idea of the total rows before missing are removed.
10.2.4 Inspecting values
The reactive values and inputs can also be viewed in the Console, and we can see graph_data() is ‘bound’ to input$missing with bindEvent(). We can confirm the input$missing value in the Console:
Browse[1]> input$missing
[1] TRUE
This tells us the ‘Remove missing’ checkbox has been selected, and we can verify the missing values have been removed from graph_data():
Using browser() to ‘step through’ an application gives us a better understanding of the ‘order of execution’, and it lets us see how input$missing and bindEvent() work together to remove the missing values with the checkbox.
Recap
TipRecap: Interactive Debuggers
During regular development, an interactive debugger can let us inspect variables and execute the code line-by-line. In Shiny functions, the debugger lets us track the execution of reactive expressions and observers, which allows us to unravel reactivity-related issues that are often difficult to diagnose.
browser() and observe() are powerful tools for debugging our application. Navigating a function using the interactive debugger gives us control over the execution of each line.