%%{init: {'theme': 'neutral', 'themeVariables': { 'fontFamily': 'monospace', "fontSize":"13px"}}}%%
flowchart TD
    subgraph Inputs["<strong>Inputs</strong>"]
        subgraph Variables["Variables"]
        var_input[/"<code>input$x</code><br><code>input$y</code><br><code>input$z</code>"/]
        end
        subgraph Aesthetics["Aesthetics"]
        aes_input[/"<code>input$alpha</code><br><code>input$size</code>"/]
        end
        subgraph Title["Title"]
        plot_title[/"<code>input$plot_title</code>"/]
        end

    end
    subgraph React["<strong>App Reactives</strong>"]
        var_inputs>"<code>var_inputs()</code> "]
        inputs>"<code>inputs()</code>"]
    end
    subgraph Output["<strong>Output</strong>"]
        output[\"<code>output$scatterplot</code>"\]
    end

    var_input & aes_input <==> |"pre-selected values"|var_inputs
    plot_title <-.-> |"*new plot title*"|var_inputs
    var_inputs <==>|"*New Plot Title*"|inputs
    inputs <==> output

    style var_input stroke:#333,stroke-width:1px,rx:5,ry:5
    style aes_input stroke:#333,stroke-width:1px,rx:5,ry:5
Debug
Expand the callout boxes below to review what we’ve covered in the last section:
This section covers common methods for debugging R code and how we can adapt these methods to use within a Shiny app. So far this book has covered the contents of an R package containing a basic, functioning Shiny app. But as apps grow in complexity, it’s highly likely you’ll encounter bugs or errors during development.1
Fortunately, both RStudio ![]() and Positron
and Positron ![]() come with powerful interactive debuggers, which help us identify, analyze, and fix errors in our code. Consider the diagram below that illustrates the reactive inputs in our application:
come with powerful interactive debuggers, which help us identify, analyze, and fix errors in our code. Consider the diagram below that illustrates the reactive inputs in our application:
The inputs are collected by the variable input module2 and passed to the graph display module (as var_inputs()),3 where they become the reactive inputs() for the graph utility function,4 before finally being rendered.
Our application launches with pre-selected values for the x, y and color graph inputs, along with values for the size and opacity (alpha) of the points. Users can add a title or change the graph inputs, but by having pre-selected values, we guarantee the graph renders when the application launches.
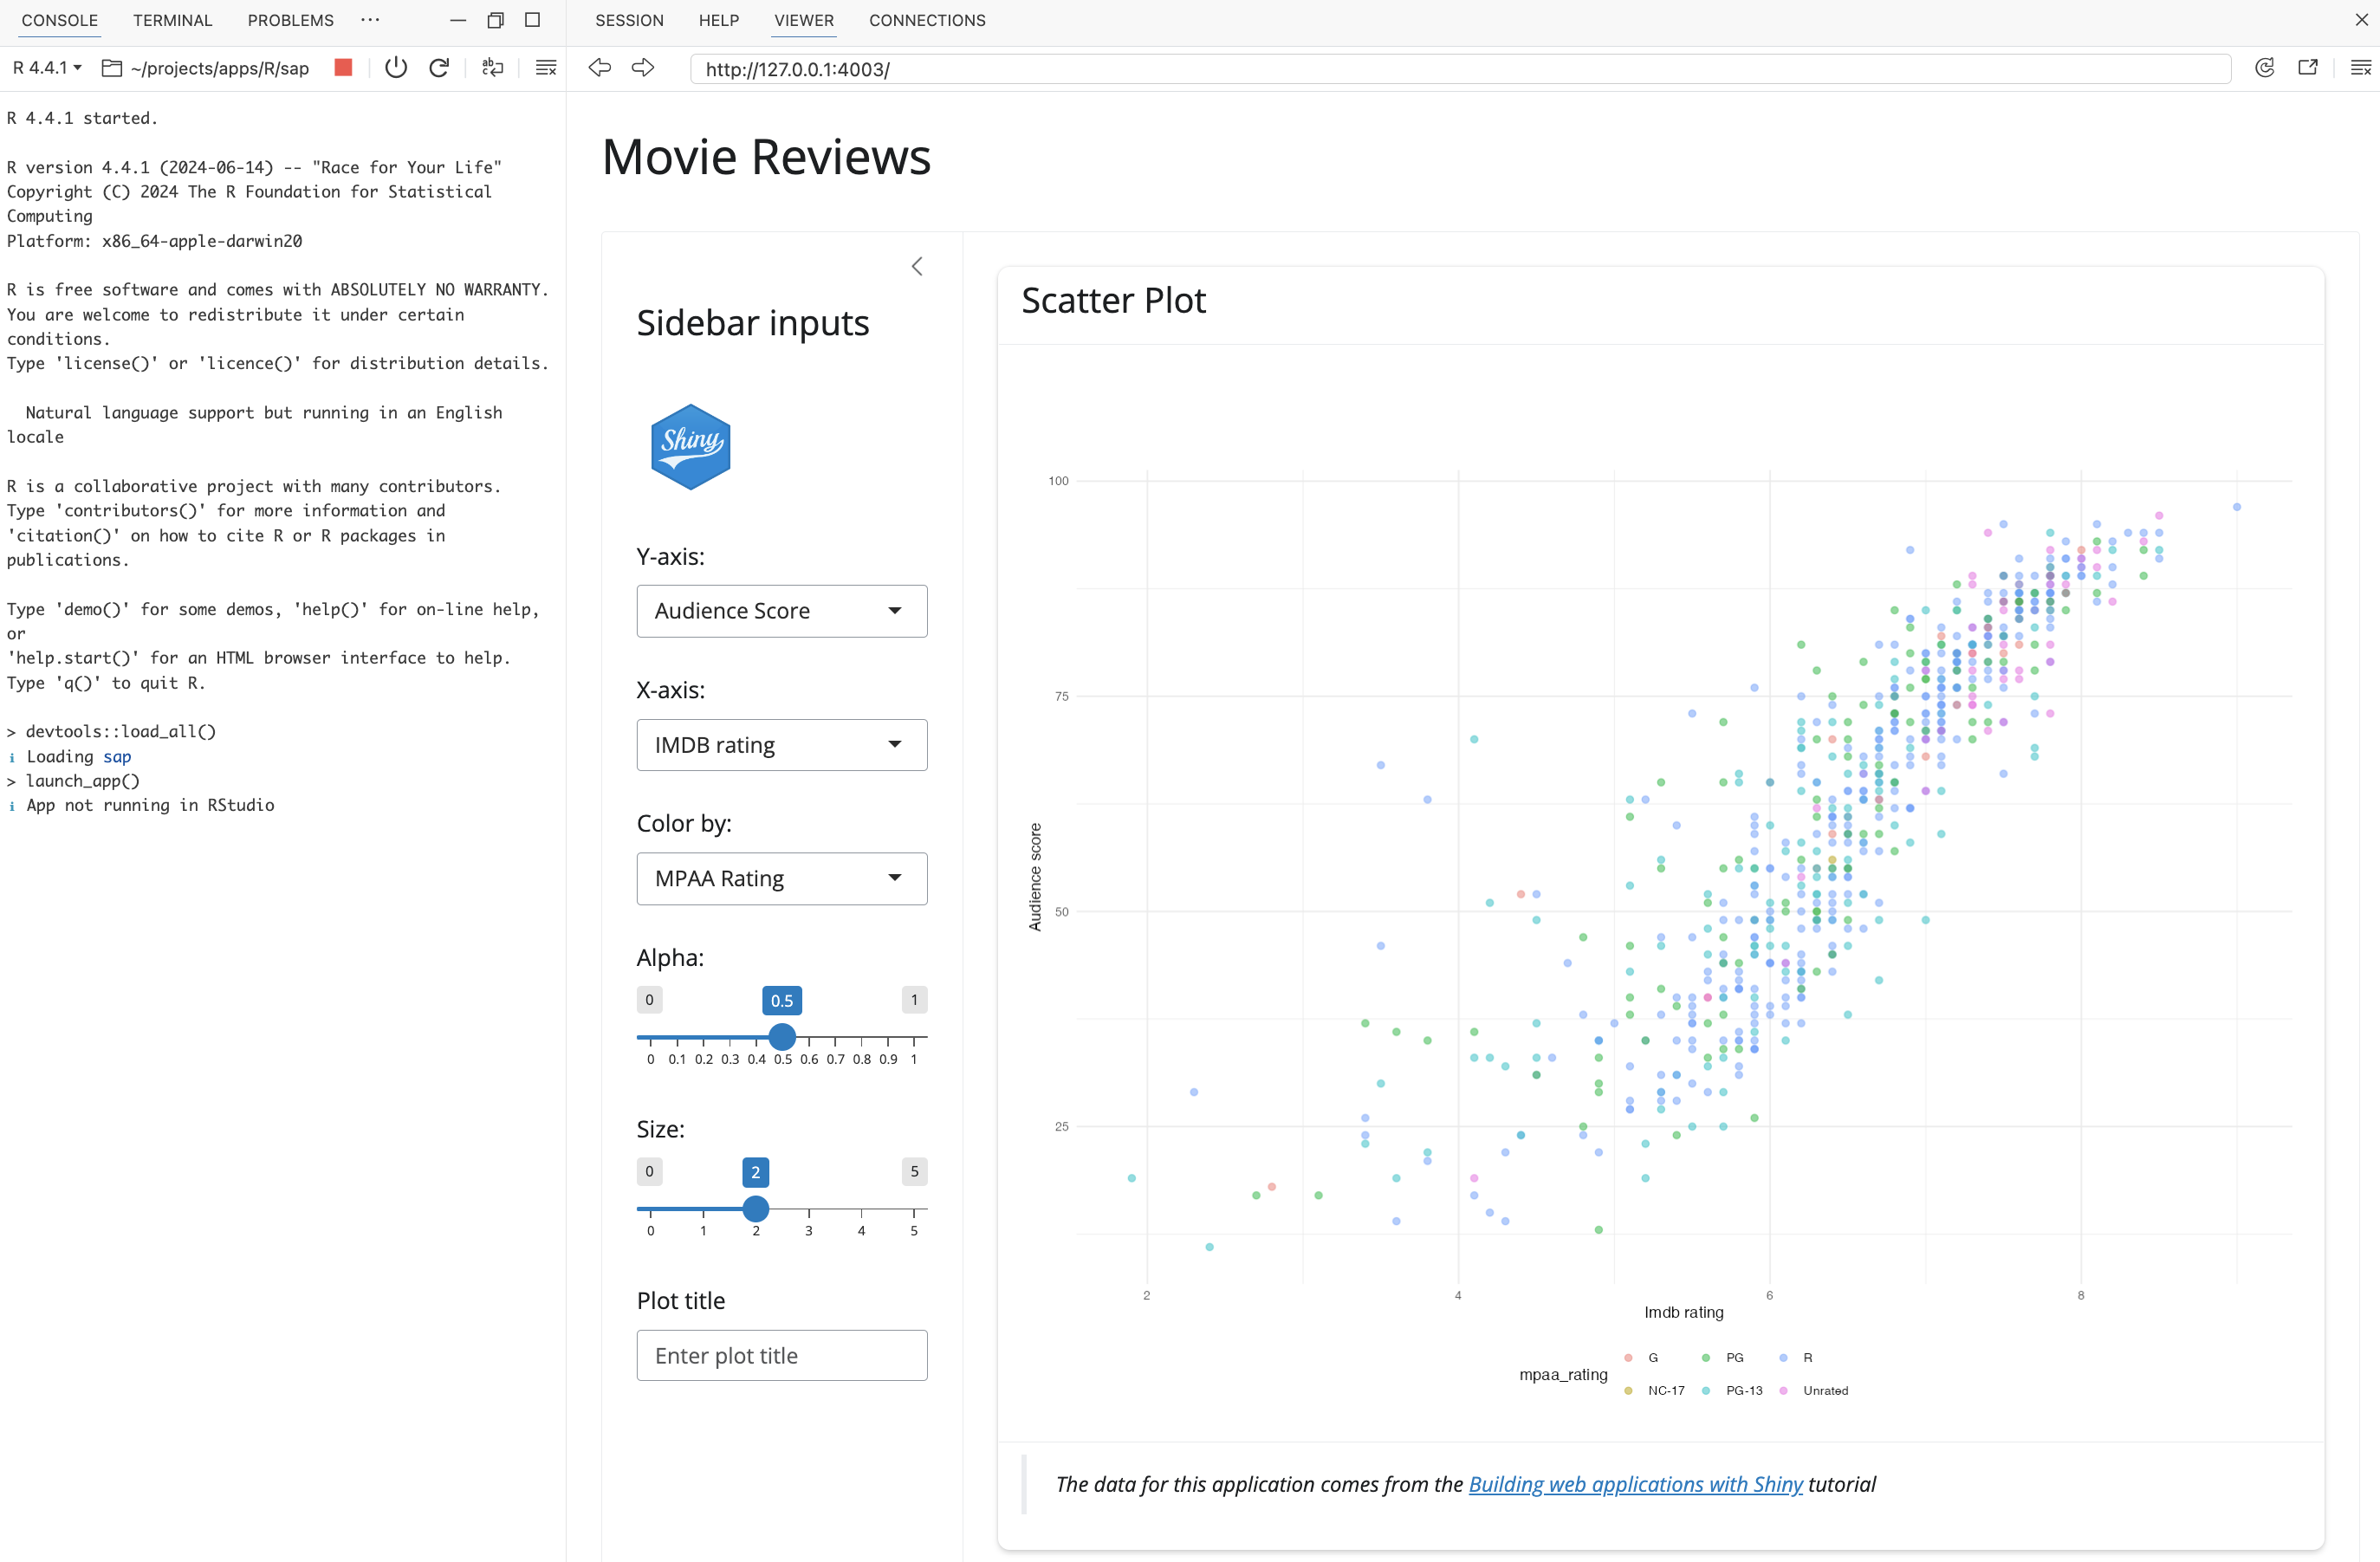
Any text entered for the title is converted to title case when the variable inputs are passed to the scatter plot display module. The reactives in the application are all updated with the new output:
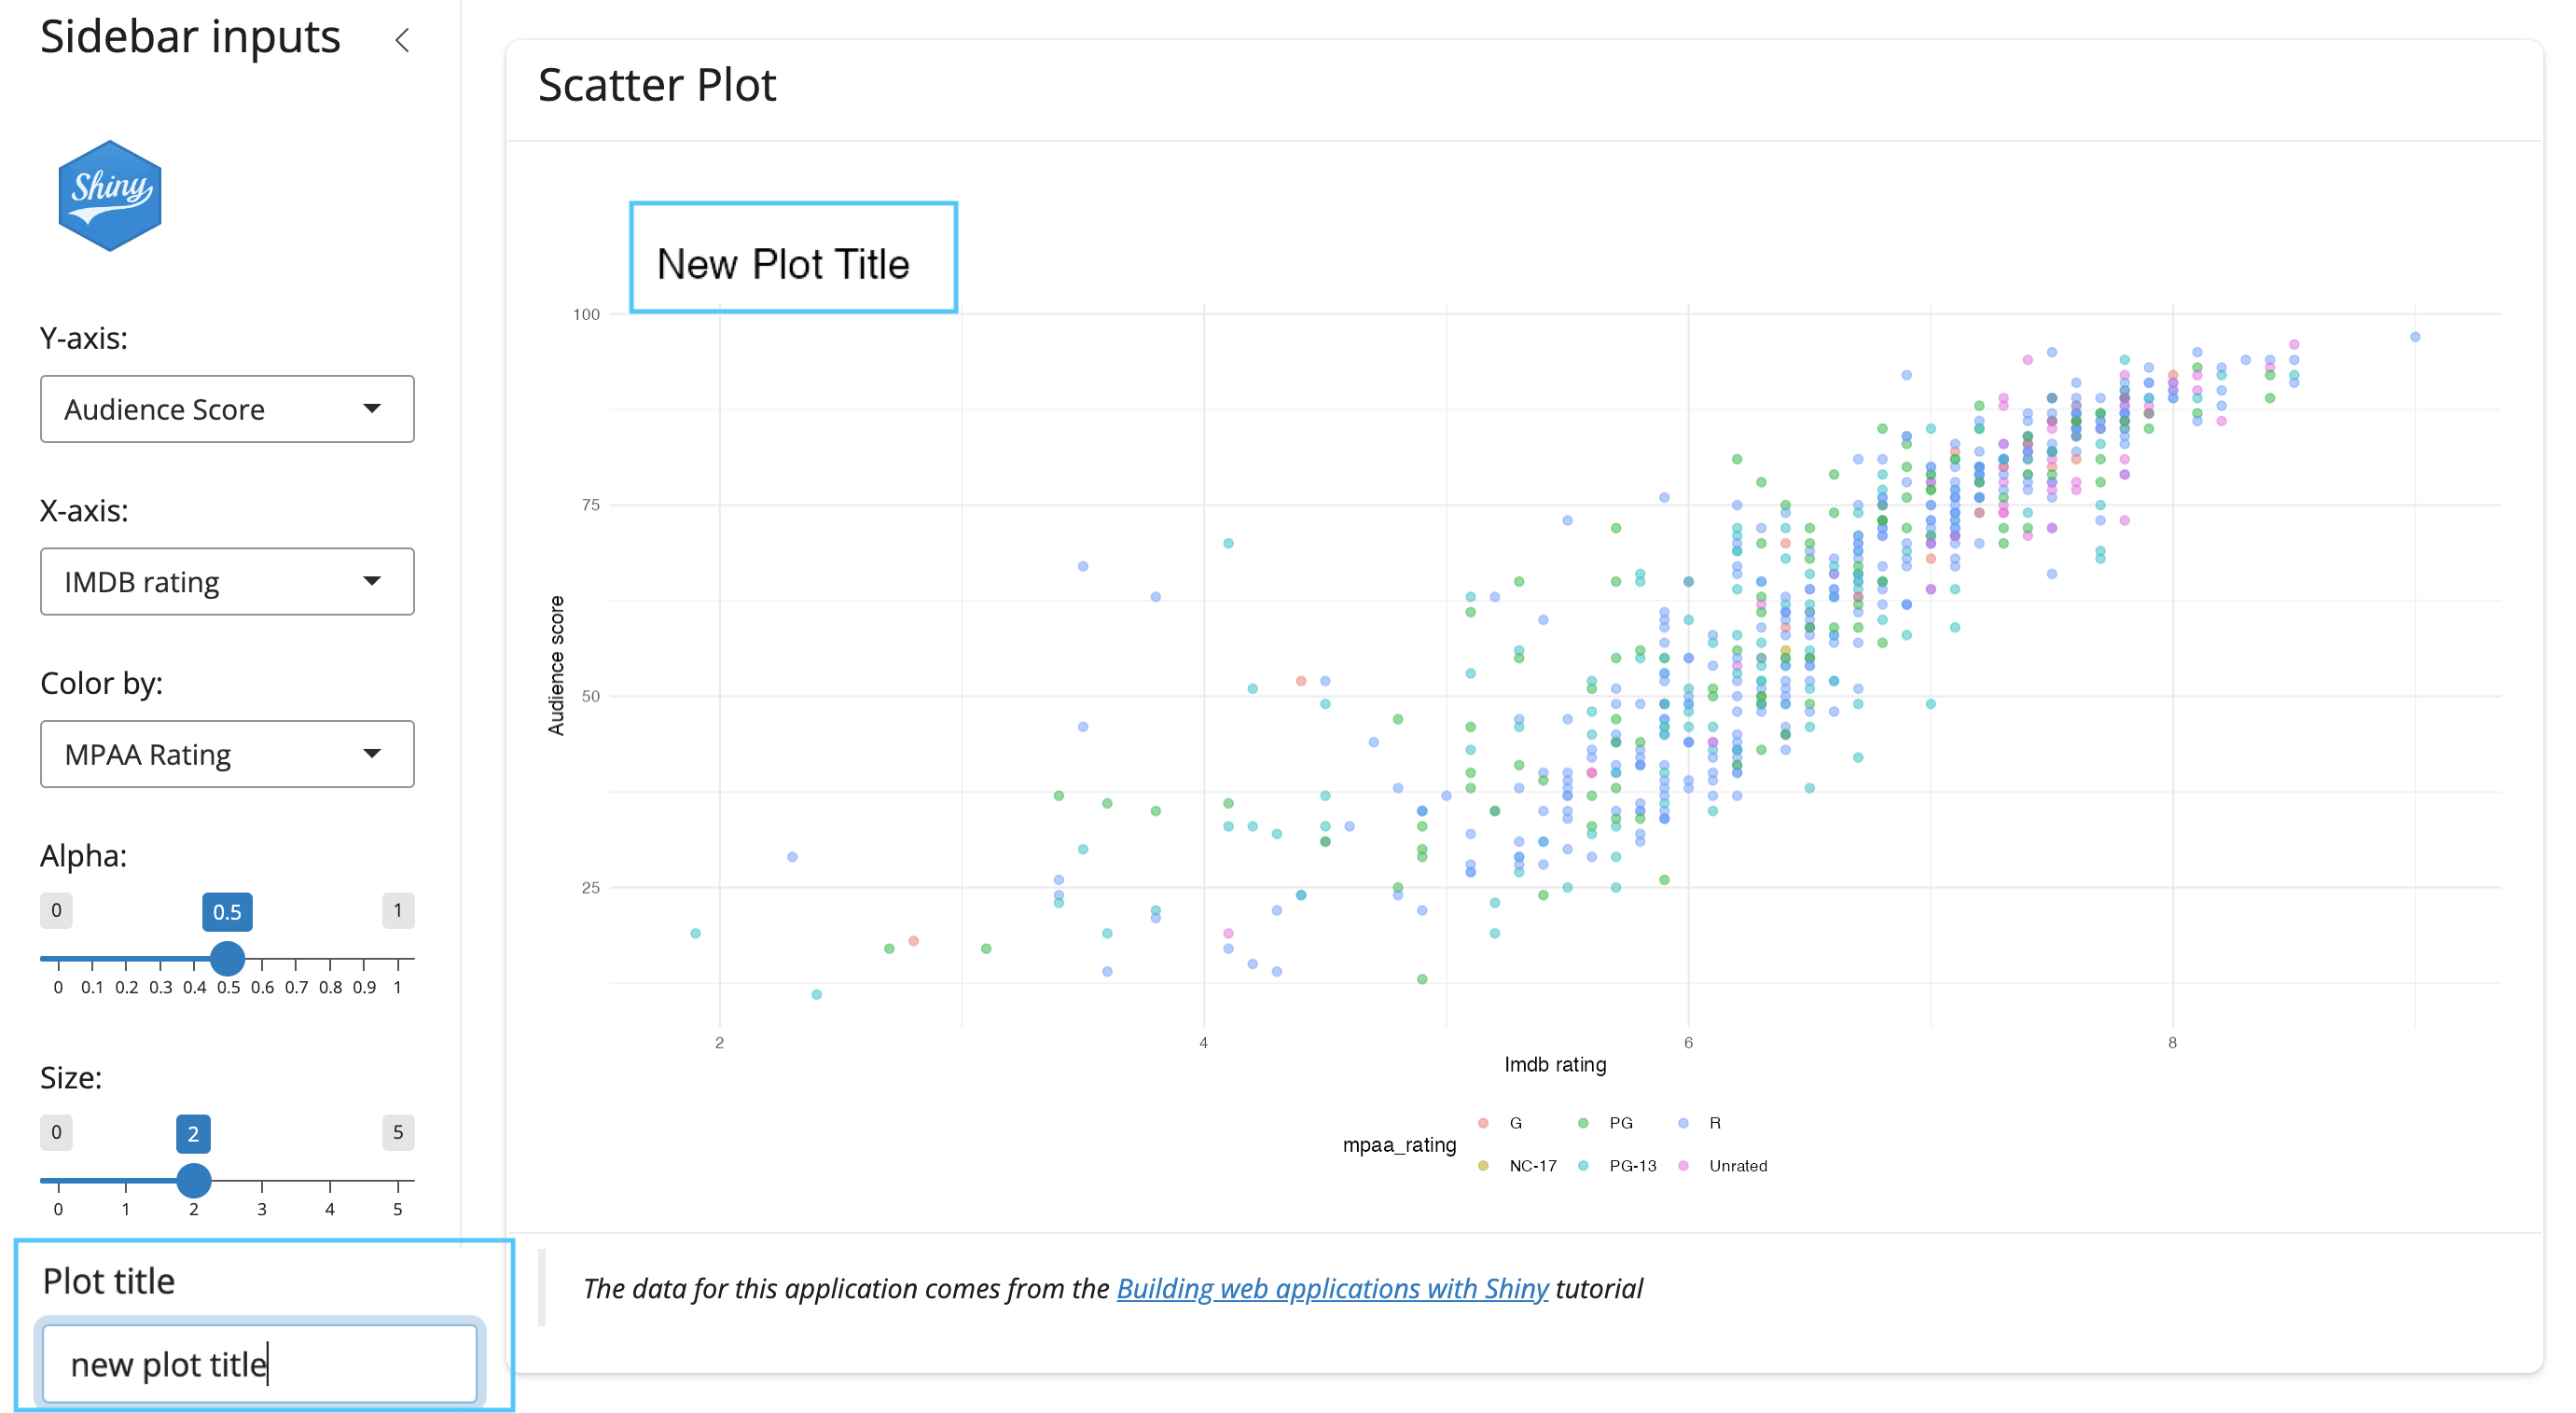
var_inputs() to inputs() and updates the graph to display the text.Shiny bugs
In Shiny apps, debugging can be challenging because the reactive model involves dynamic interactions and a non-linear flow of execution between inputs, reactive expressions, and outputs. Shiny is inherently asynchronous, so bugs can originate from reactive dependencies, execution order, utility functions, hidden states, lazy evaluation, and invalidation (i.e., reactive(), observe(), isolate(), etc.).
For example, we could have an incorrectly defined inputIds or outputIds in the UI, which causes our graph utility function to fail. We could also have missing parentheses on reactive values in the server. Finally, the bug could be originating from the output/render point.
%%{init: {'theme': 'neutral', 'themeVariables': { 'fontFamily': 'monospace', "fontSize":"16px"}}}%%
flowchart TD
    subgraph Inputs["<strong>Inputs</strong>"]
        subgraph Variables["Variables"]
        var_input[/"<code>input$x</code><br><code>input$y</code><br><code>input$z</code>"/]
        end
        subgraph Aesthetics["Aesthetics"]
        aes_input[/"<code>input$alpha</code><br><code>input$size</code>"/]
        end
        subgraph Title["Title"]
        plot_title[/"<code>input$plot_title</code>"/]
        end
    end
    IDs("🪲 <code>inputId</code> or <code>outputId</code> errors 🪲") --x var_input & aes_input & plot_title
    subgraph React["<strong>App Reactives</strong>"]
        var_inputs>"<code>var_inputs()</code> "]
        inputs>"<code>inputs()</code>"]
    end
    Obs("🪲 <code>observe</code> listener<br>errors 🪲") --x React
    Rxt("🪲 Reactive context<br>errors 🪲") --x Inputs & React
    subgraph Output["<strong>Output</strong>"]
        output[\"<code>output$scatterplot</code>"\]
    end
    Rend("🪲 <code>render_*</code> function<br>errors 🪲") ----x Output

    var_input & aes_input <==> var_inputs
    plot_title <-.-> var_inputs
    var_inputs <==> inputs
    inputs <==> output

    style var_input stroke:#333,stroke-width:1px,rx:5,ry:5
    style aes_input stroke:#333,stroke-width:1px,rx:5,ry:5
    style IDs stroke:#333,stroke-width:1px,rx:10,ry:10
    style Obs stroke:#333,stroke-width:1px,rx:10,ry:10
    style Rend stroke:#333,stroke-width:1px,rx:10,ry:10
    style Rxt stroke:#333,stroke-width:1px,rx:10,ry:10
Understanding the interplay of reactivity, lazy evaluation, and asynchronous execution will help us diagnose and resolve bugs in our Shiny app. We have to employ specific strategies and tools to handle Shiny bugs effectively, and some of the traditional debugging approaches can fall short in reactive contexts.
Debuggers
10 Debuggers covers the interactive debugger in the Positron ![]() IDE.
IDE.
Print debugging
11 Print debugging describes adapting common methods for debugging R code for Shiny applications.
Debugging apps
12 Debugging apps dives deeper into debugging modules and the server logic in our app-package.
Logging
13 Logging covers using logging to keep track of application and session behaviors.
The definition in this article from AWS gives a great general overview of debugging.↩︎
Our variable input model is in
R/mod_var_input.R.↩︎The graph display module is in
R/mod_scatter_display.R.↩︎The graph utility function is in
R/scatter_plot.R↩︎