vdiffr::expect_doppelganger(
      title = "name of graph",
      fig = # ...code to create graph...
)Appendix E — Tests (graph outputs)
If we want to create a graph snapshot test, the vdiffr package allows us to perform a ‘visual unit test’ by capturing the expected output as an .svg file that we can compare with future versions.
Launch app with the shinypak package:
launch('A.E-mocks-snapshots')The expect_doppelganger() function from vdiffr is designed specifically to work with ‘graphical plots’.
Another option for using snapshots for testing is the expect_snapshot_file() function 1 but expect_doppelganger() is probably the better option for comparing graph outputs.
E.0.1 Graph outputs and BDD
The Feature for the initial graph output from scatter_plot() might look like:
testthat::describe(
  "Feature: Scatter Plot Configuration in Movie Review Application
    As a user who accesses the movie review application,
    I want the initial scatter plot pre-configured with variables and aesthetics,
    So that I can immediately see a meaningful visualization.", code = {

})
Combining scenarios in the same test file is helpful if we’re trying to keep a 1:1 between the test/testthat/ file names and file names in R/.2
testthat::it(
"Scenario: Create scatter plot
Given I have launched the movie review exploration app,
When the scatter plot renders,
Then the points on the x axis should represent 'Ratings'
And the points on the y axis should represent 'Length'
And the points should be colored by 'MPAA' rating
And the opacity of the points should be set to '0.5'
And the size of the points should be set to '2'
And the plot title should be set to 'Enter plot title'",
code = {
test_logger(
start = "snap scatter_plot()",
msg = "initial x,y,z,size,alpha")
scatter_inputs <- list(
x = "imdb_rating",
y = "audience_score",
z = "mpaa_rating",
alpha = 0.5,
size = 2,
plot_title = "Enter plot title"
)
vdiffr::expect_doppelganger(
title = "Initial x y z axes",
fig = scatter_plot(movies,
x_var = scatter_inputs$x,
y_var = scatter_inputs$y,
col_var = scatter_inputs$z,
alpha_var = scatter_inputs$alpha,
size_var = scatter_inputs$size
) +
ggplot2::labs(
title = scatter_inputs$plot_title,
x = stringr::str_replace_all(
tools::toTitleCase(
scatter_inputs$x
), "_", " "
),
y = stringr::str_replace_all(
tools::toTitleCase(
scatter_inputs$y
), "_", " "
)
) +
ggplot2::theme_minimal() +
ggplot2::theme(legend.position = "bottom")
)
test_logger(
end = "snap scatter_plot()",
msg = "initial x,y,z,size,alpha")
}
)- 1
-
Test scope
- 2
-
Log start
- 3
-
Initial
moviesvariable inputs forx,y, andzfrom UI
- 4
-
Snapshot with initial values
- 5
- Log end
Test results also return the output from test_logger() with the context I’ve added on what’s being tested.
E.0.2 Snapshots
We also see a warning when the snapshot has been saved in the tests/testthat/_snaps/ folder the first time the test is run:
── Warning (test-scatter_plot.R:124:9):
      Scenario: Create scatter plot
          Given I have launched the movie review exploration app,
          When the scatter plot renders,
          Then the points on the x axis should represent 'Ratings'
          And the points on the y axis should represent 'Length'
          And the points should be colored by 'MPAA' rating
          And the size of the points should be set to '2'
          And the opacity of the points should be set to '0.5' ──
Adding new file snapshot: 'tests/testthat/_snaps/initial-x-y-z-axes.svg'

── Warning (test-scatter_plot.R:186:7):
      Scenario: Change x, y, color values for plotting
        When I launch the Scatter Plot Data Visualization
        And I select the variable 'Audience Score' for the x-axis
        And I select the variable 'IMDB Rating' for the y-axis
        And I select the variable 'Critics Rating' for the color
        Then the scatter plot should show 'Audience Score' on the x-axis
        And the scatter plot should show 'IMDB Rating' on the y-axis
        And the points on the scatter plot should be colored by 'Critics Rating' ──
Adding new file snapshot: 'tests/testthat/_snaps/updated-x-y-color.svg'
[ FAIL 0 | WARN 2 | SKIP 0 | PASS 2 ]
On subsequent runs, this warning will disappear (as long as there are no changes to the .svg files).
INFO [2023-10-27 10:58:25] [ START snap scatter_plot() = initial x,y,z,size,alpha]
[ FAIL 0 | WARN 1 | SKIP 0 | PASS 3 ]
INFO [2023-10-27 10:58:25] [ END snap scatter_plot() = initial x,y,z,size,alpha]
E.0.3 Comparing graph objects
Below is the output from diffobj::diffObj() comparing our custom plotting function (scatter_plot()) against a graph built with analogous ggplot2 code:
ggp_graph <- ggplot2::ggplot(mtcars,
              ggplot2::aes(x = mpg, y = disp)) +
              ggplot2::geom_point(
                ggplot2::aes(color = cyl),
                             alpha = 0.5,
                             size = 3)

app_graph <- scatter_plot(mtcars,
                  x_var = "mpg",
                  y_var = "disp",
                  col_var = "cyl",
                  alpha_var = 0.5,
                  size_var = 3)

diffobj::diffObj(ggp_graph, app_graph)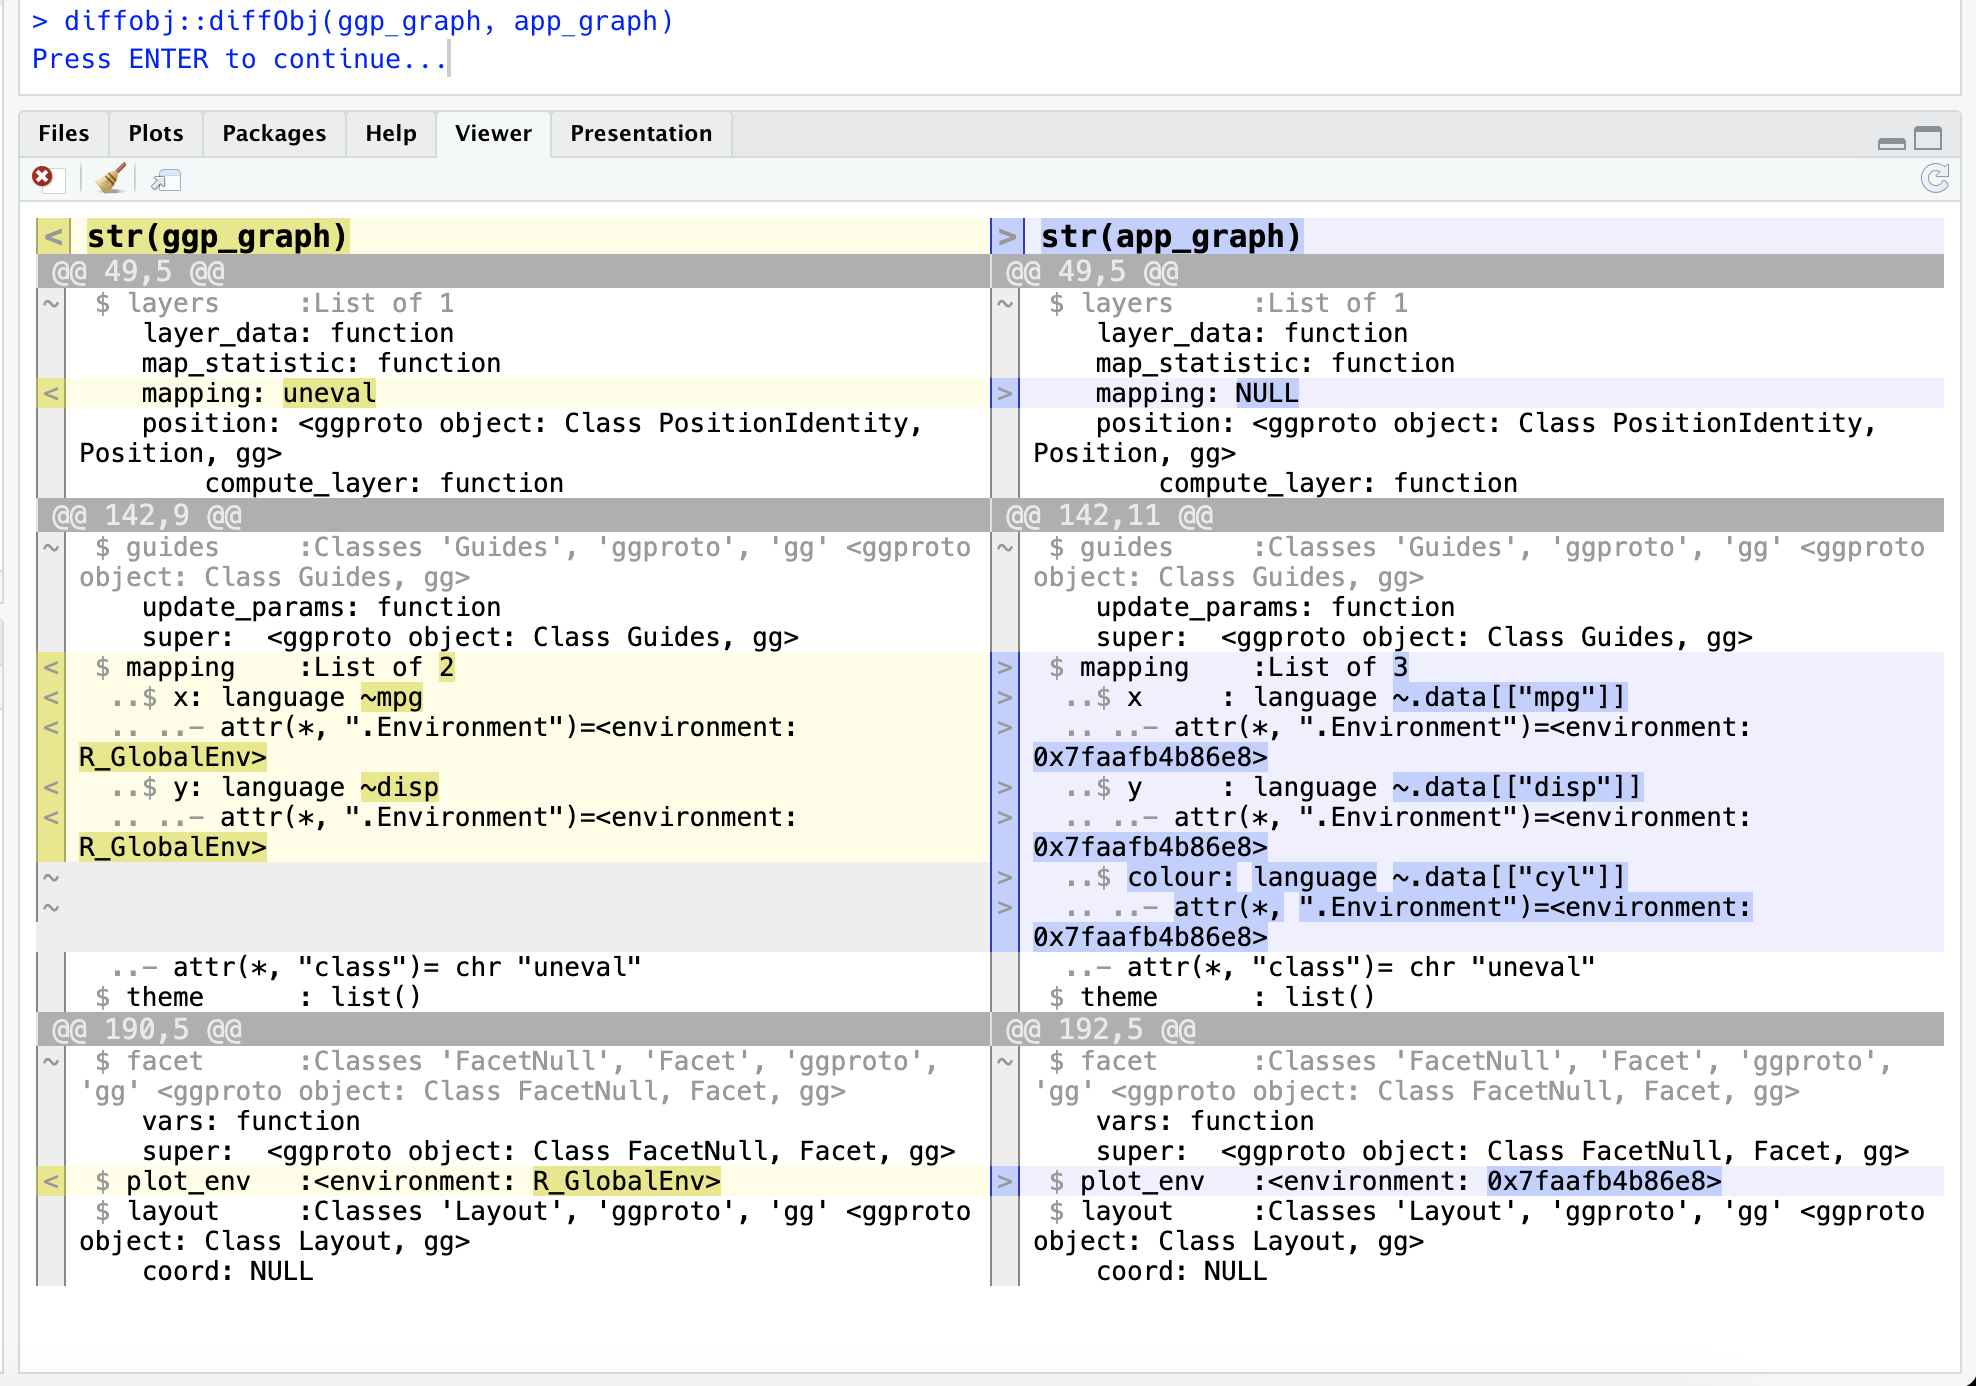
diffobj::diffObj() on graph outputsThe output shows us all the potential points of failure when comparing complex objects like graphs (despite the actual outputs appearing identical), so it’s best to limit the number of ‘visual unit tests’ unless they’re absolutely necessary.
Follow the
expect_snapshot_file()example from thetestthatdocumentation↩︎matching files names between
R/andtests/testthat/keeps our code organized and ensures thedevtools::test_coverage_active_file()function works.↩︎