# install.packages('pak')
pak::pak('mjfrigaard/shinypak')15 Utility functions
When building Shiny app-packages, debugging plays a crucial role in ensuring that our app works as expected and integrates seamlessly into the package structure. Posit Workbench’s debugging tools are covered elsewhere, so this chapter will focus on debugging Shiny code and functions inside an R package.1
One of the most effective tools for debugging in R is the browser() function.
Ctrl/Cmd + Shift + L
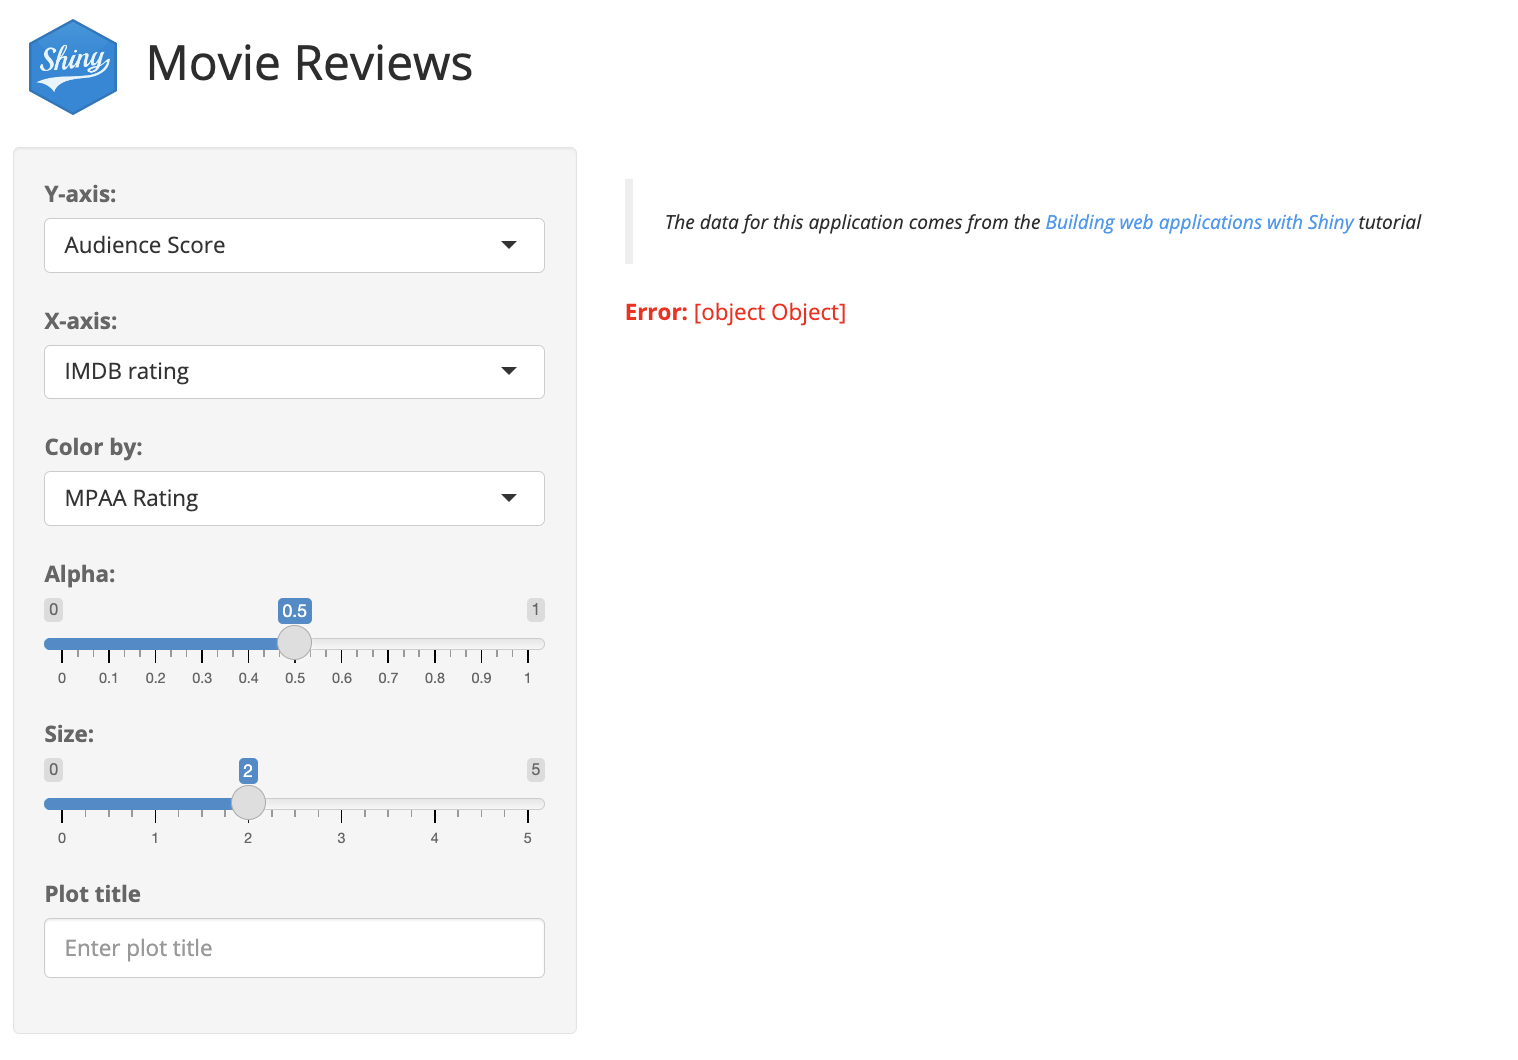
Let’s start by debugging the scatter plot in launch_app(). After loading, documenting and installing sap, launch the application:
launch_app(test = FALSE)The error printed in the UI is not very descriptive, but fortunately the following output is also printed to the Console:
ggplot2 has excellent error messages 👌
Warning: Error in ggplot2::geom_point: Problem while computing aesthetics.
ℹ Error occurred in the 1st layer.
Caused by error in `.data[[NULL]]`:
! Must subset the data pronoun with a string, not `NULL`.
We can see the error is coming from ggplot2::geom_point(), specifically from one of the calls to .data. We can safely assume the source of this bug is the scatter_plot() utility function. However, we’ll proceed as if the message wasn’t very helpful or informative.
Debugging strategies
The two most common tools I use for debugging are:
- Wrapping
browser()in a call toobserve()
- Capturing reactive values with
reactiveValuesToList()and sending output to the UI
These two methods cover 90% of my Shiny app debugging needs. In the following sections, I’ll provide examples of how–and when–I use each method.
15.0.1 browser()
browser() pauses code execution and activates the interactive debugger mode in the IDE, allowing us to view objects, execute code, and ‘step through’ each function line.
15.0.2 observe()
Shiny’s reactive model can make debugging challenging because the issues aren’t limited to the internal logic or calculations. Bugs can also be caused by the timing, sequence, or creation of reactive values. observe() creates a reactive observer that ‘listens’ for changes to reactive expressions (and executes code in response).
Wrapping browser() with observe() will trigger the debugger when the observer is invalidated, allowing us to interactively examine variables and reactive expressions (within the scope of the observe() function):
server <- function(input, output, session) {
observe({
browser()
returned_values <- mod_something("bla")
mod_something_else("blabla", input_values = returned_values)
})
}- 1
- Shiny server function
- 2
-
observe()function scope
- 3
-
Call to
browser()(called at the top of theobserve()scope)
Launch app with the shinypak package:
launch('25.3_debug-scatter_plot')If we want to debug the scatter plot output, we need to move our observe(browser()) functions inside the call to renderPlot():
output$scatterplot <- renderPlot({
observe({
browser()
})
})- 1
-
Observe scope
- 2
-
Call to
browser()
Load the package and run the application again:
Ctrl/Cmd + Shift + L
ℹ Loading saplaunch_app(options = list(test.mode = FALSE), run = 'p')Inside renderPlot(), we can progress to the creation of the plot object:
Browse[1]> ndebug at sap/R/mod_scatter_display.R#68:
plot <- scatter_plot(
df = movies,
x_var = inputs()$x,
y_var = inputs()$y,
col_var = inputs()$col,
alpha_var = inputs()$alpha,
size_var = inputs()$size)From here we can step inside the scatter_plot() utility function to identify the source of the error:
Browse[2]> ss in the debugger console to ‘step into’ scatter_plot()
Note the changes in the debugger console when we ‘step into’ scatter_plot():
debugging in:
scatter_plot(df = movies,
x_var = inputs()$x,
y_var = inputs()$y,
col_var = inputs()$col,
alpha_var = inputs()$alpha,
size_var = inputs()$size)
debug at /sap/R/scatter_plot.R#30:
{
ggplot2::ggplot(data = df,
ggplot2::aes(x = .data[[x_var]],
y = .data[[y_var]],
color = .data[[col_var]])) +
ggplot2::geom_point(alpha = alpha_var,
size = size_var)
}- 1
- Location of debugger in utility function
After some examination, we can identify the source of the error.
show/hide source of scatter_plot() bug
inputs <- reactive({
plot_title <- tools::toTitleCase(var_inputs()$plot_title)
list(
x = var_inputs()$x,
y = var_inputs()$y,
col = var_inputs()$z,
alpha = var_inputs()$alpha,
size = var_inputs()$size,
plot_title = plot_title
)
})
plot <- scatter_plot(
df = movies,
x_var = inputs()$x,
y_var = inputs()$y,
col_var = inputs()$z,
alpha_var = inputs()$alpha,
size_var = inputs()$size
)- 1
-
Color is assigned as
colininputs
- 2
-
Color is passed to
scatter_plot()ascol_var
For an introduction to the IDE’s debugging tools, see this Posit article. Debugging is also covered in Advanced R, 2ed and Mastering Shiny.↩︎

