---
title: "Alluvial charts"
format:
html:
toc: true
toc-location: right
toc-title: Contents
code-fold: true
out-height: '100%'
out-width: '100%'
execute:
warning: false
message: false
---
```{r}
#| label: setup
#| message: false
#| warning: false
#| include: false
library(tidyverse)
library(lubridate)
library(scales)
library(knitr)
library(kableExtra)
library(colorblindr)
library(downlit)
# options ----
options(
repos = "https://cloud.r-project.org",
dplyr.print_min = 6,
dplyr.print_max = 6,
scipen = 9999)
# fonts ----
library(extrafont)
library(sysfonts)
# import font
extrafont::font_import(
paths = "assets/Ubuntu/",
prompt = FALSE)
# add font
sysfonts::font_add(
family = "Ubuntu",
regular = "assets/Ubuntu/Ubuntu-Regular.ttf")
# use font
showtext::showtext_auto()
# add theme
source("R/theme_ggp2g.R")
# set theme
ggplot2::theme_set(theme_ggp2g(
base_size = 11))
devtools::install_github("corybrunson/ggalluvial")
install.packages("palmerpenguins")
```
:::: {.callout-note collapse="false" icon=false}
## Graph info
::: {style="font-size: 1.25em; color: #02577A;"}
**Should I use this graph?**
:::
<br>
```{r}
#| label: full_code_display
#| eval: true
#| echo: false
#| warning: false
#| message: false
#| out-height: '60%'
#| out-width: '60%'
#| fig-align: right
library(ggalluvial)
library(palmerpenguins)
library(ggplot2)
library(patchwork)
peng_wide <- penguins |>
drop_na() |>
count(year, island, sex, species) |>
mutate(year = factor(year)) |>
rename(freq = n)
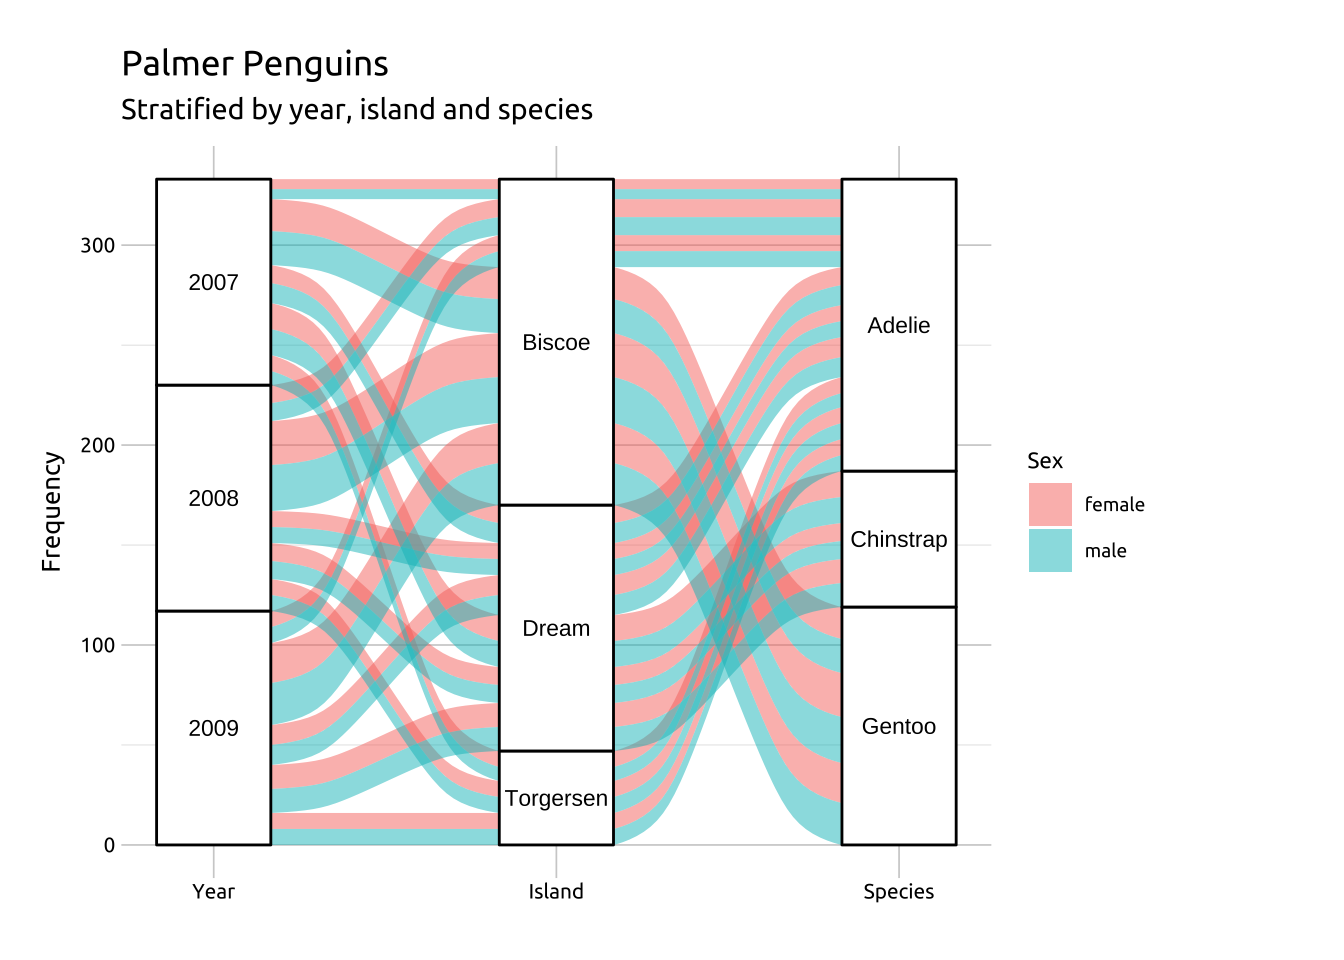
labs_alluvial <- ggtitle(label = "Palmer Penguins",
subtitle = "Stratified by year, island and species")
labs_alluvial_y <- ylab("Frequency")
labs_alluvial_fill <- labs(fill = "Sex")
ggp2_alluvial_w <- ggplot(data = peng_wide,
aes(axis1 = year, axis2 = island,
axis3 = species, y = freq)) +
scale_x_discrete(
limits = c("Year", "Island", "Species"),
expand = c(0.1, 0.07)) +
geom_alluvium(aes(fill = sex)) +
geom_stratum() +
geom_text(stat = "stratum",
aes(label = after_stat(stratum)),
size = 3)
ggalluvial_wide <- ggp2_alluvial_w +
labs_alluvial +
labs_alluvial_y +
labs_alluvial_fill +
theme_ggp2g(base_size = 12)
ggalluvial_wide
```
::: {style="font-size: 1.10em; color: #02577A;"}
**This graph requires:**
:::
::: {style="font-size: 0.90em; color: #043b67;"}
`r emo::ji("check")` multiple categorical variables
:::
::: {style="font-size: 0.90em; color: #043b67;"}
`r emo::ji("check")` a date variable
:::
::::
## Description
An alluvial graph displays the changes in composition or flow over time or across multiple categories.
We can build alluvial charts in `ggplot2` with the [`ggalluvial` package:](https://corybrunson.github.io/ggalluvial/).
See also: [parallel sets](https://mjfrigaard.github.io/ggp2-gallery/rela/parallel_sets.html)
## Getting set up
:::: {.panel-tabset}
### Packages
::: {style="font-size: 1.15em; color: #1e83c8;"}
**PACKAGES:**
:::
::: {style="font-size: 0.85em;"}
Install packages.
:::
::: {style="font-size: 0.75em;"}
```{r}
#| label: pkg_code_alluvial
#| code-fold: show
#| eval: true
#| echo: true
#| warning: false
#| message: false
#| results: hide
devtools::install_github("corybrunson/ggalluvial")
library(ggalluvial)
install.packages("palmerpenguins")
library(palmerpenguins)
library(ggplot2)
```
:::
### Data
::: {style="font-size: 1.15em; color: #1e83c8;"}
**DATA:**
:::
::: {.column-margin}
{fig-align="right" width="100%" height="100%"}
:::
::: {style="font-size: 0.85em;"}
Below we create a wide example of the `penguins` data (as `peng_wide`)
:::
::: {style="font-size: 0.75em;"}
```{r}
#| label: data_code_alluvial
#| eval: true
#| echo: true
peng_wide <- penguins |>
  tidyr::drop_na() |>
  dplyr::count(year, island, sex, species) |>
  dplyr::mutate(year = factor(year)) |>
  dplyr::rename(freq = n)
glimpse(peng_wide)
```
:::
::::
## The grammar
:::: {.panel-tabset}
### Code
::: {style="font-size: 1.15em; color: #1e83c8;"}
**CODE:**
:::
::: {style="font-size: 0.85em;"}
Create labels with `labs()` (with `ggtitle()`, `ylab()`, and `labs()`)
Add `scale_x_discrete()` with the `limits` set to `"Year"`, `"Island"` and `"Species"`, and `expand` to `0.1` and `0.07`
Add `geom_alluvium()` with `fill` set to the `sex` variable and `geom_stratum()`
Add `geom_text()`, with `stat` set to `stratum` and label set to `after_stat(stratum)` (*inside* `aes()`)
:::
::: {style="font-size: 0.75em;"}
```{r}
#| label: code_graph_alluvial
#| code-fold: show
#| eval: false
#| echo: true
#| warning: false
#| message: false
#| out-height: '100%'
#| out-width: '100%'
#| column: page-inset-right
#| layout-nrow: 1
labs_alluvial <- ggtitle(label = "Palmer Penguins",
    subtitle = "Stratified by year, island and species")
labs_alluvial_y <- ylab("Frequency")
labs_alluvial_fill <- labs(fill = "Sex")

ggp2_alluvial_w <- ggplot(data = peng_wide,
  aes(axis1 = year, axis2 = island,
      axis3 = species, y = freq)) +
  scale_x_discrete(
    limits = c("Year", "Island", "Species"),
    expand = c(0.1, 0.07)) +
  geom_alluvium(aes(fill = sex)) +
  geom_stratum() +
  geom_text(stat = "stratum",
    aes(label = after_stat(stratum)),
      size = 3)

ggp2_alluvial_w +
  labs_alluvial +
  labs_alluvial_y +
  labs_alluvial_fill
```
:::
### Graph
::: {style="font-size: 1.15em; color: #1e83c8;"}
**GRAPH:**
:::
::: {style="font-size: 0.85em;"}
The `ggalluvial` functions can handle wide or long data.
:::
```{r}
#| label: create_graph_alluvial
#| eval: true
#| echo: false
#| warning: false
#| message: false
#| out-height: '100%'
#| out-width: '100%'
#| column: page-inset-right
#| layout-nrow: 1
labs_alluvial <- ggtitle(label = "Palmer Penguins",
subtitle = "Stratified by year, island and species")
labs_alluvial_y <- ylab("Frequency")
labs_alluvial_fill <- labs(fill = "Sex")
ggp2_alluvial_w <- ggplot(data = peng_wide,
aes(axis1 = year, axis2 = island,
axis3 = species, y = freq)) +
scale_x_discrete(
limits = c("Year", "Island", "Species"),
expand = c(0.1, 0.07)) +
geom_alluvium(aes(fill = sex)) +
geom_stratum() +
geom_text(stat = "stratum",
aes(label = after_stat(stratum)),
size = 2.5)
ggp2_alluvial_w +
labs_alluvial +
labs_alluvial_y +
labs_alluvial_fill +
theme_ggp2g(base_size = 13)
```
::::
## More info
The `ggalluvial` package can also help reshape data with the `to_lodes_form()` function.
:::: {.panel-tabset}
### Data
::: {style="font-size: 1.15em; color: #1e83c8;"}
**DATA:**
:::
::: {style="font-size: 0.85em;"}
Below we create `peng_lodes` from the `penguins` dataset using the `to_lodes_form()` from the `ggalluvial` package.
:::
::: {style="font-size: 0.75em;"}
```{r}
#| label: data_code_alluvial_lf
#| eval: true
#| echo: true
peng_lodes <- penguins |>
  dplyr::select(Year = year, Island = island,
         Species = species, Sex = sex) |>
  tidyr::drop_na() |>
  dplyr::count(Year, Island, Species, Sex) |>
  dplyr::mutate(Year = factor(Year)) |>
  dplyr::rename(Freqency = n) |>
  ggalluvial::to_lodes_form(key = "Measure", axes = 1:3)
glimpse(peng_lodes)
```
:::
### Graph
::: {style="font-size: 1.15em; color: #1e83c8;"}
**CODE:**
:::
::: {style="font-size: 0.85em;"}
Create labels with `labs()`
Map `Measure` to `x`, `Frequency` to `y`, `stratum` to `stratum`, `alluvium` to `alluvium`, and `label` to `stratum`.
Add the `geom_alluvium()` and map `Sex` to `fill`
Add the `geom_stratum()` and set the `width` to `0.45`
Add `geom_text()` and set `stat` to `"stratum"`
:::
::: {style="font-size: 0.75em;"}
```{r}
#| label: create_graph_alluvial_lf
#| eval: true
#| echo: false
#| warning: false
#| message: false
#| out-height: '100%'
#| out-width: '100%'
#| column: page-inset-right
#| layout-nrow: 1
labs_alluvial <- ggtitle(label = "Palmer Penguins",
subtitle = "Stratified by year, island and species")
ggp2_alluvial_lf <- ggplot(
data = peng_lodes,
aes(x = Measure,
y = Freqency,
stratum = stratum,
alluvium = alluvium,
label = stratum)) +
ggalluvial::geom_alluvium(aes(fill = Sex)) +
ggalluvial::geom_stratum(width = 0.45) +
geom_text(stat = "stratum", size = 2.5)
ggp2_alluvial_lf +
labs_alluvial +
theme_ggp2g(base_size = 13)
```
:::
::::