---
title: "Pie charts"
format:
html:
toc: true
toc-location: right
toc-title: Contents
code-fold: true
out-height: '100%'
out-width: '100%'
execute:
warning: false
message: false
---
```{r}
#| label: setup
#| message: false
#| warning: false
#| include: false
library(tidyverse)
library(lubridate)
library(scales)
library(knitr)
library(kableExtra)
library(colorblindr)
library(downlit)
# options ----
options(
repos = "https://cloud.r-project.org",
dplyr.print_min = 6,
dplyr.print_max = 6,
scipen = 9999)
# fonts ----
library(extrafont)
library(sysfonts)
# import font
extrafont::font_import(
paths = "assets/Ubuntu/",
prompt = FALSE)
# add font
sysfonts::font_add(
family = "Ubuntu",
regular = "assets/Ubuntu/Ubuntu-Regular.ttf")
# use font
showtext::showtext_auto()
# add theme
source("R/theme_ggp2g.R")
# set theme
ggplot2::theme_set(theme_ggp2g(
base_size = 16))
# install data packages ----
install.packages("ggplot2movies")
install.packages("ggpubr")
```
:::: {.callout-note collapse="false" icon=false}
## Graph info
::: {style="font-size: 1.25em; color: #02577A;"}
**Should I use this graph?**
:::
<br>
```{r}
#| label: full_code_display
#| eval: true
#| echo: false
#| warning: false
#| message: false
#| out-height: '60%'
#| out-width: '60%'
#| fig-align: right
library(ggplot2movies)
library(ggplot2)
library(ggpubr)
penguins_bar <- palmerpenguins::penguins |>
filter(!is.na(species))
movie_pie <- ggplot2movies::movies |>
filter(mpaa != "" & mpaa != "NC-17") |>
group_by(mpaa) |>
summarise(cnt = n()) |>
mutate(
perc = round(cnt / sum(cnt), 3),
mpaa = factor(mpaa,
levels = c("PG", "PG-13", "R")))
labs <- paste0(movie_pie$mpaa, " (",
(100*movie_pie$perc), "%)")
labs_pie <- labs(
title = "Percent MPAA ratings for IMDB movies",
x = "Percent MPAA rating")
ggp2_pie <- ggpubr::ggpie(movie_pie,
x = "perc", label = labs,
lab.pos = "in", lab.font = "white",
fill = "mpaa", color = "white") +
theme(legend.position = "none")
ggp2_pie +
labs_pie
```
::: {style="font-size: 1.10em; color: #02577A;"}
**This graph requires:**
:::
::: {style="font-size: 0.90em; color: #043b67;"}
`r emo::ji("check")` a categorical variable
:::
::::
## Description
*“In general, pie charts work well when the goal is to emphasize simple fractions, such as one-half, one-third, or one-quarter.”*
*“They also work well when we have very small datasets.”* - [Claus O. Wilke, Fundamentals of Data Visualization (2019)](https://clauswilke.com/dataviz/)
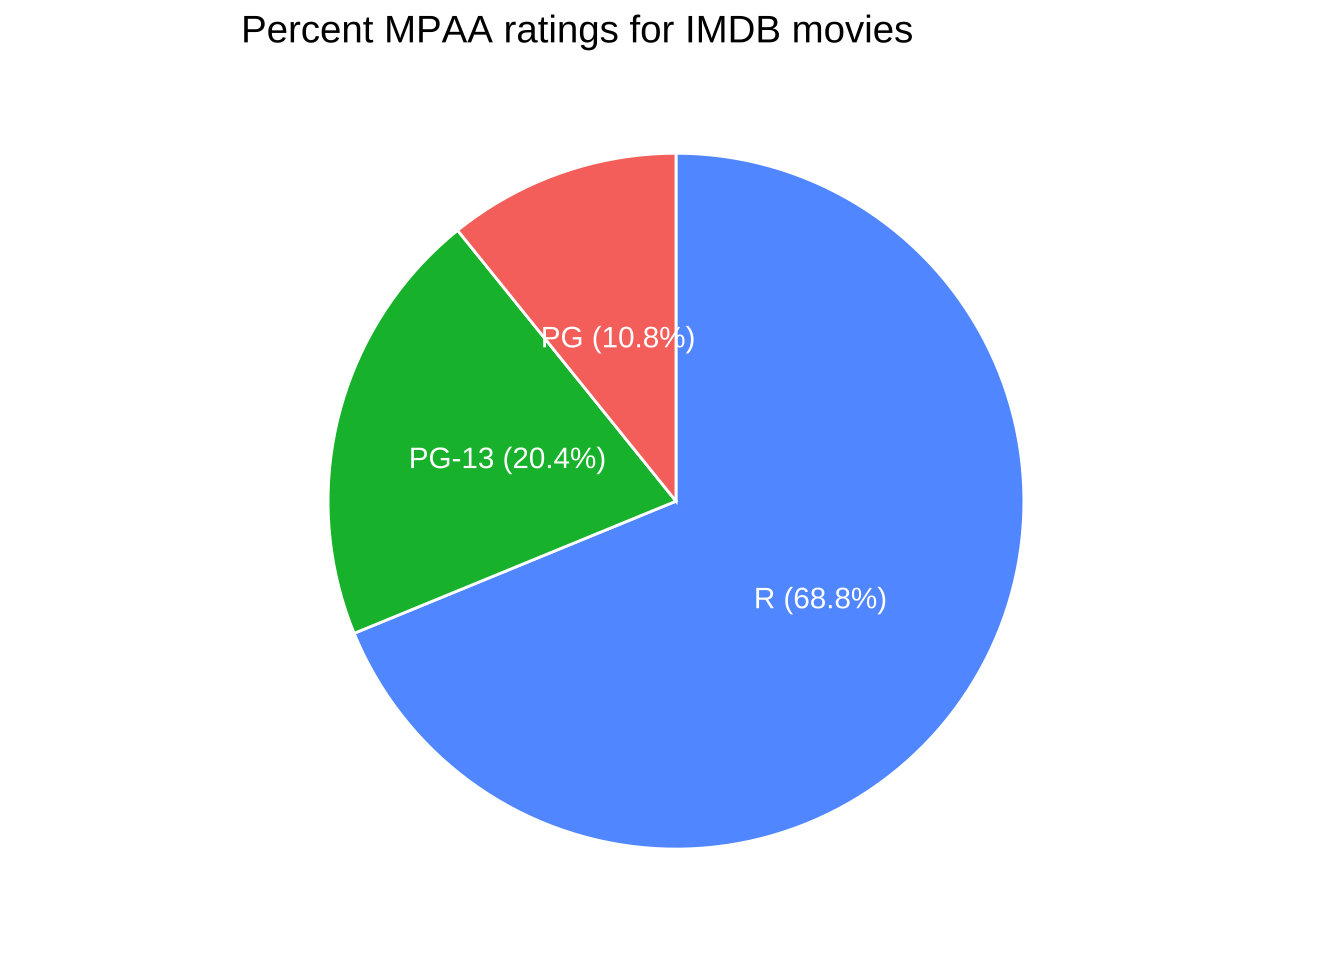
Pie-charts are ideal for comparing the proportions of categorical variable values, and we can build pie-charts using the [`ggpubr` package.](https://rpkgs.datanovia.com/ggpubr/)
## Getting set up
:::: {.panel-tabset}
### Packages
::: {style="font-size: 1.15em; color: #1e83c8;"}
**PACKAGES:**
:::
::: {style="font-size: 0.85em;"}
Install packages.
:::
::: {style="font-size: 0.75em;"}
```{r}
#| label: pkg_code_pie
#| code-fold: show
#| eval: true
#| echo: true
#| warning: false
#| message: false
#| results: hide
install.packages("ggpubr")
library(ggpubr)
install.packages("ggplot2movies")
library(ggplot2movies)
library(ggplot2)
```
:::
### Data
::: {style="font-size: 1.15em; color: #1e83c8;"}
**DATA:**
:::
::: {.column-margin}
{fig-align="right" width="35%" height="35%"}
:::
::: {style="font-size: 0.85em;"}
Remove the missing values and `"NC-17"` from `mpaa` and summarise the count and percent.
:::
::: {style="font-size: 0.75em;"}
```{r}
#| label: data_code_pie
#| eval: true
#| echo: true
movie_pie <- ggplot2movies::movies |>
  filter(mpaa != "" & mpaa != "NC-17") |>
  group_by(mpaa) |>
  summarise(cnt = n()) |>
  mutate(
    perc = round(cnt / sum(cnt), 3),
    mpaa = factor(mpaa,
          levels = c("PG", "PG-13", "R")))
glimpse(movie_pie)
```
:::
::::
## The grammar
:::: {.panel-tabset}
### Code
::: {style="font-size: 1.15em; color: #1e83c8;"}
**CODE:**
:::
::: {style="font-size: 0.85em;"}
Create labels with `labs()`
Initialize the graph with `ggplot()` and provide `data`
Assign `"perc"` to `x`
Assign `labs` to `label`
Assign `"in"` to `lab.pos`
Assign `"white"` to `lab.font` and `color`
Assign `"mpaa"` to `fill`
Remove legend with `theme(legend.position = "none")`
:::
::: {style="font-size: 0.75em;"}
```{r}
#| label: code_graph_pie
#| code-fold: show
#| eval: false
#| echo: true
#| warning: false
#| message: false
#| out-height: '100%'
#| out-width: '100%'
#| column: page-inset-right
#| layout-nrow: 1
labs <- paste0(movie_pie$mpaa, " (",
               (100*movie_pie$perc), "%)")
labs_pie <- labs(
  title = "Percent MPAA ratings for IMDB movies",
  x = "Percent MPAA rating")

ggp2_pie <- ggpubr::ggpie(movie_pie,
          x = "perc", label = labs,
          lab.pos = "in", lab.font = "#ffffff",
          fill = "mpaa", color = "#ffffff") +
    theme(legend.position = "none")

ggp2_pie +
  labs_pie
```
:::
### Graph
::: {style="font-size: 1.15em; color: #1e83c8;"}
**GRAPH:**
:::
```{r}
#| label: create_graph_pie
#| eval: true
#| echo: false
#| warning: false
#| message: false
#| out-height: '100%'
#| out-width: '100%'
#| column: page-inset-right
#| layout-nrow: 1
labs <- paste0(movie_pie$mpaa, " (",
(100*movie_pie$perc), "%)")
labs_pie <- labs(
title = "Percent MPAA ratings for IMDB movies",
x = "Percent MPAA rating")
ggp2_pie <- ggpubr::ggpie(movie_pie,
x = "perc", label = labs,
lab.pos = "in", lab.font = "#ffffff",
fill = "mpaa", color = "#ffffff") +
theme(legend.position = "none")
ggp2_pie +
labs_pie
```
::::


