Grouped bar graphs
Description
geom_col() allows us to display ‘grouped’ numerical values across levels (or groups) of a categorical variable. Grouped bar graphs assume the statistical measure (i.e., the value that the length of the bars will be derived from) is contained in a variable and mapped to the x or y aesthetic.
Getting set up
PACKAGES:
Install packages.
Code
install.packages("palmerpenguins")
library(palmerpenguins)
library(ggplot2)
DATA:

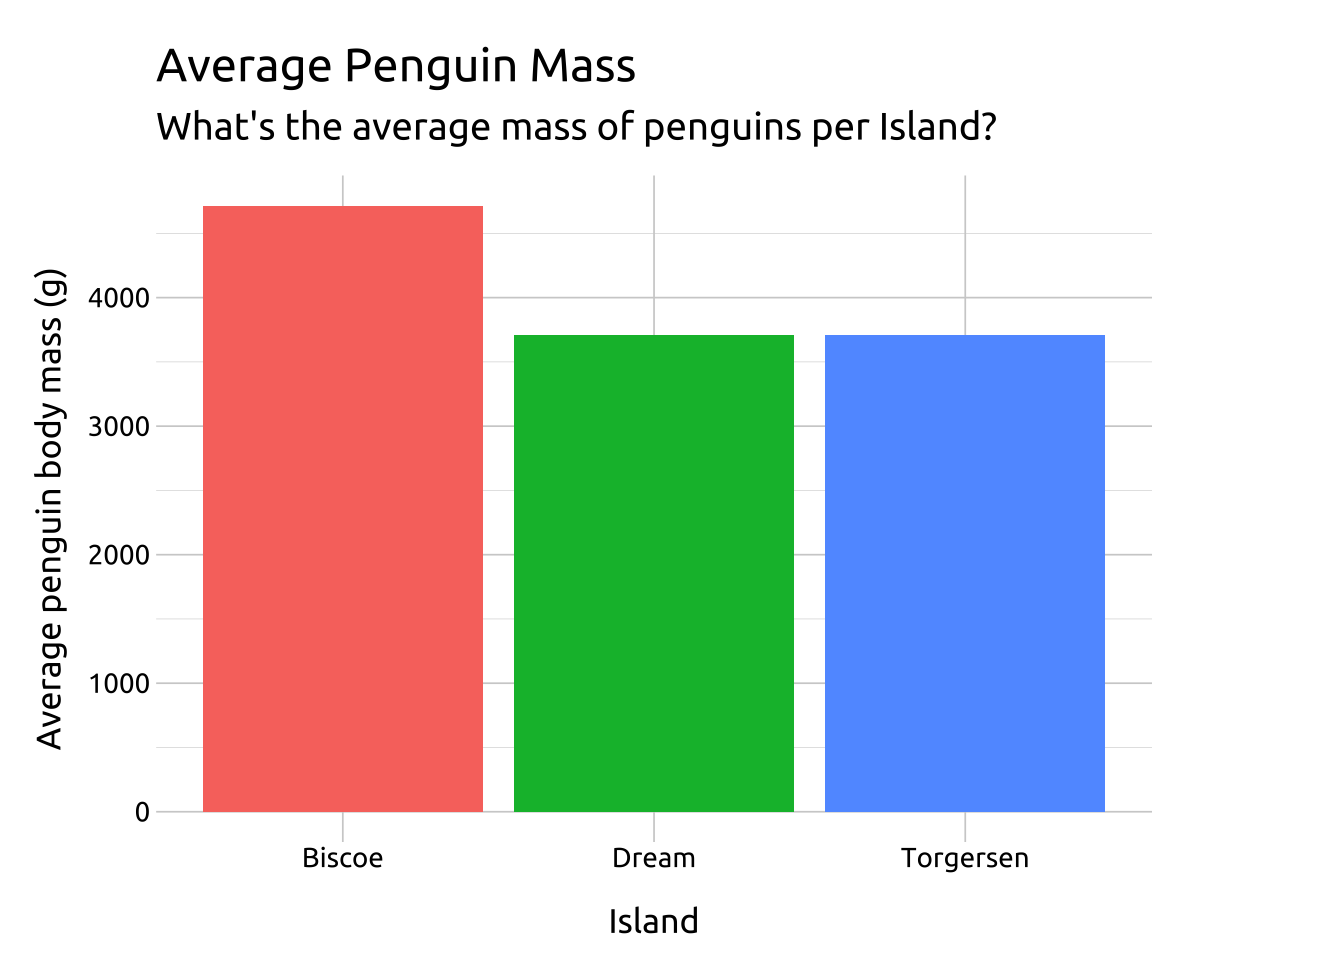
Remove the missing values and reduce the palmerpenguins::penguins dataset to only body_mass_g and island, then group the data by island and calculate the mean body_mass_g (as avg_body_mass_g).
Code
peng_grp_col <- palmerpenguins::penguins |>
    dplyr::select(body_mass_g, island) |>
    tidyr::drop_na() |>
    dplyr::group_by(island) |>
    dplyr::summarise(
        avg_body_mass_g = mean(body_mass_g)
        ) |>
    dplyr::ungroup()
glimpse(peng_grp_col)
Rows: 3
Columns: 2
$ island <fct> Biscoe, Dream, Torgersen
$ avg_body_mass_g <dbl> 4716.018, 3712.903, 3706.373The grammar
CODE:
Create labels with labs()
Initialize the graph with ggplot() and provide data
Map island to the x and avg_body_mass_g to the y
Map island to fill inside the aes() of geom_col()
Code
labs_grp_col <- labs(
    title = "Average Penguin Mass",
    subtitle = "What's the average mass of penguins per Island?",
    x = "Island",
    y = "Average penguin body mass (g)")
ggp2_grp_col <- ggplot(data = peng_grp_col,
              aes(x = island,
                  y = avg_body_mass_g)) +
        geom_col(aes(fill = island),
            show.legend = FALSE)
ggp2_grp_col +
    labs_grp_col
GRAPH: