Parallel sets
Description
Parallel sets (also referred to as Sankey diagrams or Alluvial charts) show the counts of categorical variables connected via a two-sided parallel display (or ‘sets’). Parallel sets can also be used to show different states of paired dependent relationships (such as input vs output), or time 1 vs time 2.
The height of the connecting bands between the categories on the x axis represent the relative counts for each discrete level (displayed on the y axis). The levels within each variable are represented with color.
We can build parallel set diagrams with the ggforce package.
Also check out alluvial charts.
Getting set up
PACKAGES:
Install packages.
Code
devtools::install_github("thomasp85/ggforce")
install.packages("palmerpenguins")
library(ggforce)
library(palmerpenguins)
library(ggplot2)
DATA:

We’re going to remove the missing values from palmerpenguins::penguins, count the categorical variables (island, sex, species), and rename the n column (produced by the count() function) to value.
ggforce has a special gather_set_data() function that changes tidy data into a tidy(er) format
Code
peng_wide <- palmerpenguins::penguins |>
  drop_na() |>
  count(island, species, sex) |>
  rename(value = n)
para_set_peng <- ggforce::gather_set_data(
                            data = peng_wide,
                            x = 1:3)
dplyr::glimpse(para_set_peng)
Rows: 30
Columns: 7
$ island <fct> Biscoe, Biscoe, Biscoe, Biscoe, Dream, Dream, Dream, Dream, To…
$ species <fct> Adelie, Adelie, Gentoo, Gentoo, Adelie, Adelie, Chinstrap, Chi…
$ sex <fct> female, male, female, male, female, male, female, male, female…
$ value <int> 22, 22, 58, 61, 27, 28, 34, 34, 24, 23, 22, 22, 58, 61, 27, 28…
$ id <int> 1, 2, 3, 4, 5, 6, 7, 8, 9, 10, 1, 2, 3, 4, 5, 6, 7, 8, 9, 10, …
$ x <int> 1, 1, 1, 1, 1, 1, 1, 1, 1, 1, 2, 2, 2, 2, 2, 2, 2, 2, 2, 2, 3,…
$ y <fct> Biscoe, Biscoe, Biscoe, Biscoe, Dream, Dream, Dream, Dream, To…The grammar
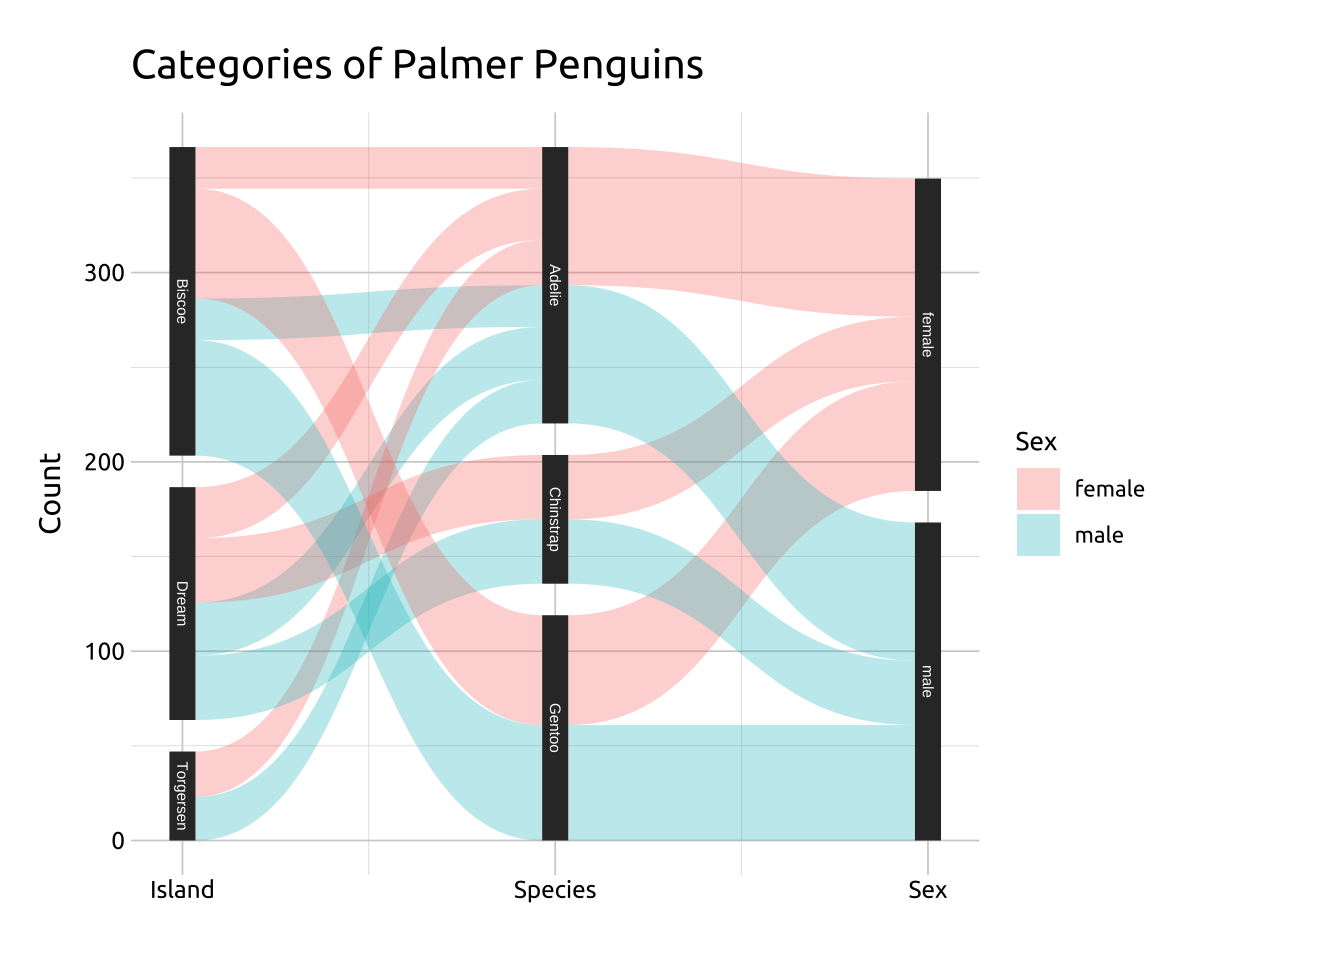
CODE:
Create labels with labs()
Initialize the graph with ggplot() and provide data
Map x to x, id to id, y to split, and value to value
In the geom_parallel_sets() function, map sex to fill and manually set the alpha (opacity) and the axis.width
In the geom_parallel_sets_axes() function, set the axis.width to the same value as the geom_parallel_sets() above
For labeling, adjust the size manually and set the color to something that stands out against the black vertical axes
Manually label the x axis with scale_x_continuous(), setting the breaks and labels to the variable names in the peng_wide dataset
Finally, remove the x title with axis.title.x = element_blank()
Code
labs_psets <- labs(
        title = "Categories of Palmer Penguins",
        y = "Count", fill = "Sex")

ggp2_psets <- ggplot(data = para_set_peng,
    mapping = aes(x = x,
        id = id,
        split = y,
        value = value)) +
  geom_parallel_sets(aes(fill = sex),
        alpha = 0.3,
        axis.width = 0.07)

ggp2_psets_axes <- ggp2_psets +
  geom_parallel_sets_axes(
        axis.width = 0.07)

ggp2_psets_labs <- ggp2_psets_axes +
  geom_parallel_sets_labels(
        size = 2.0,
        color = '#ffffff') +
  scale_x_continuous(
        breaks = c(1, 2, 3),
        labels = c("Island", "Species", "Sex")) +
  theme(axis.title.x = element_blank())

ggp2_psets_labs +
    labs_psets
GRAPH:
More info
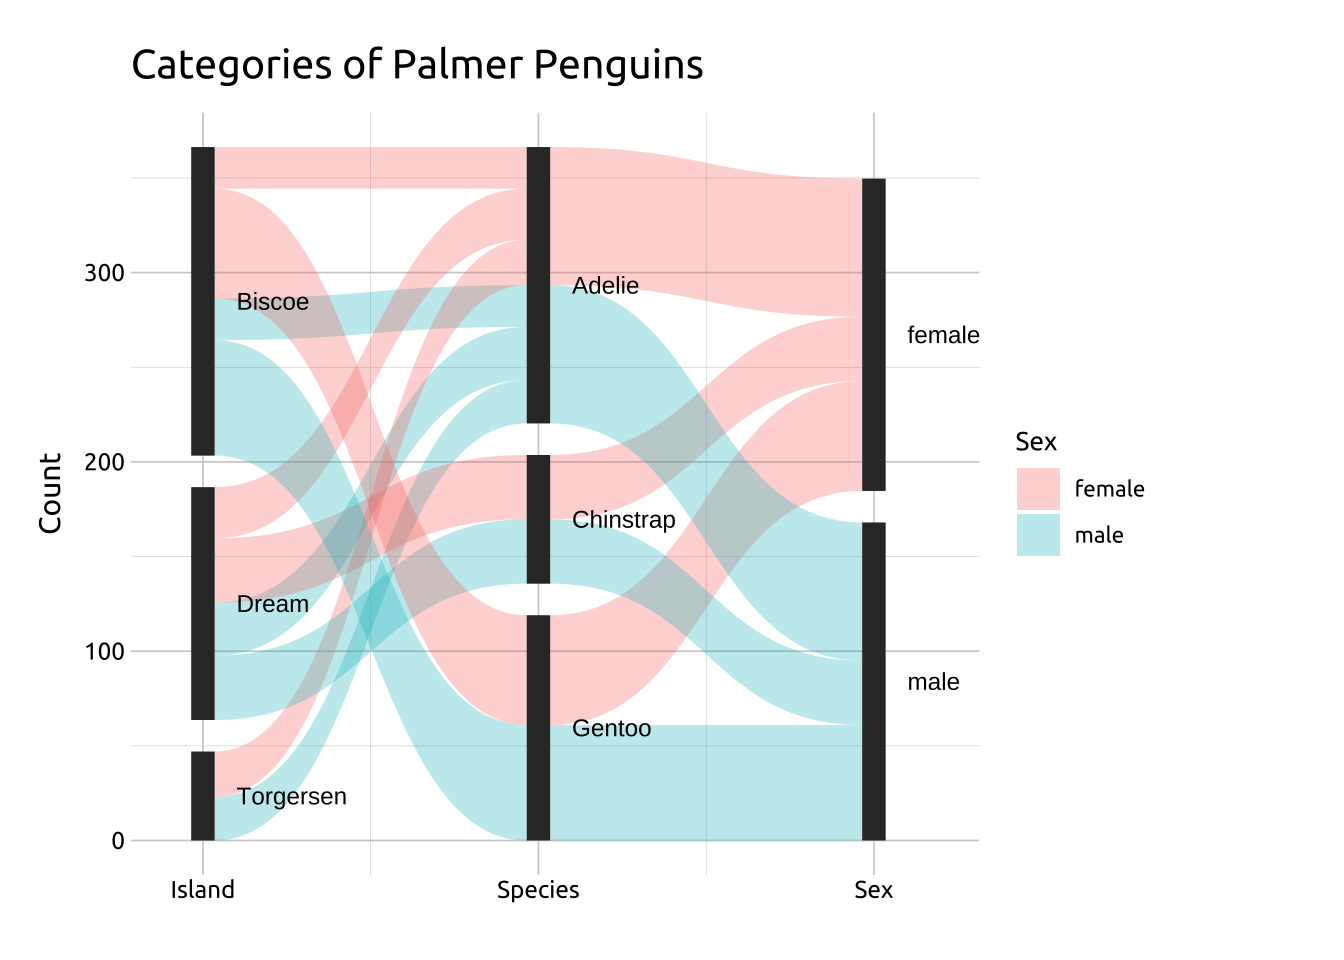
If the categories have long names, you can move the location of the labels outside the set.
LABELS:
If the categories have long names, use the angle, nudge_x/nudge_y and hjust/vjust in geom_parallel_sets_labels() to adjust the size, location, and color of the labels.
Manually setting the limits of the x axis in scale_x_continuous() will also give more room for the labels.
Code
ggp2_psets_axes +
  geom_parallel_sets_labels(
      size = 3.2,
      colour = '#000000',
      angle = 0,
      nudge_x = 0.1,
      hjust = 0) +
  scale_x_continuous(
        limits = c(0.9, 3.2),
        breaks = c(1, 2, 3),
        labels = c("Island", "Species", "Sex")) +
  theme(axis.title.x = element_blank()) +
    labs_psets