geom_step()
( in development )
Lines in
ggplot2
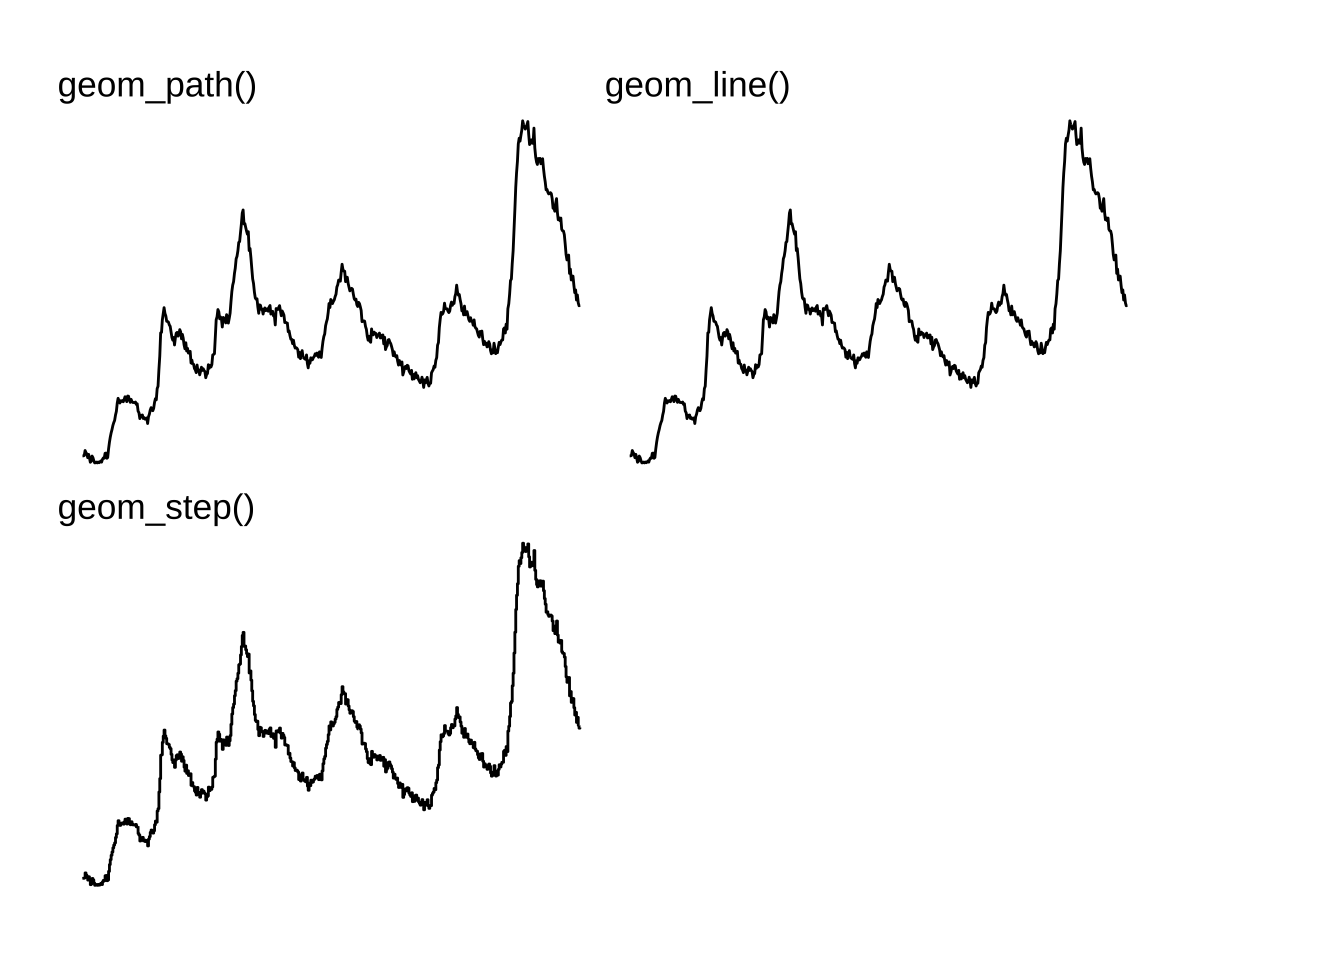
geom_path()geom_line()geom_step()

PACKAGES:
Install packages.
Code
install.packages("ggplot2")
library(ggplot2)
DATA:
Load the ggplot2::economics data.
Code
economics <- ggplot2::economics
dplyr::glimpse(economics)
Rows: 574
Columns: 6
$ date <date> 1967-07-01, 1967-08-01, 1967-09-01, 1967-10-01, 1967-11-01, …
$ pce <dbl> 506.7, 509.8, 515.6, 512.2, 517.4, 525.1, 530.9, 533.6, 544.3…
$ pop <dbl> 198712, 198911, 199113, 199311, 199498, 199657, 199808, 19992…
$ psavert <dbl> 12.6, 12.6, 11.9, 12.9, 12.8, 11.8, 11.7, 12.3, 11.7, 12.3, 1…
$ uempmed <dbl> 4.5, 4.7, 4.6, 4.9, 4.7, 4.8, 5.1, 4.5, 4.1, 4.6, 4.4, 4.4, 4…
$ unemploy <dbl> 2944, 2945, 2958, 3143, 3066, 3018, 2878, 3001, 2877, 2709, 2…geom_step()
BASICS:
Code
ggp2_step_base <- ggplot(data = economics)
ggp2_step_base +
    geom_step(mapping = aes(x = date, y = unemploy))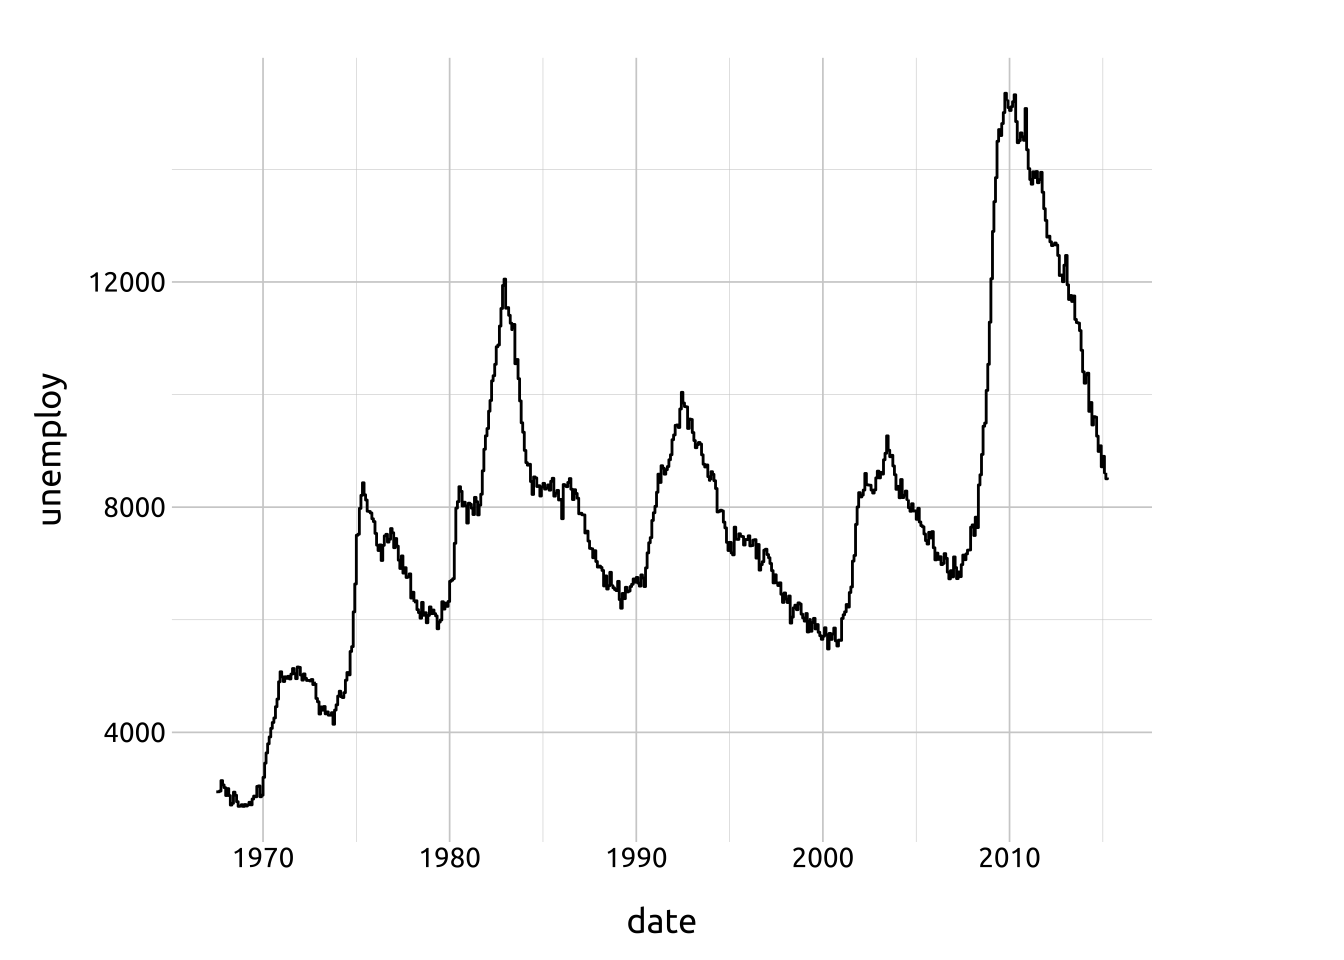
AESTHETICS:
The required aesthetics are:
Optional aesthetics include:
ARGUMENTS: