37 Bubble charts
37.1 Description
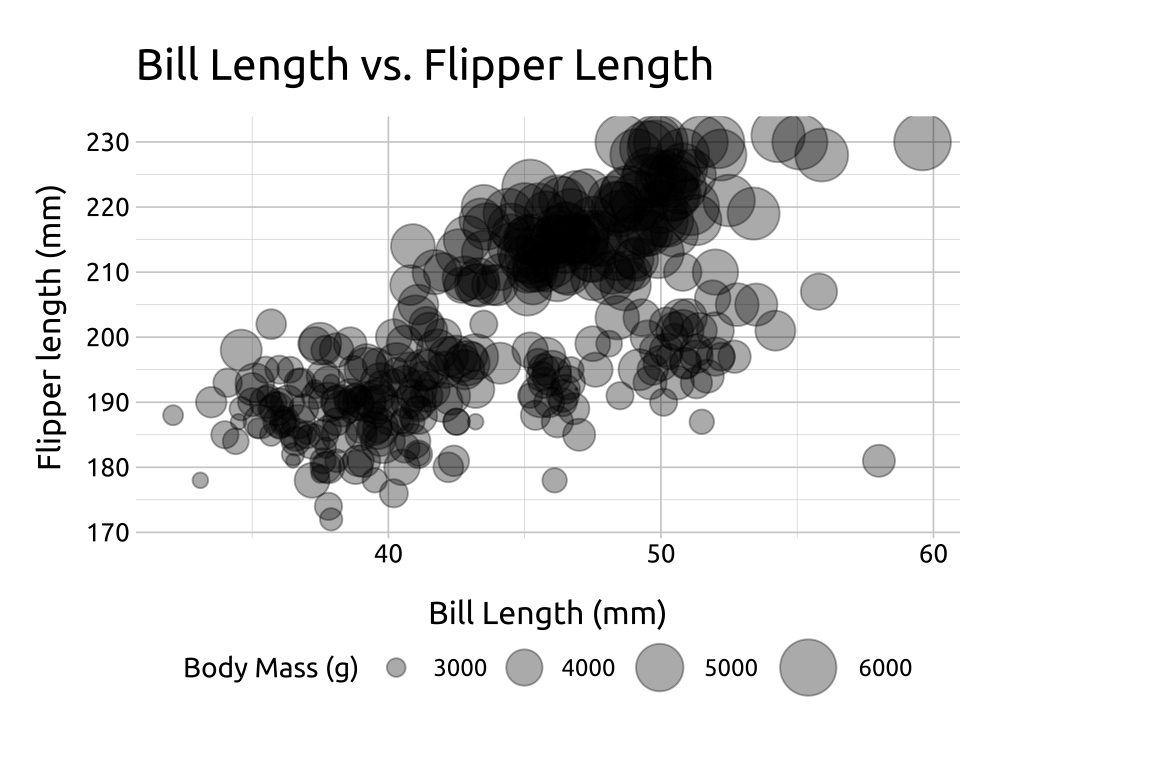
Bubble graphs display relationships between three numeric (continuous) variables.
The position on the x and y axis illustrates the relationship between the first two variables, and the size of the point (i.e., the bubble) conveys the numeric value of the third.
37.2 Set up
PACKAGES:
Install packages.
show/hide
install.packages("palmerpenguins")
library(palmerpenguins)
library(ggplot2)
DATA:

The penguins data.
show/hide
penguins <- palmerpenguins::penguins
glimpse(penguins)
#> Rows: 344
#> Columns: 8
#> $ species           <fct> Adelie, Adelie, Adelie…
#> $ island            <fct> Torgersen, Torgersen, …
#> $ bill_length_mm    <dbl> 39.1, 39.5, 40.3, NA, …
#> $ bill_depth_mm     <dbl> 18.7, 17.4, 18.0, NA, …
#> $ flipper_length_mm <int> 181, 186, 195, NA, 193…
#> $ body_mass_g       <int> 3750, 3800, 3250, NA, …
#> $ sex               <fct> male, female, female, …
#> $ year              <int> 2007, 2007, 2007, 2007…
37.3 Grammar
CODE:
Create labels with
labs()Map
bill_length_mmtoxaxisMap
flipper_length_mmtoyaxisMap
body_mass_gtosizeSet
alphato1/3Add
scale_size(), set therangetoc(0.1, 10)andnameto"Body Mass (g)"Move the legend to the bottom of the graph with
theme(legend.position = "bottom")
show/hide
labs_bubble <- labs(
  title = "Bill Length vs. Flipper Length",
  x = "Bill Length (mm)", y = "Flipper length (mm)",
  size = "Body Mass (g)")

ggp2_bubble <- penguins |>
  ggplot(
    aes(x = bill_length_mm, y = flipper_length_mm)) +
  geom_point(aes(size = body_mass_g), alpha = 1/3) +
  scale_size(range = c(.1, 10),
             name = "Body Mass (g)") +
  theme(legend.position = "bottom")

ggp2_bubble +
  labs_bubble
GRAPH:
