
8 Grouped bar graphs
8.1 Description
Grouped bar graphs compare multiple values across categories. Each category has a cluster of bars. X-axis labels show categories and y-axis values. Colors or patterns differentiate subsets, and a legend is shown on the side or top of the graph.
geom_col() allows us to display ‘grouped’ numerical values across levels (or groups) of a categorical variable.
8.2 Set up
PACKAGES:
Install packages.
show/hide
install.packages("palmerpenguins")
library(palmerpenguins)
library(ggplot2)
DATA:

Remove the missing values and reduce the palmerpenguins::penguins dataset to only body_mass_g and island, then group the data by island and calculate the sum of body_mass_g (as sum_body_mass_g).
show/hide
peng_grp_col <- palmerpenguins::penguins |>
    dplyr::select(body_mass_g, island) |>
    tidyr::drop_na() |>
    dplyr::group_by(island) |>
    dplyr::summarise(
        sum_body_mass_g = sum(body_mass_g)
        ) |>
    dplyr::ungroup()
glimpse(peng_grp_col)
#> Rows: 3
#> Columns: 2
#> $ island          <fct> Biscoe, Dream, Torgersen
#> $ sum_body_mass_g <int> 787575, 460400, 189025
8.3 Grammar
CODE:
Grouped bar graphs assume the statistical measure (i.e., the value that the length of the bars will be derived from) is contained in a variable and mapped to the x or y aesthetic.
Create labels with
labs()Initialize the graph with
ggplot()and providedataMap
islandto thexandsum_body_mass_gto theyMap
islandtofillinside theaes()ofgeom_col()
show/hide
labs_grp_col <- labs(
    title = "Total Penguin Mass",
    subtitle = "What's the total mass of penguins per Island?",
    x = "Island",
    y = "Total penguin body mass (g)")
ggp2_grp_col <- ggplot(data = peng_grp_col,
              aes(x = island,
                  y = sum_body_mass_g)) +
        geom_col(aes(fill = island),
            show.legend = FALSE)
ggp2_grp_col +
    labs_grp_col
GRAPH:

8.4 More info
We didn’t have to calculate sum_body_mass_g (displayed on the y axis) by island because ggplot2 does this for us!
If we pass a categorical variable to the x (like island) and a continuous variable to y (like body_mass_kg), geom_col() will calculate the sum() of y by levels of x:
show/hide
  penguins |>
  dplyr::select(body_mass_g, island) |>
  tidyr::drop_na() |>
  ggplot(aes(x = island, y = body_mass_g)) +
        geom_col(aes(fill = island),
            show.legend = FALSE) +
  labs_grp_col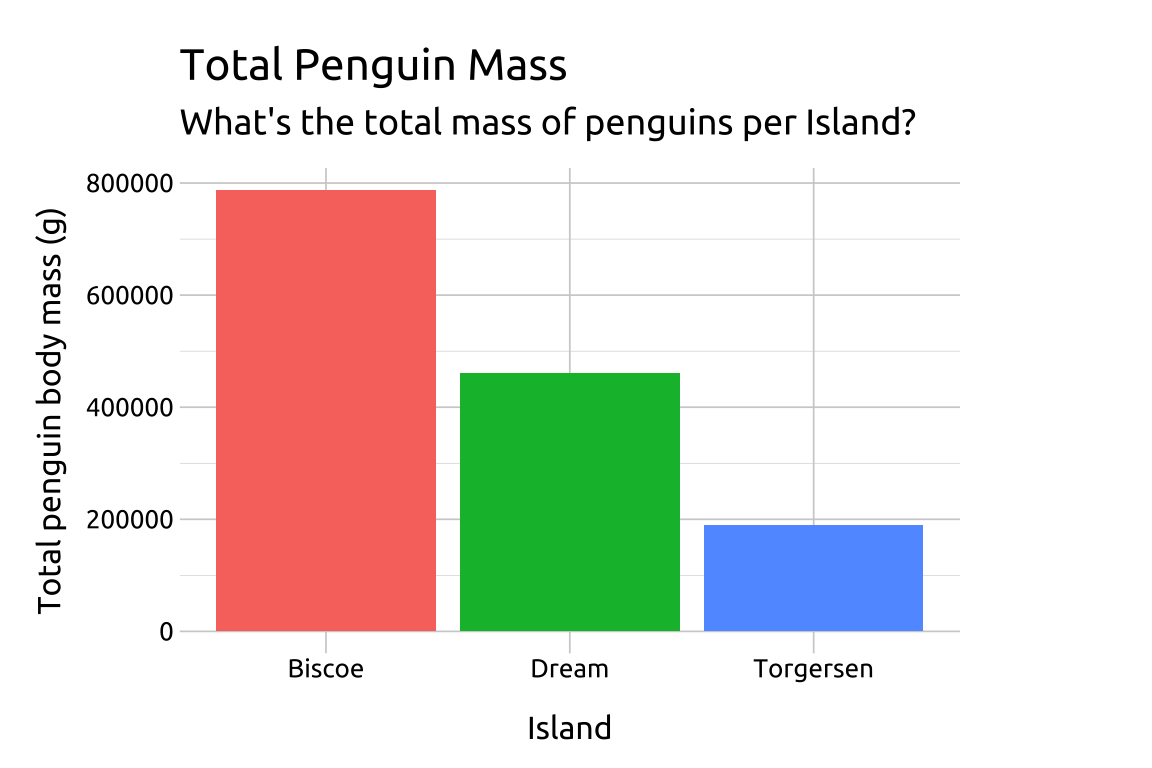
We can see the underlying totaling of body_mass_g using dplyr’s group_by() and summarise() functions.
show/hide
palmerpenguins::penguins |>
    dplyr::select(body_mass_g, island) |>
    tidyr::drop_na() |>
    dplyr::group_by(island) |>
    dplyr::summarise(
        `Total Penguin Body Mass (kg)` = sum(body_mass_g)
        ) |>
    dplyr::ungroup() |>
    dplyr::select(`Island` = island,
`Total Penguin Body Mass (kg)`)| Island | Total Penguin Body Mass (kg) |
|---|---|
| Biscoe | 787575 |
| Dream | 460400 |
| Torgersen | 189025 |