25 Grouped box plots
25.1 Description
Grouped box plots display five different statistical measures across a series of categories, or groups, of a discrete, ordinal, or interval variable.
The five statistical measures are 1) the first quartile, 2) the second quartile, and 3) the third quartile. The fourth and fifth values are the largest/smallest values no further than 1.5 X inter-quartile range from the hinges.
25.2 Set up
PACKAGES:
Install packages.
show/hide
install.packages("palmerpenguins")
library(palmerpenguins)
library(ggplot2)
DATA:

Remove the missing island values from the penguins data.
show/hide
peng_box <- filter(penguins, !is.na(island))
glimpse(peng_box)
#> Rows: 344
#> Columns: 8
#> $ species           <fct> Adelie, Adelie, Adelie…
#> $ island            <fct> Torgersen, Torgersen, …
#> $ bill_length_mm    <dbl> 39.1, 39.5, 40.3, NA, …
#> $ bill_depth_mm     <dbl> 18.7, 17.4, 18.0, NA, …
#> $ flipper_length_mm <int> 181, 186, 195, NA, 193…
#> $ body_mass_g       <int> 3750, 3800, 3250, NA, …
#> $ sex               <fct> male, female, female, …
#> $ year              <int> 2007, 2007, 2007, 2007…
25.3 Grammar
CODE:
Create labels with
labs()Initialize the graph with
ggplot()and providedataMap
islandto thexaxis and tofillMap
bill_length_mmto theyaxisAdd
geom_boxplot()and set thealphato2/3Remove the legend with
show.legend = FALSE
show/hide
labs_grp_boxplots <- labs(
title = "Adult foraging penguins",
subtitle = "Palmer Archipelago, Antarctica",
x = "Island", fill = "Island",
y = "Bill length (millimeters)")
ggp2_grp_boxplots <- ggplot(data = peng_box,
aes(x = island,
y = bill_length_mm,
fill = island)) +
geom_boxplot(alpha = 2/3,
show.legend = FALSE)
ggp2_grp_boxplots +
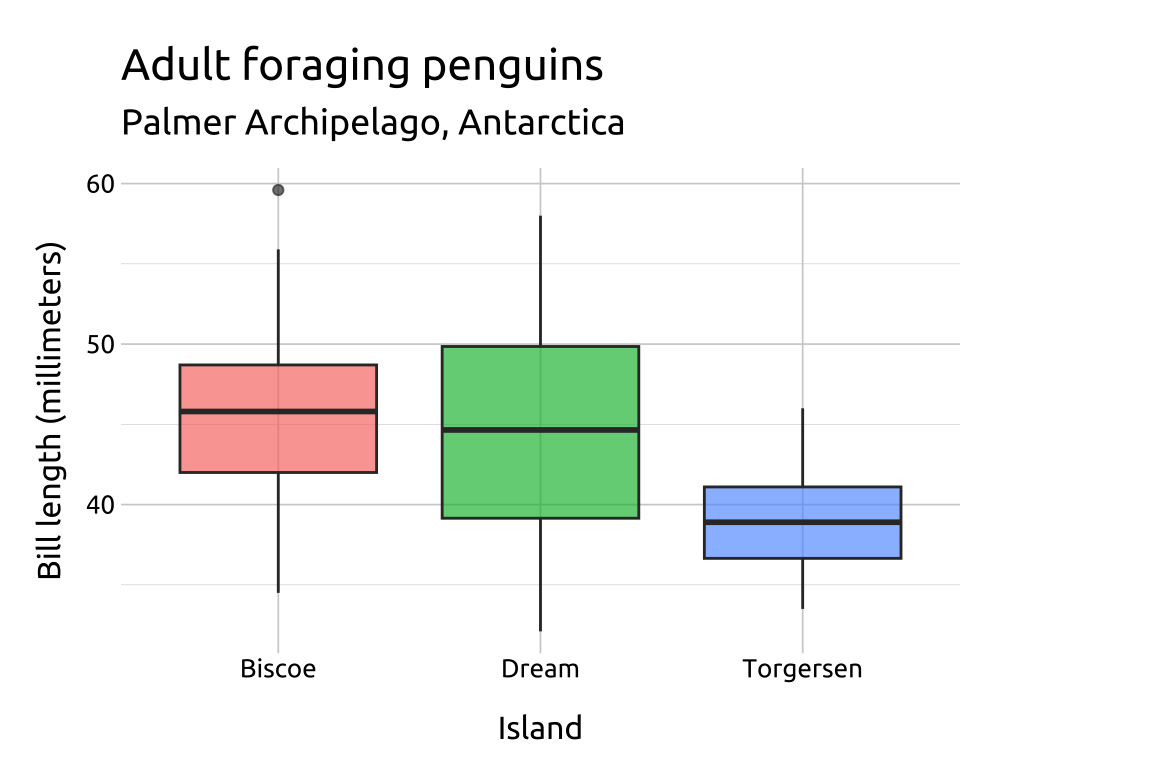
labs_grp_boxplotsGRAPH:
When a categorical variable is supplied, the plot will contain a box for each level or group.

25.4 More info
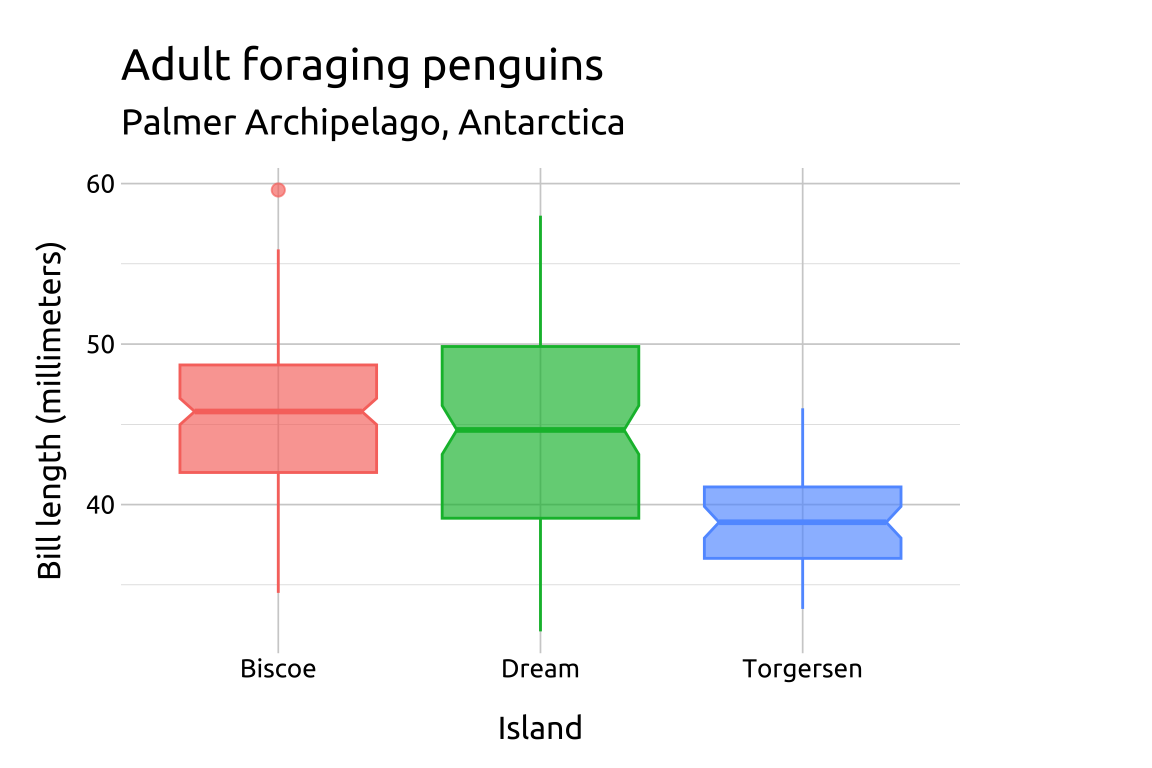
25.4.1 Notches
Add notches to the box plot using the notch = TRUE and notchwidth arguments.
show/hide
ggp2_grp_box_notch <- ggplot(data = peng_box,
       aes(x = island,
           y = bill_length_mm,
        fill = island)) +
  geom_boxplot(
      notch = TRUE,
      notchwidth = 0.85,
      alpha = 2/3,
      show.legend = FALSE)
ggp2_grp_box_notch +
    labs_grp_boxplots
25.4.2 Outliers
Box plots display outliers using points, and we can change the color these using the outlier.colour argument. Inside the geom_boxplot(), we map island to color and set outlier.colour to NULL:
show/hide
ggp2_grp_box_outliers <- ggplot(data = peng_box,
       aes(x = island,
           y = bill_length_mm,
           fill = island)) +
  geom_boxplot(aes(color = island),
      outlier.colour = NULL,
      outlier.size = 2,
      notch = TRUE,
      notchwidth = 0.85,
      alpha = 2/3,
      show.legend = FALSE)
ggp2_grp_box_outliers +
    labs_grp_boxplots