PROPORTIONS
Proportions: These graphs display grouped counts, percentages, or part-to-whole relationships of values within variables (or between variables).
Diverging bar graphs
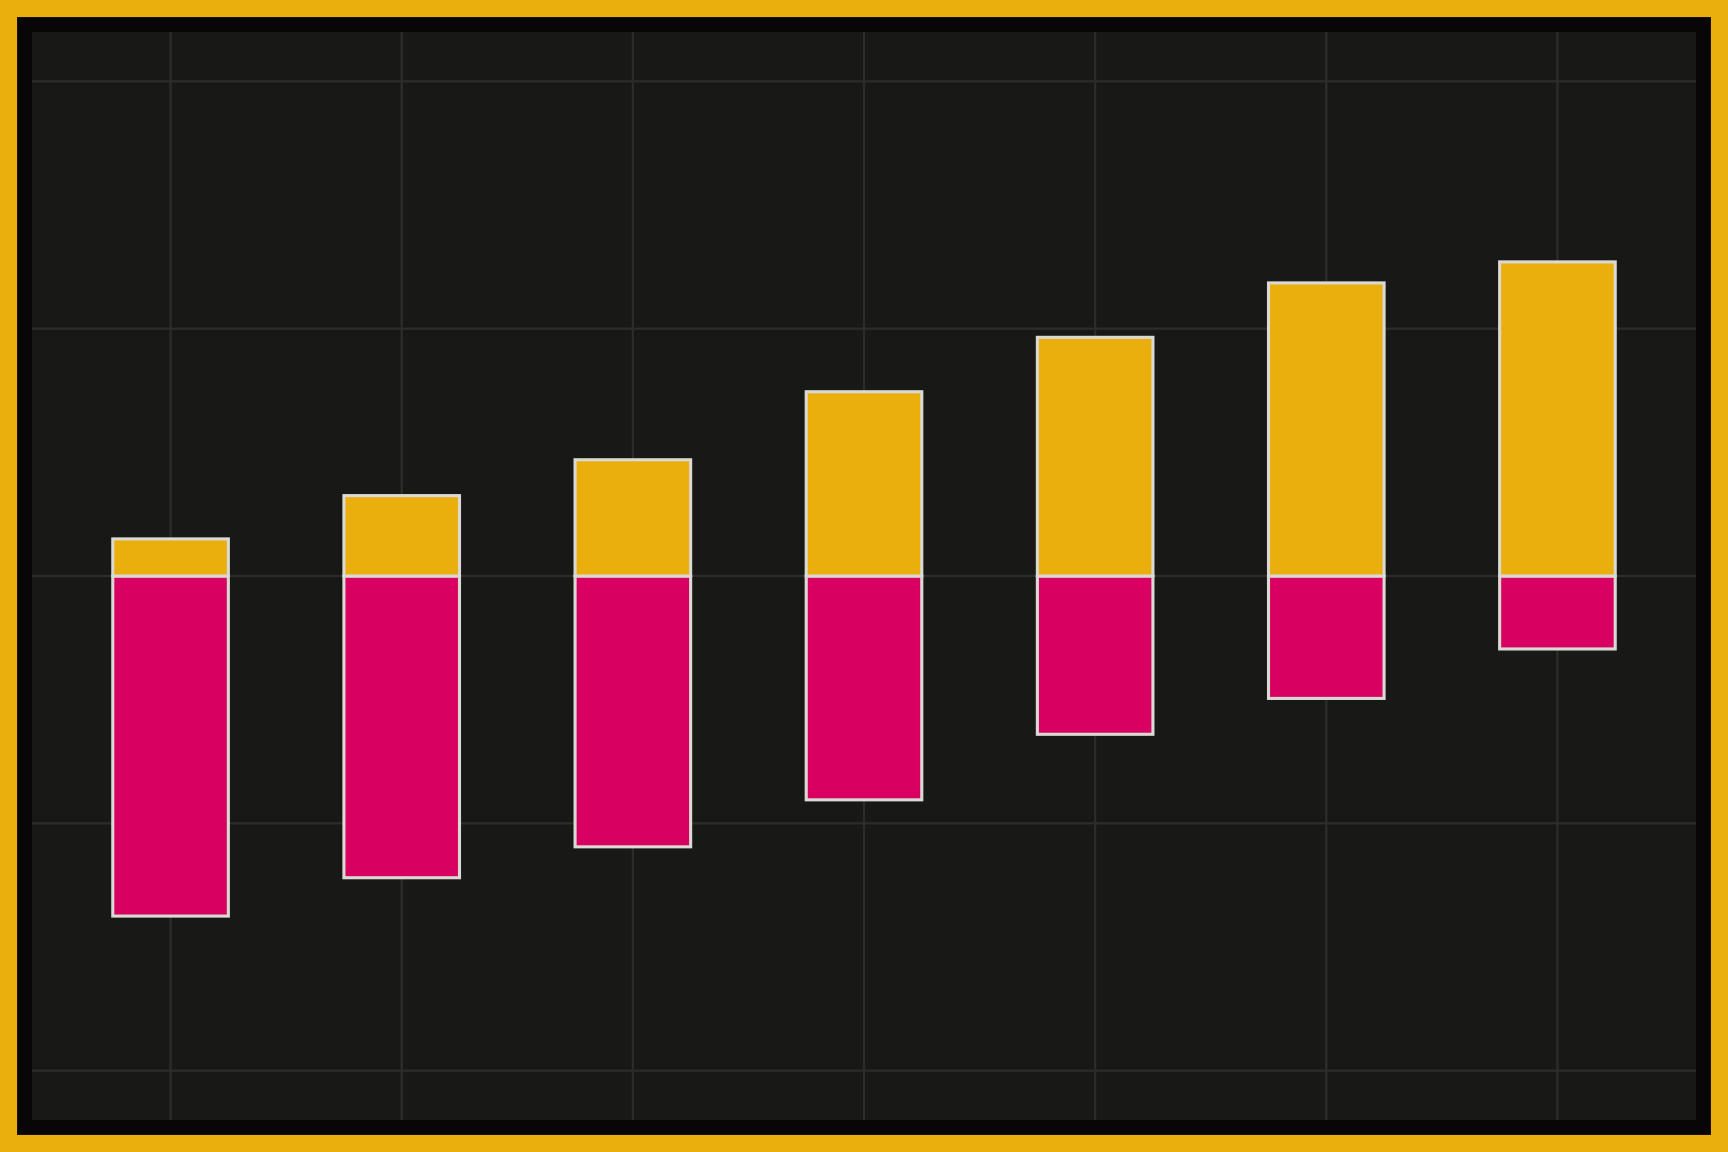
A diverging bar graph shows values that split in two directions from a center line, usually zero. Bars on one side represent one group or response (agree, positive, more), and bars on the other side represent the opposite. Diverging bars are common for survey responses on a scale, because they make it easy to see which way the balance tips for each category. Color separates the two sides.
Stacked and filled density plots
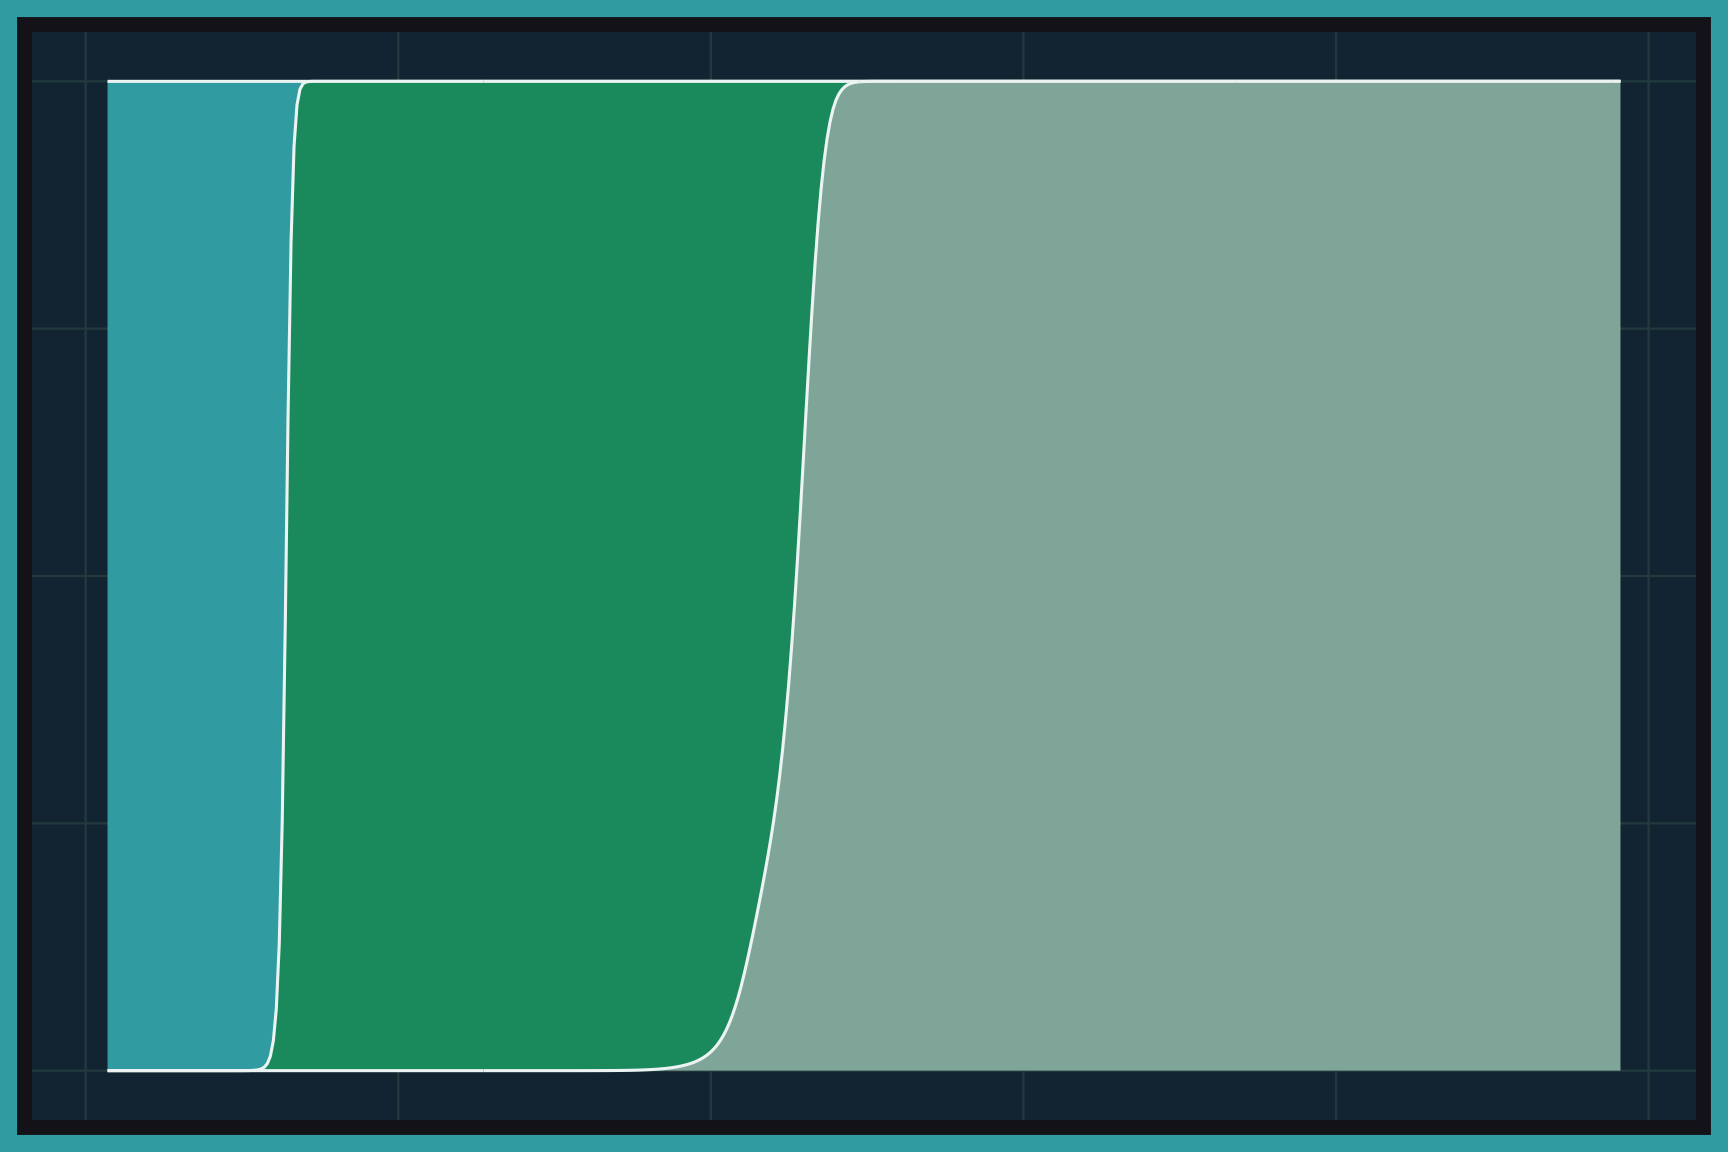
Stacked and filled density plots show how the share of each group changes across the range of a numeric variable. Each group gets its own smooth density curve, and the curves are stacked on top of each other. In a filled density plot, the stack is stretched so it always adds up to 100%, which shows each group’s proportion at every value on the x axis. Color separates the groups.
Mosaic plots
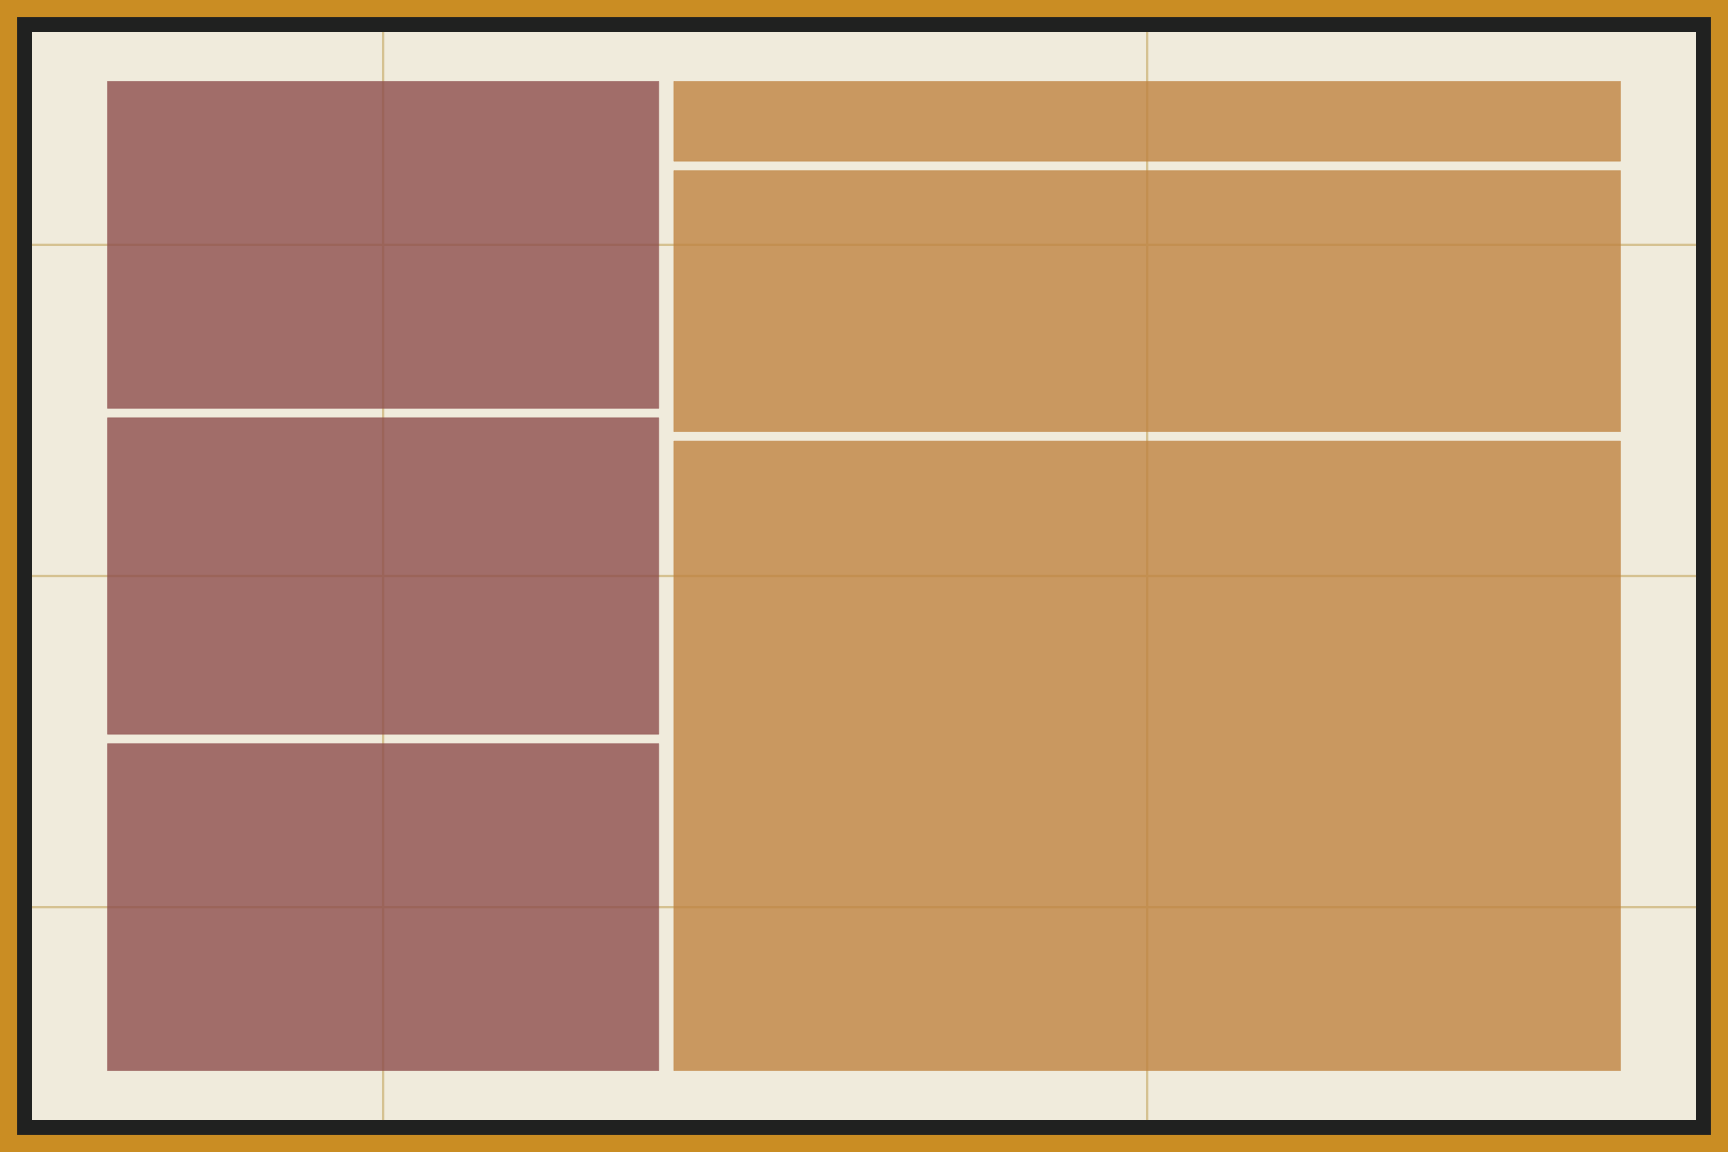
A mosaic plot displays the counts of two or more categorical variables as a set of rectangles. The width of each column shows the share of the first variable, and the heights of the tiles inside each column show the share of the second variable within it. Because area represents the count, mosaic plots make it easy to see when two categorical variables are related. Color separates the levels of one variable.
Pie charts
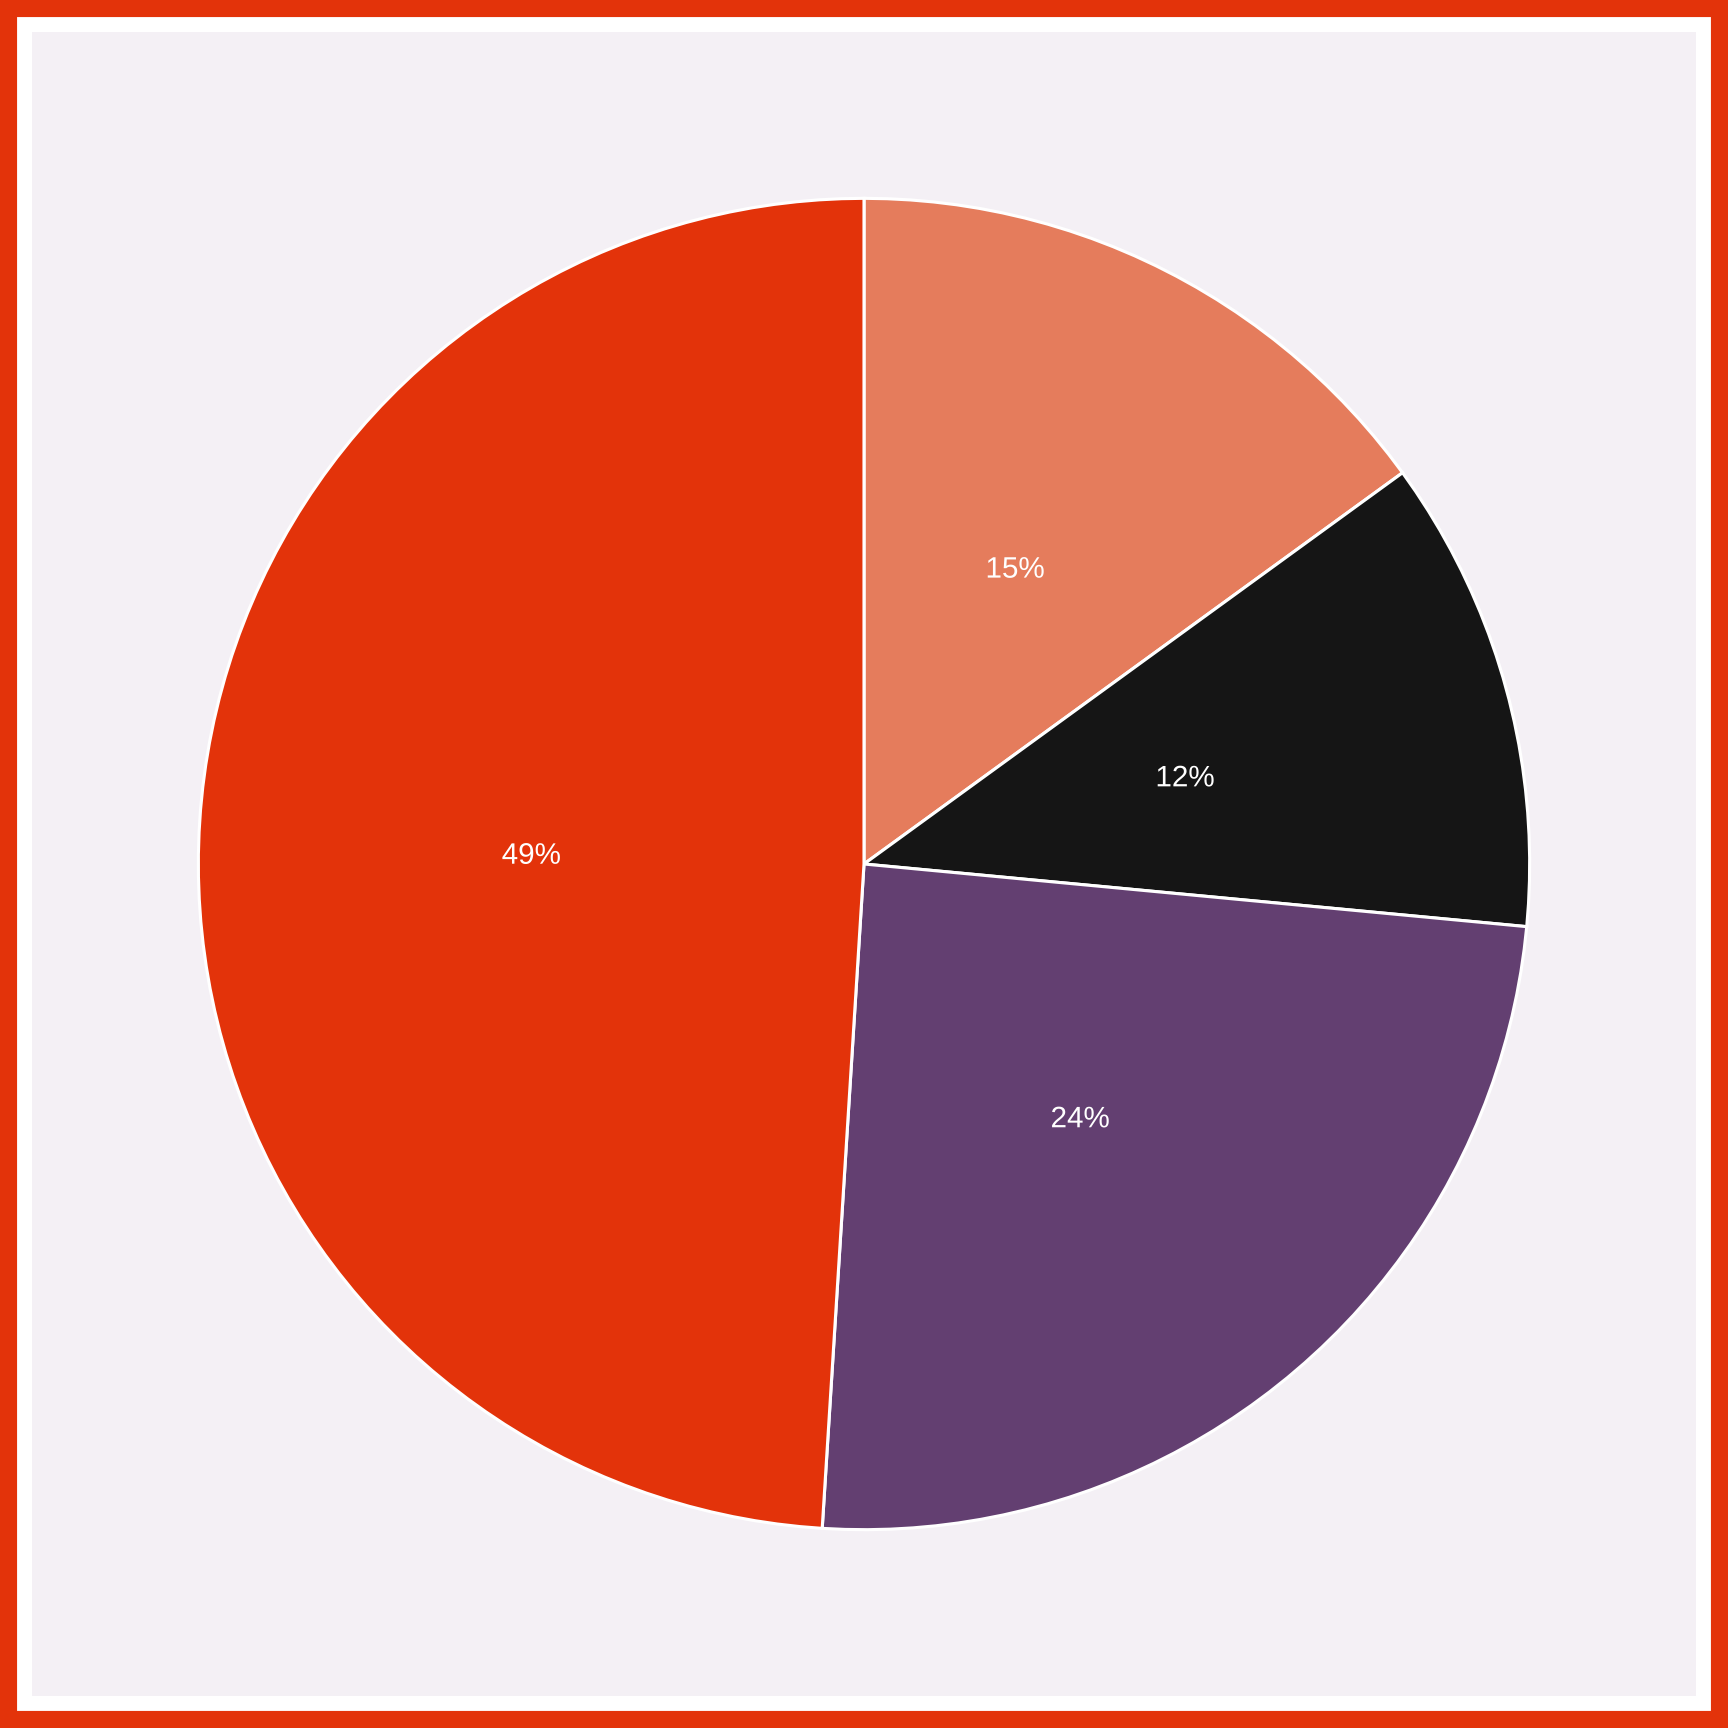
A pie chart divides a circle into slices, and each slice shows one category’s share of the whole. The angle (and area) of each slice is proportional to the category’s count or percentage. Pie charts work best with a few categories and simple fractions, such as one half or one quarter. Labels on the slices give each category’s percentage.
Treemaps
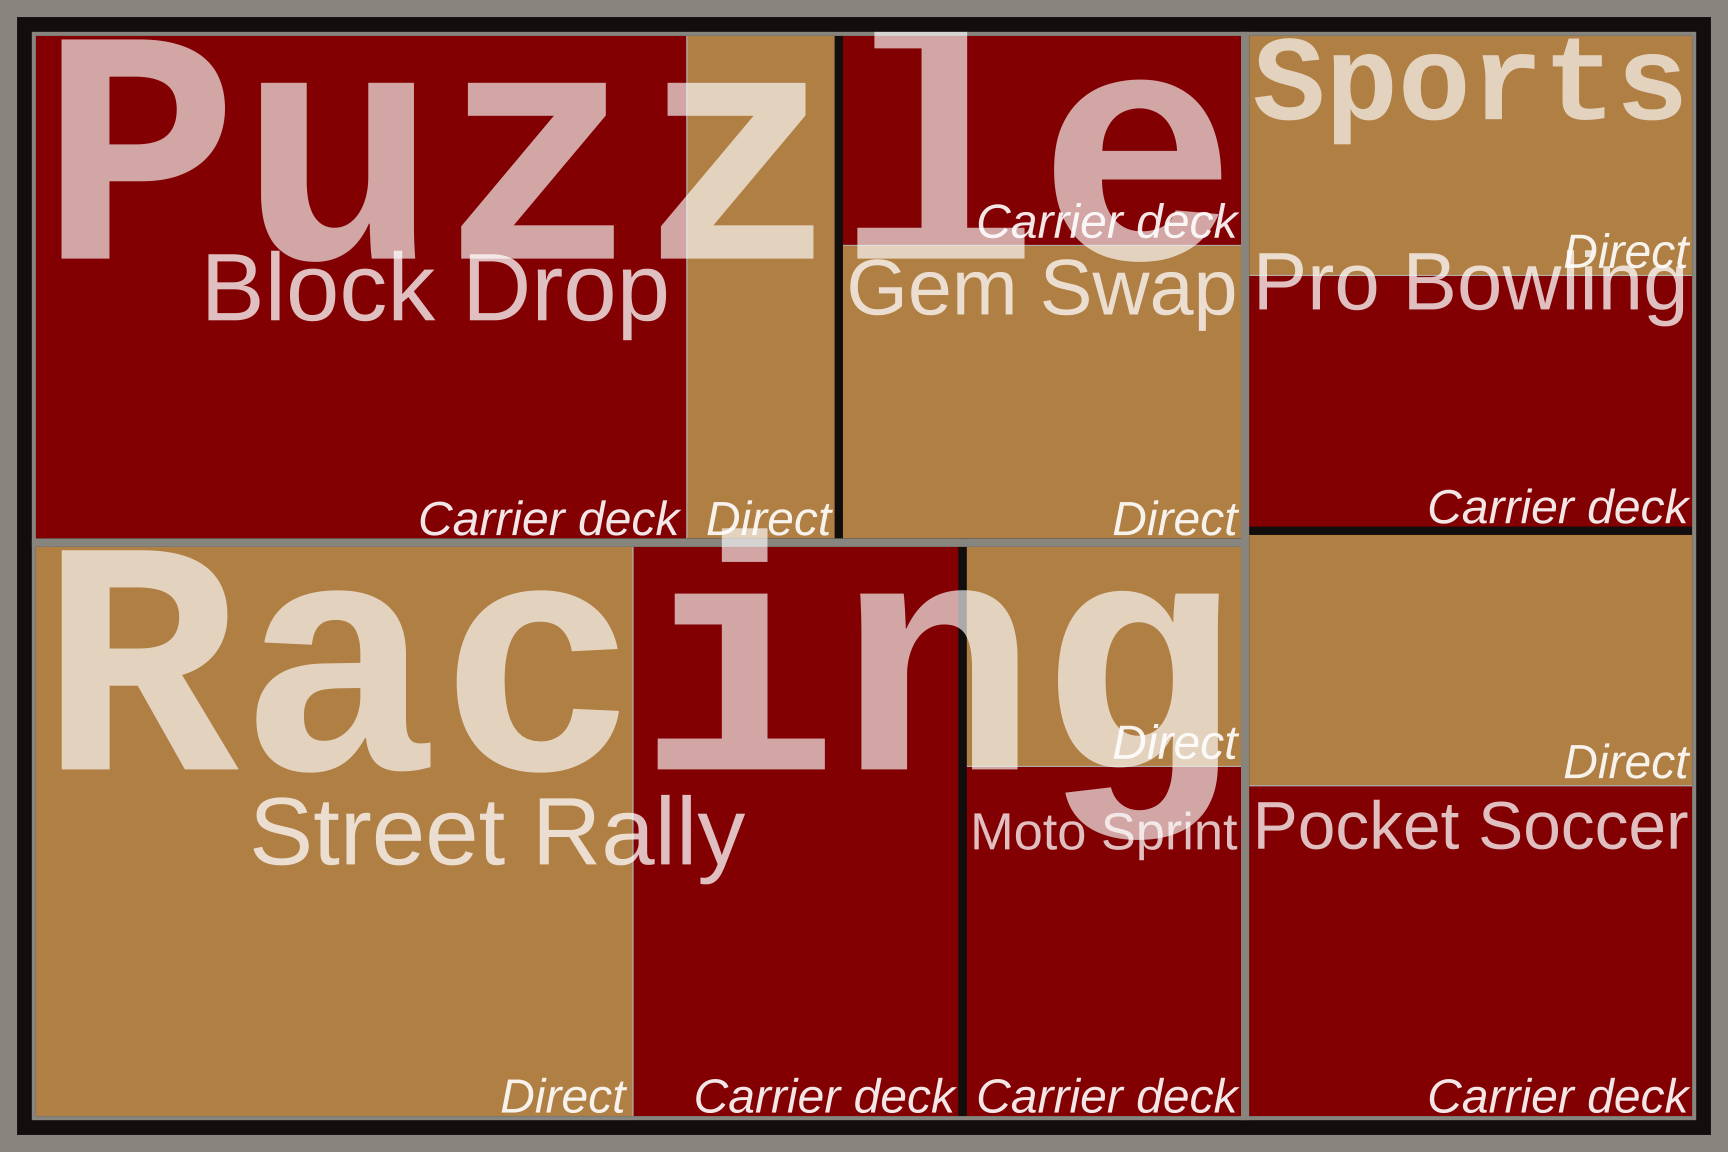
A treemap displays a whole as a rectangle divided into smaller rectangles, one for each category. The area of each rectangle is proportional to its value, and categories can be nested inside larger groups. Treemaps are handy when there are too many categories for a pie chart, or when the data have a hierarchy. Here color shows the innermost level (channel), and labels inside the rectangles name each category.