38 Grouped bubble graph
38.1 Description
Grouped bubble graphs use position, color, and size to display the relationships between four variables (three numerical/quantitative, one categorical).
The position on the x and y axis captures the relationship between two numerical variables. The size and color of the points display a third numerical variable across the levels of a (fourth) categorical variable.
38.2 Set up
PACKAGES:
Install packages.
show/hide
install.packages("palmerpenguins")
library(palmerpenguins)
library(ggplot2)
DATA:

The penguins data.
show/hide
penguins <- palmerpenguins::penguins
glimpse(penguins)
#> Rows: 344
#> Columns: 8
#> $ species           <fct> Adelie, Adelie, Adelie…
#> $ island            <fct> Torgersen, Torgersen, …
#> $ bill_length_mm    <dbl> 39.1, 39.5, 40.3, NA, …
#> $ bill_depth_mm     <dbl> 18.7, 17.4, 18.0, NA, …
#> $ flipper_length_mm <int> 181, 186, 195, NA, 193…
#> $ body_mass_g       <int> 3750, 3800, 3250, NA, …
#> $ sex               <fct> male, female, female, …
#> $ year              <int> 2007, 2007, 2007, 2007…
38.3 Grammar
CODE:
Create labels with
labs()Initialize the graph with
ggplot()and providedataMap
bill_length_mmto thexaxis andflipper_length_mmto theyaxisInside
geom_point()map
body_mass_gtosizeandspeciestofillset the
alphato2/3
In the
scale_size()- set
rangetoc(.04, 6)
- set
show/hide
labs_grp_bubble <- labs(
title = "Bill Length vs. Flipper Length",
x = "Bill Length (mm)",
y = "Flipper length (mm)",
size = "Body Mass",
fill = "Species")
ggp2_grp_bubble <- penguins |>
ggplot(aes(
x = bill_length_mm, y = flipper_length_mm)) +
geom_point(
aes(size = body_mass_g,
color = species),
alpha = 2/3) +
scale_size(range = c(.04, 6))
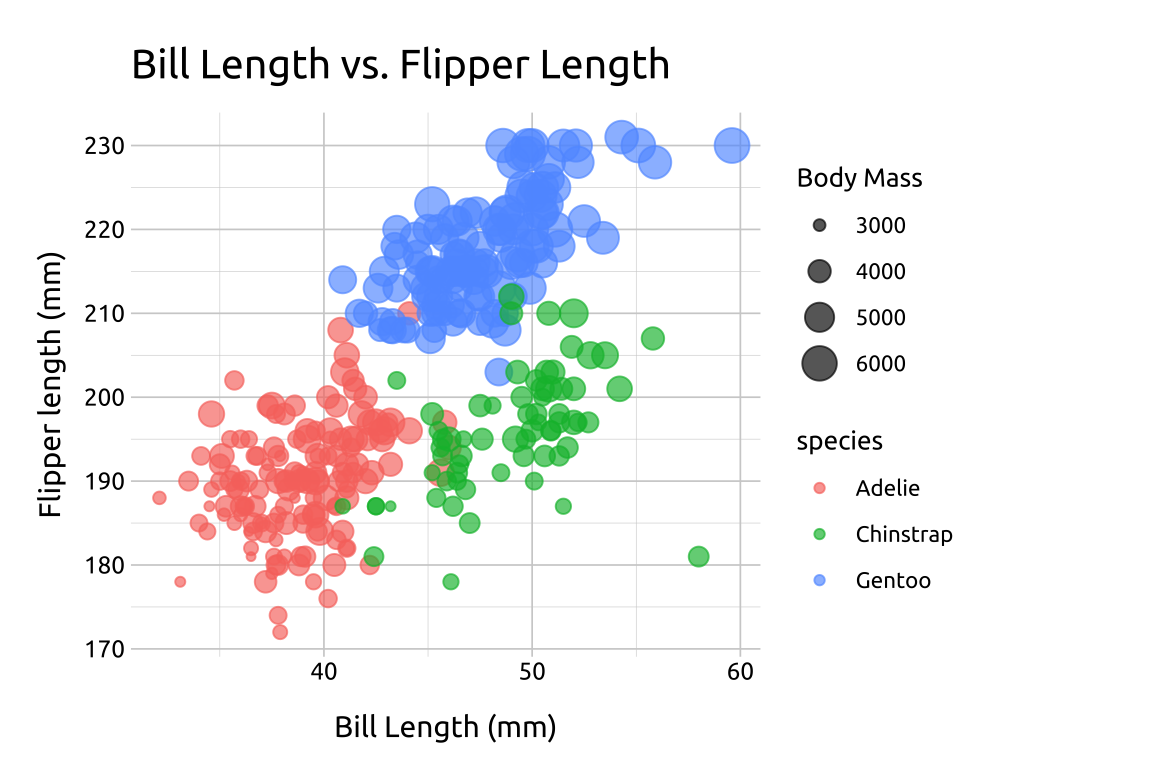
ggp2_grp_bubble +
labs_grp_bubbleGRAPH:
38.4 More info
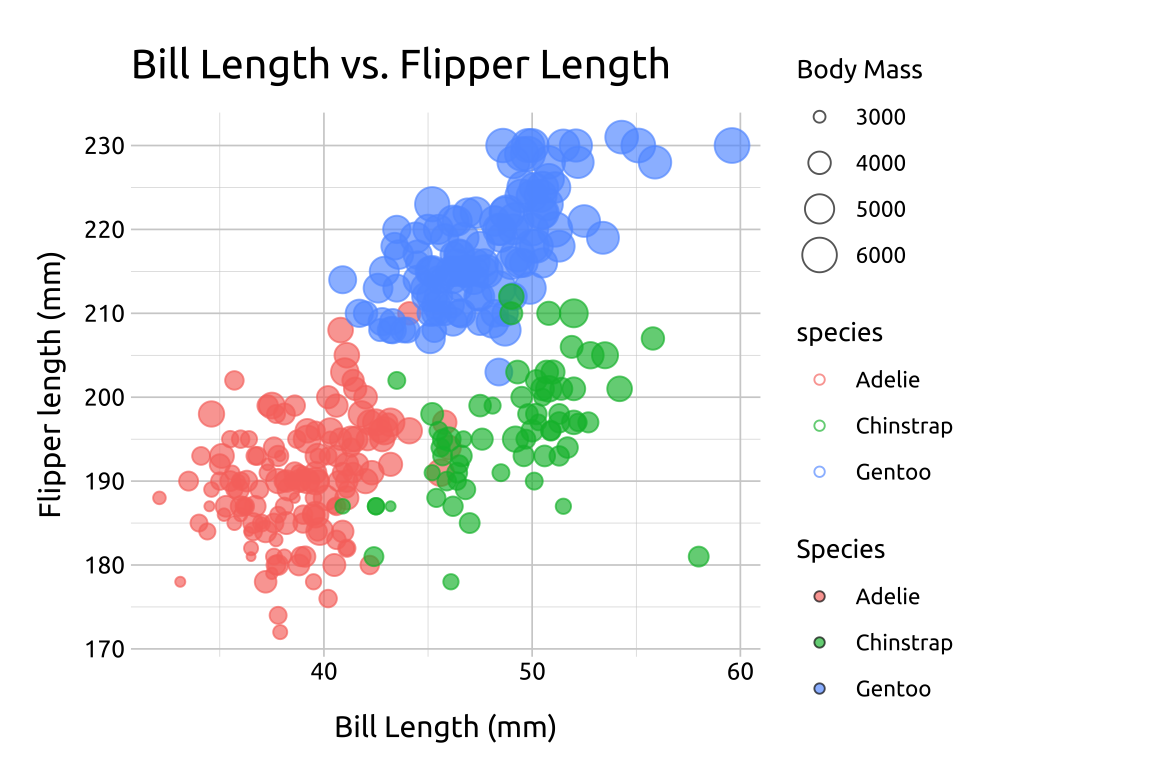
We can change the shape of the points for more control of the color and fill.
38.4.1 Shape
Inside geom_point(), we can set shape to 21, and color to "#000000" to outline the points in black
show/hide
ggp2_grp_bubble_s21 <- penguins |>
  ggplot(aes(
    x = bill_length_mm, y = flipper_length_mm)) +
  geom_point(
    aes(size = body_mass_g, fill = species),
        alpha = 2/3, shape = 21, color = "#000000") +
  scale_size(range = c(.04, 6))

ggp2_grp_bubble_s21 +
  labs_grp_bubble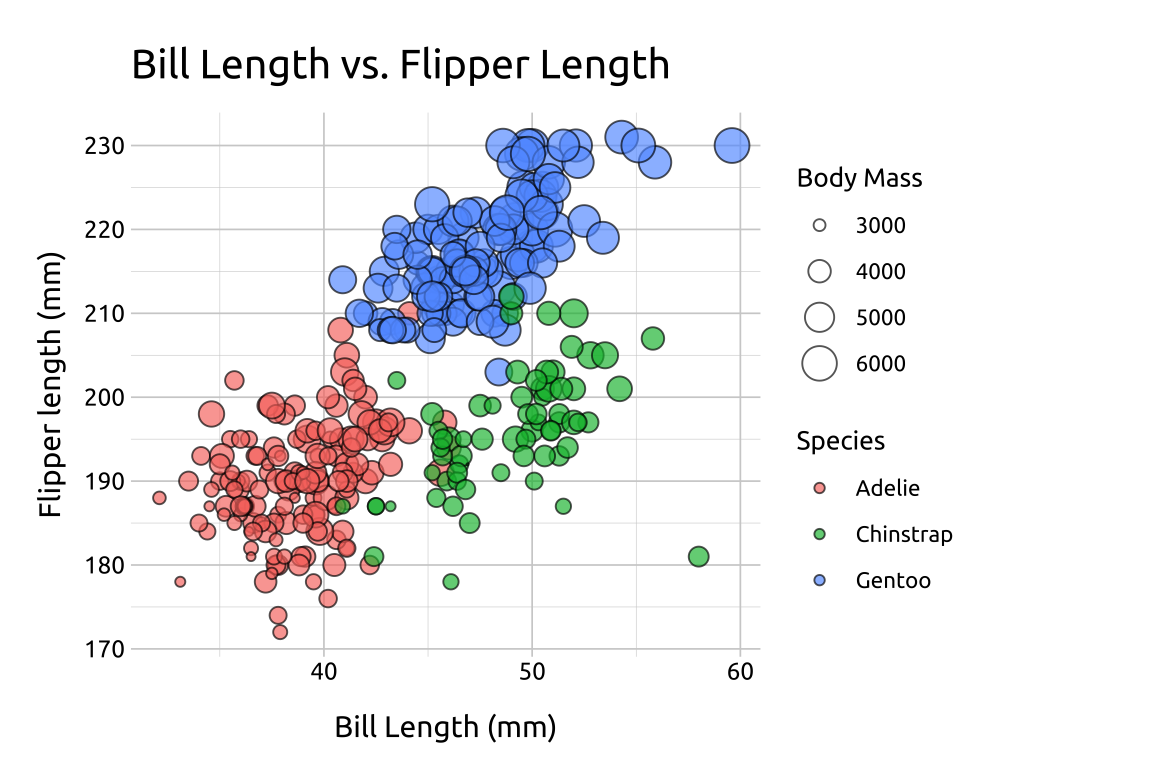
38.4.2 Color
Inside the aes() of geom_point(), we can set shape to 21, and map color to "species" to outline the points in the same colors as fill
show/hide
ggp2_grp_bubble_s21_color <- penguins |>
  ggplot(aes(
    x = bill_length_mm, y = flipper_length_mm)) +
  geom_point(
    aes(size = body_mass_g,
        fill = species,
        color = species),
        alpha = 2/3, shape = 21) +
  scale_size(range = c(.04, 6))

ggp2_grp_bubble_s21_color +
  labs_grp_bubble