18 Treemaps
18.1 Description
Treemaps display proportionally divided rectangular hierarchies for levels of categorical variables. The layout consists of ‘squarified’ tiles, which display the relative contribution of each categorical value to the overall graph space.
We’ll build a treemap using the treemapify package. Also check out mosaic plots.
18.2 Set up
PACKAGES:
Install packages.
show/hide
# pak::pak("wilkox/treemapify")
# install.packages("palmerpenguins")
library(treemapify)
library(palmerpenguins)
library(ggplot2)
DATA:

Filter the missing values from sex, group the data by species, island, and sex, then count the species and island (then ungroup()).
show/hide
treemap_peng <- penguins |>
    dplyr::select(species, island, sex) |>
    tidyr::drop_na() |>
    dplyr::group_by(species, island, sex) |>
    dplyr::count(species, island, sex) |>
    ungroup()
glimpse(treemap_peng)
#> Rows: 10
#> Columns: 4
#> $ species <fct> Adelie, Adelie, Adelie, Adelie, …
#> $ island  <fct> Biscoe, Biscoe, Dream, Dream, To…
#> $ sex     <fct> female, male, female, male, fema…
#> $ n       <int> 22, 22, 27, 28, 24, 23, 34, 34, …
18.3 Grammar
CODE:
Create labels with
labs()Initialize the graph with
ggplot()and providedataMap the
ntoarea,sextofillandlabel,speciestosubgroup, andislandtosubgroup2Add
geom_treemap()Add
geom_treemap_text()place: this controls where the boxes startcolor: text colormin.size: the minimum font size (when re-sizing)alpha: opacityfontface:itlalic/bondfamily:"sans"/"sansserif"/"mono"
show/hide
labs_treemap <- labs(
  title = "Adult foraging penguins",
    fill = "Sex")
ggp2_treemap <- ggplot(treemap_peng,
       aes(area = n,
           fill = sex,
           label = sex,
           subgroup = species,
           subgroup2 = island)) +
       treemapify::geom_treemap() +
       treemapify::geom_treemap_text(
           place = "bottomright",
           color = "#d0d0d0",
           min.size = 0,
           alpha = 0.90,
           fontface = "italic",
           family = "sans")
ggp2_treemap +
  labs_treemap
GRAPH:
show/hide
labs_treemap <- labs(
  title = "Adult foraging penguins",
    fill = "Sex")
ggp2_treemap <- ggplot(treemap_peng,
       aes(area = n,
           fill = sex,
           label = sex,
           subgroup = species,
           subgroup2 = island)) +
       treemapify::geom_treemap() +
       treemapify::geom_treemap_text(
           place = "bottomright",
           color = "#d0d0d0",
           min.size = 0,
           alpha = 0.90,
           fontface = "italic",
           family = "sans")
ggp2_treemap +
  labs_treemap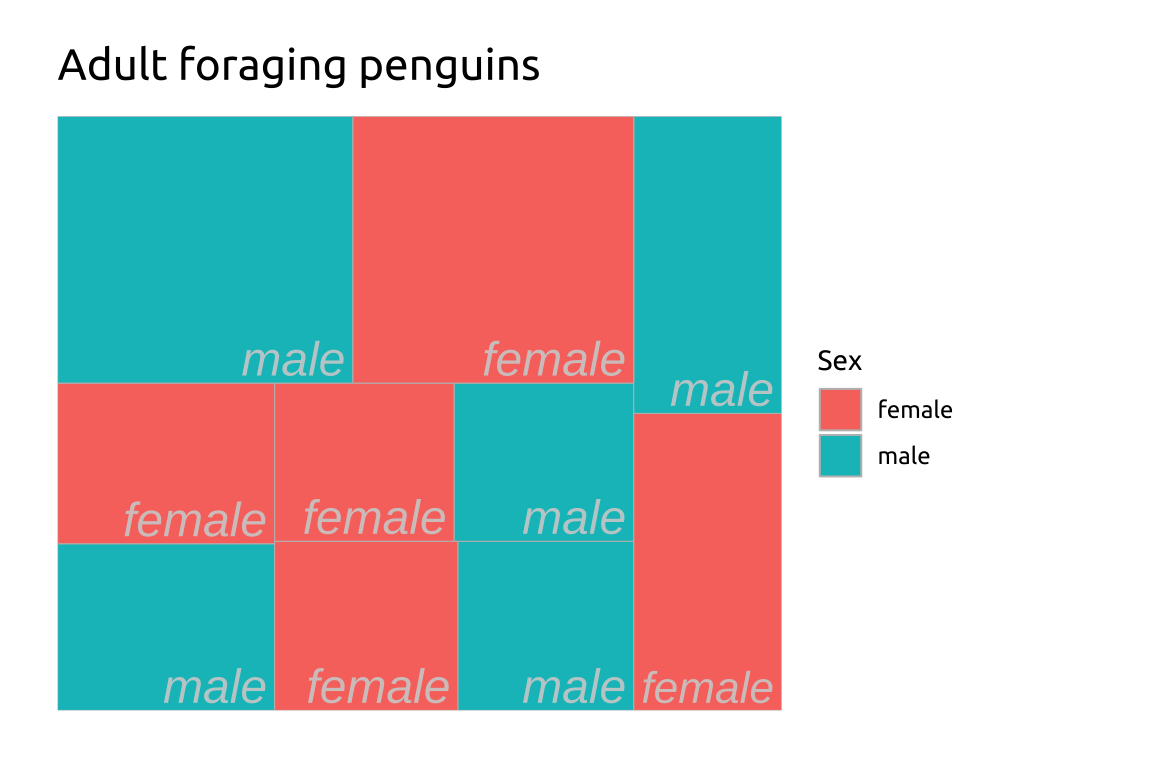
18.4 More info
treemapify has multiple options for building treemaps. We cover a few of these below, but you should check out the package vignette.
18.4.1 Subgroup
ggplot2 build layers in the order they’re written, so it’s advised to build the subgroups in order from “from deepest to shallowest”, with subgroups2 first (ending on subgroup)
Add
geom_treemap_subgroup2_border()- Set the
sizeandcolor
- Set the
Add
geom_treemap_subgroup2_text()place: this controls where the boxes startcolor: text colormin.size: the minimum font size (when re-sizing)alpha: opacityfontface:itlalic/bondfamily:"sans"/"sansserif"/"mono"
See full list of arguments here.
show/hide
ggp2_tm_subgroup <- ggp2_treemap +
    treemapify::geom_treemap_subgroup2_border(
           color = "#02577A",
           size = 4.0) +
       treemapify::geom_treemap_subgroup2_text(
           place = "center",
           alpha = 0.65,
           color = "#02577A",
           min.size = 0,
           family = "sans")
ggp2_tm_subgroup +
  labs_treemap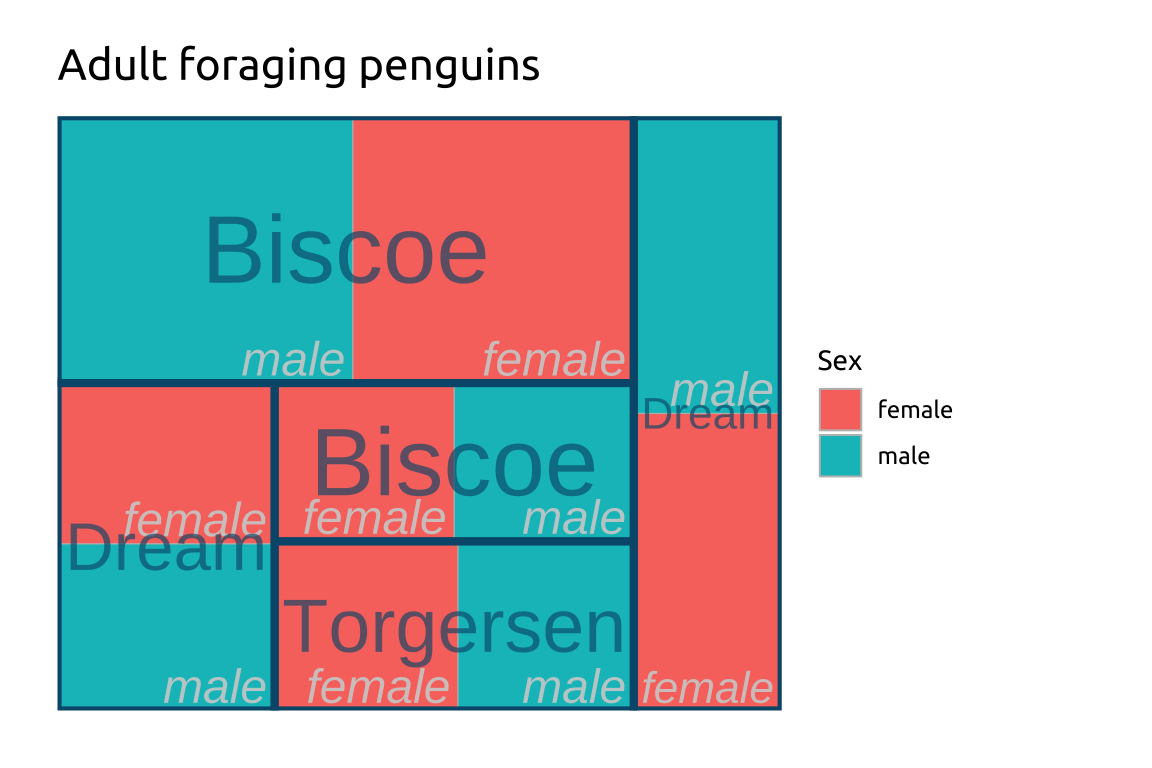
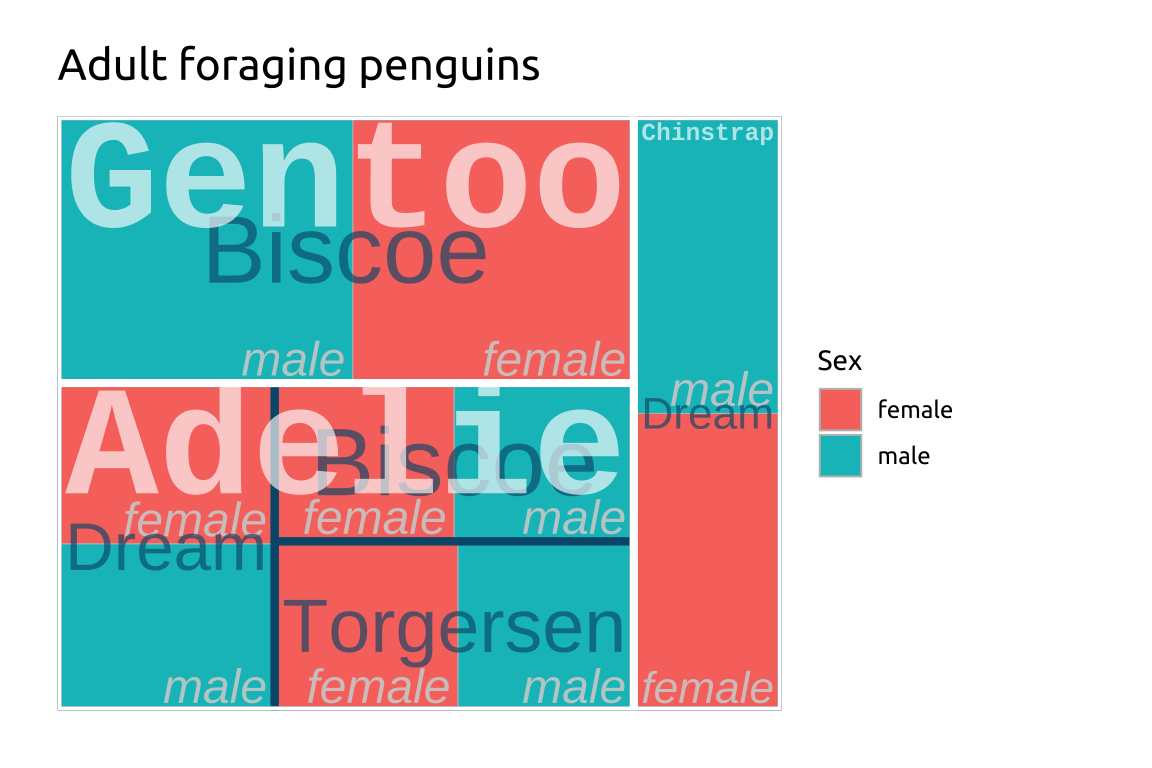
18.4.2 Subgroup 2
Add
geom_treemap_subgroup_border()- Set the
sizeandcolor
- Set the
Add
geom_treemap_subgroup_text()place: this controls where the boxes startcolor: text colormin.size: the minimum font size (when re-sizing)alpha: opacityfontface:itlalic/bondfamily:"sans"/"sansserif"/"mono"
show/hide
ggp2_tm_subgroup2 <- ggp2_tm_subgroup +
       treemapify::geom_treemap_subgroup_border(
           color = "#ffffff",
           size = 4) +
       treemapify::geom_treemap_subgroup_text(
           place = "topleft",
           alpha = 0.65,
           grow = TRUE,
           color = "#ffffff",
           min.size = 0,
           family = "mono",
           fontface = "bold")

ggp2_tm_subgroup2 +
  labs_treemap